


Hand grip strength—measured by dynamometry—is an essential tool in nutritional assessment, particularly for detecting sarcopenia, even before weight or muscle mass loss is evident. In individuals with obesity, hand grip strength can help identify muscle weakness that may not be apparent due to high body mass. The purpose of this study is to describe the absolute and adjusted hand grip strength values for weight, height, body mass index (BMI), and appendicular skeletal muscle mass (ASMM) in obese patients. It also aims to determine the prevalence of low muscle strength in this group of patients and to compare these results with those obtained in a healthy population.
MethodsProspective observational study including patients with obesity and healthy volunteers. Absolute and adjusted hand grip strength values for weight, height, BMI and appendicular muscle mass were determined in patients with obesity and compared with the results of healthy volunteers. Muscle strength was measured by hand grip strength according to Sánchez-Torralvo, Dodds, and < −2SD cut-off points of healthy reference population.
ResultsThe results obtained show that the absolute hand grip strength values are higher in healthy volunteers (30.7 ± 10.5 kg) vs patients with obesity (26.6 ± 9.7 kg); p < 0.008. As for hand grip strength values adjusted for height, weight, BMI and ASMM, they are also statistically significantly higher in healthy volunteers (18.0 ± 5.5 vs. 15.9 ± 5.4, p < 0.014; 05 ± 0.10 vs. 0.2 ± 0.06, p < 0.001; 1.4 ± 0.4 vs. 0.6 ± 0.2, p < 0.001; 1.5 ± 0.2 vs. 0.9 ± 0.3, p < 0.001). According to sex, men had significantly higher absolute and adjusted hand grip strength values in both obese patients and healthy volunteers. The prevalence of low muscle strength in patients with obesity goes from 14.5% up and 23.4% depending on the cut-off points used, being higher with those of Sánchez-Torralvo´s cut-off points. Based on sex distribution, obese men had a higher prevalence of low muscle strength with absolute hand grip strength values vs women, being these differences statistically significant only with the Sánchez-Torralvo´s cut-off points. In terms of the prevalence of low muscle strength with adjusted hand grip strength values, more variable percentages (3.2%–96.8%) were observed without clear differences across sexes.
ConclusionsHand grip strength values in obese patients vary according to absolute or adjusted measurements. Obese patients have lower absolute and adjusted hand grip strength values vs the healthy population. However, more studies are needed to establish specific cut-off points for hand grip strength in patients with obesity.
La dinamometría es una herramienta esencial en la evaluación nutricional y funcional. En personas con obesidad, la dinamometría puede ayudar a identificar debilidades musculares que podrían no ser evidentes a simple vista debido a la masa corporal elevada. El objetivo de este estudio es describir los valores de dinamometría absolutos y ajustados a peso, talla, Índice de Masa Corporal (IMC) y masa muscular apendicular (MMA) en pacientes con obesidad; determinar la prevalencia de baja fuerza muscular en este grupo de pacientes y comparar estos resultados con los obtenidos en una población sana.
Materiales y métodosEstudio observacional prospectivo de pacientes con obesidad y voluntarios sanos. Se determinaron valores de dinamometría absolutos y ajustados al peso, talla, el IMC y MMA en pacientes con obesidad y se compararon con los resultados de voluntarios sanos. La fuerza muscular se midió mediante la dinamometría con puntos de corte de Sánchez-Torralvo, Dodds y < −2SD de la población sana de referencia.
ResultadosLos valores absolutos de dinamometría son superiores en los voluntarios sanos (30,7 ± 10,5 kg) en comparación con los pacientes con obesidad (26,6 ± 9,7 kg); p < 0,008. Los valores de dinamometría ajustados por talla, peso, IMC y MMA, también son estadísticamente significativamente superiores en los voluntarios sanos (18,0 ± 5,5 frente a 15,9 ± 5,4, p < 0,014; 05 ± 0,10 frente a 0,2 ± 0,06, p < 0,001; 1,4 ± 0,4 frente a 0,6 ± 0,2, p < 0,001; 1,5 ± 0,2 frente a 0,9 ± 0,3, p < 0,001). Según el sexo, los hombres presentaron valores de dinamometría absolutos y ajustados significativamente superiores tanto en pacientes con obesidad como en voluntarios sanos. La prevalencia de fuerza muscular baja en pacientes con obesidad oscila entre el 14,5 y el 23,4% según los puntos de corte utilizados, siendo mayor con los de Sánchez-Torralvo. Según distribución por sexo, los varones con obesidad presentaban prevalencias de baja fuerza muscular con valores de dinamometría absoluta más elevadas que las mujeres, siendo estas diferencias estadísticamente significativas exclusivamente con puntos de corte de Sánchez-Torralvo. La prevalencia de baja fuerza muscular con valores de dinamometría ajustada es variable (3,2–96,8%) y sin claras diferencias entre sexos.
ConclusionesLos valores de dinamometría en población con obesidad varían en función de determinaciones absolutas o ajustadas. Los pacientes con obesidad presentan valores de dinamometría absoluta y ajustada más bajos que población sana, con una prevalencia de baja fuerza muscular no desdeñable, pudiendo condicionar un mayor deterioro de la condición física. Sin embargo, son necesarios más estudios para establecer puntos de corte específicos de dinamometría en poblaciones con obesidad.
Handgrip strength measured by dynamometry is a useful and non-invasive tool in nutritional assessment, especially for evaluating the status of muscle function.1 Dynamometry is a predictor of cardiometabolic diseases, disability, and early morbidity and mortality.2 A reduction in handgrip strength is directly related to a deterioration in physical condition, affecting gait speed and balance, increasing the risk of falls.3 The loss of muscle strength can be an early sign of malnutrition, even before weight loss or reduction in muscle mass becomes apparent, being fundamental for the detection of sarcopenia and different degrees of malnutrition. Furthermore, dynamometry allows monitoring changes in muscle strength over time, which is useful for evaluating the effectiveness of nutritional and exercise interventions.4 Dynamometry results can vary depending on the patient's motivation and the technique used; in addition, they are vs reference values adjusted for age and sex to determine if muscle strength is adequate.5 Although dynamometry is a good indicator of overall strength, it does not provide detailed information on body composition or the distribution of muscle mass; therefore, it is important to interpret the results in the context of other clinical and nutritional assessments to obtain a complete picture of the patient's health status.6 In people with obesity, evaluating dynamometry can help identify muscle weaknesses that might not be evident at first glance due to high body mass.7 Sarcopenic obesity is a condition where adiposity and loss of muscle mass and function coexist, so for its diagnosis, an assessment of muscle strength by dynamometry is necessary.8 Studies have observed that although people with obesity may have greater absolute muscle mass vs people of normal weight, muscle quality and relative strength (strength in relation to body weight) may be diminished. For example, in their study of 180 patients, Lad et al.9 observed lower dynamometry values in overweight patients vs normal-weight patients in both men (31.16 ± 2.06 vs 33.33 ± 2.58) and women (24.5 ± 6.37 vs 26.8 ± 3.25), but without statistically significant differences. Therefore, using dynamometry values adjusted for body weight, body mass index (BMI), or muscle mass can help evaluate this discrepancy and better understand the functionality of the patient with obesity.10 Sarcopenic obesity is a complex condition in which obesity and sarcopenia, that is, the loss of muscle mass and strength, coexist. This combination has significant implications for the health of patients with obesity and may imply an increase in medical complications, such as metabolic syndrome, metabolic-associated fatty liver disease, and a greater risk of bone fractures, with an impact on the patient's quality of life and economic resources.11 In summary, dynamometry is a valuable tool in the assessment of obesity and provides fundamental information about muscle strength and patient functionality. The hypothesis of this study is to determine the importance of adjusted dynamometry values in patients with obesity and the prevalence of low muscle mass. The objectives of the study were to describe the absolute dynamometry values and those adjusted for weight, height, BMI, and appendicular muscle mass in patients with obesity candidates for bariatric surgery; to determine the prevalence of low muscle strength in this group of patients with both absolute and adjusted dynamometry values; and to compare the results of absolute and adjusted dynamometry in patients with obesity with those obtained in a healthy population.
MethodologyStudy design and populationWe conducted a prospective observational study, including patients with obesity referred from primary care or other specialists to the high-risk obesity unit of the Complejo Asistencial Universitario de León from August 1st, 2017, through November 1st, 2021, and healthy volunteers, included from January 2021 through October 2021.
Inclusion criteriaHigh-risk obesity group:
- 1
Patients with high-risk obesity with BMI > 40 kg/m² or BMI 35−40 kg/m² with comorbidities susceptible to improvement with surgical treatment and after failure of previously performed medical-dietary treatment.
- 2
Age between 18 and 60 years.
- 3
Acceptance to participate in the study and completion of informed consent.
Healthy volunteer group:
- 1
Spanish volunteers, workers of the Complejo Asistencial Universitario de León without previous pathologies and with BMI between 17 and 29 kg/m².
- 2
Age between 18 and 45 years.
- 3
Acceptance to participate in the study and completion of informed consent.
- 1
Physical inability to perform specific tests.
- 2
Being a pacemaker carrier, due to the impossibility of performing bioimpedance.
- 3
Refusal to participate in the study and/or not signing the informed consent.
The study was conducted in accordance with the World Medical Association Declaration of Helsinki and approval was obtained from the Research Ethics Committee of the Complejo Asistencial Universitario de León, with file numbers 2049 and 21166. All included patients were duly informed of the implications of participating in the study and signed the informed consent. This study was conducted respecting the 1964 Declaration of Helsinki of the World Medical Association. The researchers participating in this study undertook that all clinical data collected belonging to the subjects included in the study would be separated from personal identification data to ensure patient anonymity. This research has not received specific funding from public sector agencies, commercial sector, or non-profit entities.
Study variablesThe following variables were recorded:
- •
Sociodemographic: age and sex.
- •
Anthropometric: height, weight, and BMI.
- •
Body composition by bioimpedance (BIA, TANITA MC 780 MA; TANITA, Tokyo, Japan): weight, BMI, fat mass, fat-free mass, lean mass, skeletal muscle mass, appendicular skeletal muscle mass (ASM), total body water, resistance, reactance, and phase angle. For the BIA, the included subjects had to be standing and barefoot, covering the platform electrodes adequately and holding the handles with their arms a few centimeters from the hip. Participants were instructed to avoid vigorous exercise and alcohol consumption for 24 h before the test, requiring fasting for, at least, 2 h and emptying the bladder before measurement.
- •
Handgrip strength by dynamometry (Dynex®, Fabrication Enterprises, DynExgrip). The technique was performed with the patient seated in a chair with a backrest, with the shoulder and forearm in a neutral position, while the entire arm should be at a 90 ° angle, verbally encouraging the patient to achieve better performance. The highest result of 3 consecutive measurements of the dominant handgrip strength was recorded.12
- •
Surrogate indices to adjust dynamometry to body composition:
- o
Dynamometry/weight: muscle strength determined by dynamometry and divided by body weight.
- o
Dynamometry/height: muscle strength determined by dynamometry and divided by height.
- o
Dynamometry/BMI: muscle strength determined by dynamometry and divided by BMI.
- o
Dynamometry/ASM: muscle strength determined by dynamometry and divided by appendicular muscle mass.
- o
Absolute dynamometry. There are different cut-off points published in the literature to define low muscle strength according to dynamometry. In our study, we used those proposed by Dodds13 (<16 kg in women and <27 kg in men), Sánchez-Torralvo14 (men <45 years: <32.6 kg, 45–60 years: <34.5 kg; women <45 years: <18 kg, 45–60 years: <15 kg) and those from a population of healthy volunteers in our area15 (<25.10 kg in men and <16.8 kg in women).
Dynamometry adjusted for body weight. The dynamometry/weight parameter indicates a person's muscle strength in relation to their body weight. Most published scores for this parameter usually range between 0.10 and 1.16 Considering the −2 SD cut-off points for dynamometry/weight of the healthy reference population, the cut-off points would be <0.32 in women and <0.35 in men.15
Dynamometry adjusted for BMI. The dynamometry/BMI parameter indicates a person's muscle strength in relation to their BMI. Pathological cut-off points published in the literature are <1 in men and <0.56 in women.17 Considering the −2 SD cut-off points for dynamometry/BMI of the healthy reference population, the cut-off points are <0.78 for women and <1.1 for men.15
Dynamometry adjusted for ASM. The dynamometry/ASM parameter indicates a person's muscle strength in relation to their appendicular muscle mass (ASM).18 As cut-off points for dynamometry/ASM with BIA, the normality values of our reference sample (−2 SD) were used, considering that the dynamometry/ASM index is decreased if it is <1 in the case of men or <1.1 in the case of women.15
Dynamometry adjusted for height. The dynamometry/height parameter indicates a person's muscle strength in relation to height. As cut-off points for dynamometry/height, the normality values of our reference sample (−2 SD) were used, considering that the dynamometry/height index is decreased if it is <14.54 in the case of men or <10.58 in the case of women.15
Statistical analysisStatistical analysis was performed using the IBM SPSS Statistics 15® program, available at the Research Unit of the Complejo Asistencial Universitario de León. Data were incorporated into a database created for this purpose, along with data from the patient's electronic medical record. Qualitative variables were expressed as absolute or relative frequencies (percentages), and quantitative variables using the mean and standard deviation (SD) in case of normal distribution or as median and interquartile range (IQR) if the distribution was not normal. Normality was defined by the Kolmogorov-Smirnov test. A descriptive study of the different absolute and relative dynamometry variables was performed in both groups of subjects, and a comparative study between them. Parametric (Student's t-test) or non-parametric (Mann–Whitney U test) statistical tests required by the conditions of normality and non-normality, respectively, were used to study the differences between two independent means. Student's t-test (normal variables) and Wilcoxon signed-rank test (non-normal variables) were used to study the differences between paired variables. Statistical significance was considered if the p-value was <0.05.
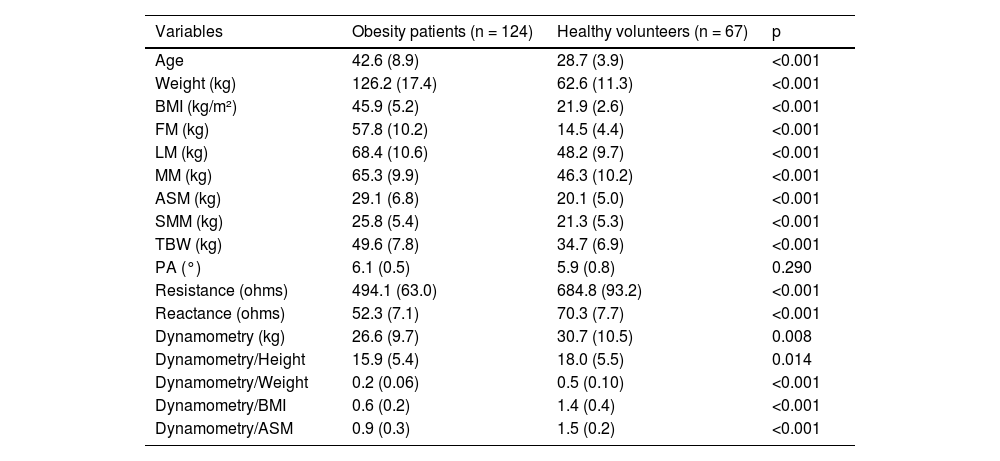
ResultsA total of 124 patients were recruited in the high-risk obesity group, 89 of whom were women (71.8%). In the healthy volunteer group, 67 subjects were included, 48 of whom were women (71.6%). The rest of the baseline characteristics of each group are shown in Table 1.
Comparison of baseline characteristics of the obesity patient group and healthy volunteers.
| Variables | Obesity patients (n = 124) | Healthy volunteers (n = 67) | p |
|---|---|---|---|
| Age | 42.6 (8.9) | 28.7 (3.9) | <0.001 |
| Weight (kg) | 126.2 (17.4) | 62.6 (11.3) | <0.001 |
| BMI (kg/m²) | 45.9 (5.2) | 21.9 (2.6) | <0.001 |
| FM (kg) | 57.8 (10.2) | 14.5 (4.4) | <0.001 |
| LM (kg) | 68.4 (10.6) | 48.2 (9.7) | <0.001 |
| MM (kg) | 65.3 (9.9) | 46.3 (10.2) | <0.001 |
| ASM (kg) | 29.1 (6.8) | 20.1 (5.0) | <0.001 |
| SMM (kg) | 25.8 (5.4) | 21.3 (5.3) | <0.001 |
| TBW (kg) | 49.6 (7.8) | 34.7 (6.9) | <0.001 |
| PA (°) | 6.1 (0.5) | 5.9 (0.8) | 0.290 |
| Resistance (ohms) | 494.1 (63.0) | 684.8 (93.2) | <0.001 |
| Reactance (ohms) | 52.3 (7.1) | 70.3 (7.7) | <0.001 |
| Dynamometry (kg) | 26.6 (9.7) | 30.7 (10.5) | 0.008 |
| Dynamometry/Height | 15.9 (5.4) | 18.0 (5.5) | 0.014 |
| Dynamometry/Weight | 0.2 (0.06) | 0.5 (0.10) | <0.001 |
| Dynamometry/BMI | 0.6 (0.2) | 1.4 (0.4) | <0.001 |
| Dynamometry/ASM | 0.9 (0.3) | 1.5 (0.2) | <0.001 |
TBW: Total body water; PA: Phase angle; SD: Standard deviation; BMI: Body mass index; FM: Fat mass; LM: Lean mass; MM: Muscle mass; ASM: Appendicular skeletal muscle mass; SMM: Skeletal muscle mass.
The absolute and body size-adjusted dynamometry values by sex in patients with obesity and healthy volunteers are shown in Table 2.
Dynamometry values by sex in obesity patients and healthy volunteers.
| Obesity patients (n = 124) | Healthy volunteers (n = 67) | |||||
|---|---|---|---|---|---|---|
| Male (n = 35) | Female (n = 89) | p | Male (n = 19) | Female (n = 48) | p | |
| Dynamometry (kg) | 34.8 (16.6) | 22.4 (7.4) | < 0.001 | 44.2 (16.0) | 25.1 (6.5) | < 0.001 |
| Dynamometry/Height | 20.1 (8.2) | 14.4 (6.4) | < 0.001 | 25.2 (8.6) | 15.1 (3.7) | < 0.001 |
| Dynamometry/Weight | 0.3 (0.07) | 0.2 (0.06) | < 0.001 | 0.6 (0.2) | 0.4 (0.1) | < 0.001 |
| Dynamometry/BMI | 0.8 (0.3) | 0.5 (0.2) | < 0.001 | 1.8 (0.7) | 1.2 (0.3) | < 0.001 |
| Dynamometry/ASM | 0.9 (0.3) | 0.91 (0.3) | 0.473 | 1.6 (0.3) | 1.5 (0.2) | 0.008 |
BMI: Body mass index; ASM: Appendicular skeletal muscle mass.
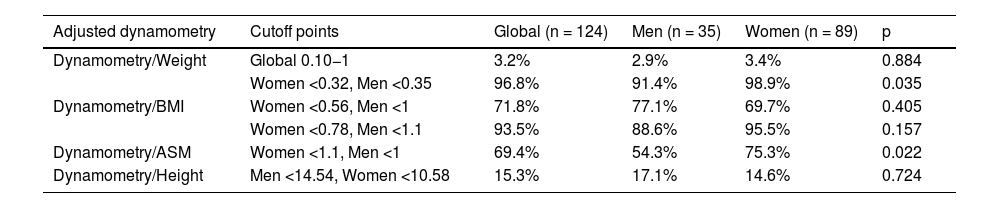
The prevalence of low muscle strength according to absolute dynamometry with the cut-off points of Dodds,13 Sánchez-Torralvo,14 and data from the reference population15 ranged between 14.5% and 23.4% and are shown in Table 3, with statistically significant differences between sexes exclusively with the cut-off points of Sánchez-Torralvo.14 The prevalence of low muscle strength adjusted for weight, BMI, height, and ASM are more variable, between 3.2% and 96.8%, and are shown in Table 4.
Prevalence of low muscle strength in obesity patients according to different absolute dynamometry cutoffs, globally and by sex.
| Low Dynamometry | Global (n = 124) | Men (n = 35) | Women (n = 89) | p |
|---|---|---|---|---|
| Sánchez-Torralvo14 | 23.4% (n = 29) | 40% (n = 14) | 16.9% (n = 15) | 0.006 |
| Dodds13 | 14.5% (n = 18) | 17.1% (n = 6) | 13.5% (n = 12) | 0.603 |
| Reference Population15 | 16.1% (n = 20) | 17.1% (n = 6) | 15.7% (n = 14) | 0.847 |
Prevalence of low muscle strength in obesity patients according to different adjusted dynamometry cutoffs, globally and by sex.
| Adjusted dynamometry | Cutoff points | Global (n = 124) | Men (n = 35) | Women (n = 89) | p |
|---|---|---|---|---|---|
| Dynamometry/Weight | Global 0.10−1 | 3.2% | 2.9% | 3.4% | 0.884 |
| Women <0.32, Men <0.35 | 96.8% | 91.4% | 98.9% | 0.035 | |
| Dynamometry/BMI | Women <0.56, Men <1 | 71.8% | 77.1% | 69.7% | 0.405 |
| Women <0.78, Men <1.1 | 93.5% | 88.6% | 95.5% | 0.157 | |
| Dynamometry/ASM | Women <1.1, Men <1 | 69.4% | 54.3% | 75.3% | 0.022 |
| Dynamometry/Height | Men <14.54, Women <10.58 | 15.3% | 17.1% | 14.6% | 0.724 |
BMI: Body mass index; ASM: Appendicular skeletal muscle mass.
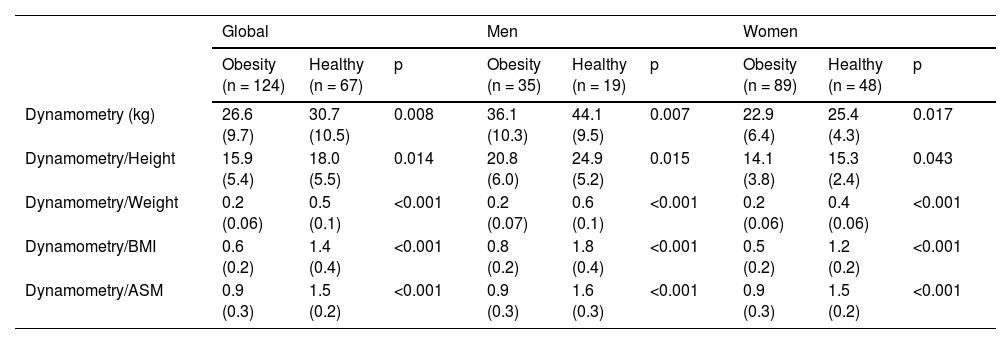
A comparison of absolute and body size-adjusted dynamometry values was performed between patients with obesity and healthy volunteers, the results of which are shown in Table 5.
Comparison of absolute and adjusted dynamometry values in obesity patients and healthy volunteers, globally and by sex.
| Global | Men | Women | |||||||
|---|---|---|---|---|---|---|---|---|---|
| Obesity (n = 124) | Healthy (n = 67) | p | Obesity (n = 35) | Healthy (n = 19) | p | Obesity (n = 89) | Healthy (n = 48) | p | |
| Dynamometry (kg) | 26.6 (9.7) | 30.7 (10.5) | 0.008 | 36.1 (10.3) | 44.1 (9.5) | 0.007 | 22.9 (6.4) | 25.4 (4.3) | 0.017 |
| Dynamometry/Height | 15.9 (5.4) | 18.0 (5.5) | 0.014 | 20.8 (6.0) | 24.9 (5.2) | 0.015 | 14.1 (3.8) | 15.3 (2.4) | 0.043 |
| Dynamometry/Weight | 0.2 (0.06) | 0.5 (0.1) | <0.001 | 0.2 (0.07) | 0.6 (0.1) | <0.001 | 0.2 (0.06) | 0.4 (0.06) | <0.001 |
| Dynamometry/BMI | 0.6 (0.2) | 1.4 (0.4) | <0.001 | 0.8 (0.2) | 1.8 (0.4) | <0.001 | 0.5 (0.2) | 1.2 (0.2) | <0.001 |
| Dynamometry/ASM | 0.9 (0.3) | 1.5 (0.2) | <0.001 | 0.9 (0.3) | 1.6 (0.3) | <0.001 | 0.9 (0.3) | 1.5 (0.2) | <0.001 |
BMI: Body Mass Index, ASM: Appendicular Skeletal Muscle Mass.
Absolute and adjusted dynamometry values are higher in healthy volunteers vs patients with obesity. By sex, men had significantly higher absolute and adjusted dynamometry values in both patients with obesity and healthy volunteers. The prevalence of low muscle strength in patients with obesity ranges between 14.5% and 23.4%, depending on the cut-off points used, being higher with the Sánchez-Torralvo14 cut-off points. Although grip strength is similar between men and women until adolescence, from that stage onwards men tend to increase their strength more rapidly, reaching a median peak of 51 kg between 29 and 39 years, in contrast to the median peak of 31 kg in women between 26 and 42 years.13 In our study, both in patients with obesity and in healthy volunteers, dynamometry values are significantly higher in men, similarly to the results obtained in other studies.19,20 This can be explained by a biological factor, which implies that women have a lower muscle mass content than men, due to differences in sex hormones such as testosterone, an anabolic hormone that promotes muscle mass growth and is present at a higher level in men.21 The prevalence of low muscle strength in our population was higher with the Sánchez-Torralvo cut-off points than with those of Dodds and the healthy reference population. We prefer the Sánchez-Torralvo cut-off point because their study establishes normality values of hand muscle strength in 817 healthy adults, aged between 18 and 65 years, recruited from Malaga, making the population more similar to ours, unlike the Dodds study, in which a high prevalence of weak grip strength is found based on a −2 SD score (equivalent to 19 kg in women and 32 kg in men, or lower), with almost half of the participants at or below this level at 80 years and based on a −2.5 SD score (equivalent to 16 kg in women and 27 kg in men) with 23.0% of men and 26.6% of women at or below this level at 80 years.13,14 However, neither study includes patients with obesity; therefore, this may be a limitation when using these cut-off points to assess muscle strength in patients with obesity. Obesity can influence grip strength due to the distribution of body fat and fat infiltration into muscle, altering the distribution of muscle fibers and thus limiting muscle function.22–24 The results of the study by Abdalla et al.25 revealed significant variations in BMI-adjusted grip strength among participating countries, which included China, Ghana, India, Mexico, Russia, and South Africa. These disparities highlight the importance of normalizing grip strength to reduce the impact of body size variability on such measurements. This normalization involves dividing absolute grip strength by different parameters, such as weight, BMI, height, or muscle mass. Adjusted dynamometry thus becomes a dimensionless variable.16
In the comparison of our group of patients with obesity and healthy subjects, it can be observed that all parameters of muscle strength by dynamometry in absolute values or adjusted for weight, height, BMI, or ASM are lower in patients with obesity in a statistically significant way. These findings may be due to adiposity and fat infiltration of the muscle in patients with high-risk obesity. This fat infiltration of the muscle, called myosteatosis, is not appreciated in body composition, but it may be what is reflected in worse values of strength adjusted by mass in this population group.26
Among the strengths of the study is the inclusion of a control group composed of healthy individuals to compare the differences in absolute and adjusted dynamometry, providing a clearer context in the interpretation of the results. The study contributes to filling a gap in the existing literature on the assessment of adjusted muscle strength in patients with obesity, offering possible directions for future research. Regarding the limitations of the study, we find the small sample size of the included healthy population, which prevents a more realistic comparison with the group of patients with obesity. Another limitation is the absence of specific cut-off points for absolute or adjusted dynamometry in the obese population, which implies that the prevalence of low muscle strength may be quite variable depending on the selected cut-off point. In addition, in most measurements of the studies in the review by Dodds and Sánchez-Torralvo, the JAMAR® dynamometer was used, a different model from the one used in our study, which may lead to differences in the measurements taken; however, published studies indicate that the concurrent validity between the 2 instruments is excellent. Therefore, the Dynex® dynamometer can be used knowing that its results are valid and comparable with the JAMAR® dynamometer.27 On certain occasions, it may happen that grip strength is greater with the non-dominant hand, or that there are asymmetries between both limbs. This fact can only be demonstrated by taking measurements in both hands. These issues have not been evaluated in the study population, so it may be a limitation in the interpretation of the results.
Therefore, it is clear that excess adiposity has implications for health and can influence muscle strength, especially in relation to muscle weakness and other adverse outcomes. However, more population-based studies in patients with obesity are needed, with a sufficient sample size to obtain specific cut-off points for dynamometry, both absolute and adjusted to other parameters.
ConclusionsThe prevalence of low muscle strength varies according to the cut-off points used. In this study, the Sánchez-Torralvo cut-off points showed a higher prevalence of low muscle strength vs those of Dodds and the healthy reference population. Adjusting dynamometry values for body weight, BMI, height, or appendicular muscle mass is crucial to reduce the impact of body size variability on strength measurements. More studies are needed to establish specific cut-off points and better understand the relationship between adiposity and muscle strength in the obese population.
FundingNone declared.
The following is Supplementary data to this article:
