


Mexico signed in 1993, with the us and Canada, the North American Free Trade Agreement (nafta) which entered into operation in January 1994. In all these years, there have been a few formal assessments of nafta, from the Mexican side. Even fewer convincing answers for basic questions regarding why the governments of the us and Mexico signed such an agreement at that time.
In this paper we evaluate the performance of the opening of the economy and nafta, as a growth strategy, in three main economic variables: Gross Domestic Product, Exports and Employment. Also, we propose answers for the two political economy questions mentioned above.
Using hard data, we prove that neoliberal reforms that started in 1982, of which nafta is one of prime political importance, have failed completely in promoting economic growth and employment and that the benefits of growing exports have accrued mostly to private us firms.
México firmó en 1993, con Estados Unidos y Canadá, el Tratado de Libre Comercio (nafta) que entró en operación en enero de 1994. En estos años, hubo evaluaciones formales de nafta, del lado mexicano. Incluso menos convenciendo por las respuestas que ofrecía para cuestiones básicas en cuanto a por qué los gobiernos de Estados Unidos y México firmaron en aquel tiempo tal acuerdo. En este artículo evaluamos el funcionamiento de la apertura de la economía y el nafta, como una estrategia de crecimiento, en tres variables económicas principales: Producto Interior Bruto, Exportaciones y Empleo. También proponemos respuestas para las dos preguntas de economía política mencionadas anteriormente. Con datos duros, demostramos que las reformas neoliberales que comenzaron en 1982, de cual de las cuales el nafta es una de importancia política principal, han fallado completamente en la promoción del crecimiento económico y el empleo y que las ventajas de fomentar las exportaciones han beneficiado sobre todo a firmas privadas estadounidenses.
Among some Mexican analysts there has always been the idea that the following question has not been clearly answered: Why was the Mexican government interested in joining nafta? This, despite that Mexico was already enjoying the benefits of full free trade since joining the gatt (today's wto) in 1986 and had been receiving for many years the Most Favored Nation's treatment by the United States, regarding trade.
Another question, but in the opposite direction, has not also been satisfactorily answered: What was the reason the us accepted Mexico to join nafta? This, considering that for the us, North America is really two countries at most: the us and Canada, and Mexico in those years had lost all power of trade negotiation having joined the gatt, in other words, it was already open to free foreign trade.
The Mexican economy performance from 1982 to 1993 proved that its strategy for growth based on exports, by means of opening the economy, depreciating the currency, and reducing the role of the state to a minimum, was badly failing in terms of economic growth, jobs creation, as to prevent migration to the us, and trade balance. So, the strategy needed some adjustment and this came as a complete reforming of the Mexican law of foreign investment. The President of Mexico at that time campaigned in the early nineties in the us, in favor of nafta, promising this change of the law and allowing new us investors to import all sorts of inputs from anywhere in the world, to produce exports.
Besides, since Mexico had successfully grown economically and to some degree industrialized the economy in the period 1951-1981, under a so-called state-led growth strategy, the risk that any new president would be tempted to return to this strategy was high, so nafta was interpreted as a political lock up for all the neoliberal reforms.
On the other hand, given that migration from Mexico to the us was unstoppable for Mexico and unacceptable for the us, nafta could not include any rules to allow for regulated migration and the Mexican authorities assumed that private foreign investment (attracted mainly by low wages and very weak unions to deal with) would be enough to create sufficient jobs to stop migration.
Thus, the three main economic variables performance to check nafta's success or failure for Mexico, can be defined as: gdp growth, Employment growth and Exports growth. It is implied that economic policy of any kind should be evaluated by its objective results and we are testing one of various neoliberal reforms that took place in Mexico in the last 33 years: the foreign trade strategy.
The periods over which we are comparing these variables are three: one last period of state-led growth strategy 1970-1981, a period of the “‘Structural Adjustment Program” 1982-1993, and a period of full operation of nafta, 1994-2015.
The initial period 1970-81 was chosen because it was the one that covered the two political administrations of Mexico, right before the introduction of the neoliberal economic reforms. The government policies followed in these two administrations were blamed for the foreign exchange crisis that allowed the imf and the World Bank to impose on Mexico a Structural Adjustment Program (sap), which in fact started in 1982 causing a deep economic crisis that year. The period 1982-1993 was then considered the period in which many of the neoliberal economic reforms were applied in Mexico under the coverage of the sap. Finally, the period 1994-2015 is the one in which nafta has prevailed regarding trade and financial flows. This is the period we are focusing on mainly.
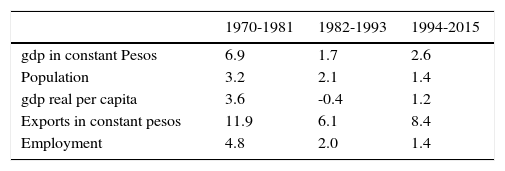
IOver view of the state-led growth and neoliberal policies in Mexico 1970-2015We see in Table 1, that the performance of the variables chosen, real Gross Domestic Product (total and per capita); real Exports and Employment was better in the state-led growth period than in the other two, in which the neoliberal reforms were in practice. The nafta period, though, has been better than the “‘full free trade” period, that is, the sap period. The reason for this is that as we shall see, the government realized that the neoliberal reforms were not given the expected results so they changed the trade strategy towards a preferential trade agreement with Mexico's main partner, the us, involving in this case a third party, Canada. However, at least in these three variables we are considering, the results after 21 years, are still below those achieved by the state-led growth strategy.
gdp, exports and employment. Average annual rates of growth
| 1970-1981 | 1982-1993 | 1994-2015 | |
|---|---|---|---|
| gdp in constant Pesos | 6.9 | 1.7 | 2.6 |
| Population | 3.2 | 2.1 | 1.4 |
| gdp real per capita | 3.6 | -0.4 | 1.2 |
| Exports in constant pesos | 11.9 | 6.1 | 8.4 |
| Employment | 4.8 | 2.0 | 1.4 |
Source: Instituto Nacional de Estadistica y Geografia (inegi).
The three variables, real gdp, real Exports and Employment were growing up to 1980 and then declined in 1981, with the outburst of the foreign exchange crisis that year, as shown in Figure 1. In fact, the Balance of trade started showing a growing deficit in the early seventies as shown in Figure 2, and could not be completely offset by the oil export's boom in the mid-seventies and the strong depreciation of the Mexican peso against the us dollar that occurred in 1976, after 22 years of a fixed exchange rate. A full study on this period and the State-led growth strategy can be found in Moreno-Brid and Ros (2009).
 Source: elaborated with data from Instituto Nacional de Estadística y Geografía (inegi).")
.")
It is undeniable that the state-led growth strategy yielded good results in terms of these three variables observed, but given the foreign exchange crisis, something had to be done to restore equilibrium and recover the growth path. By the early eighties, many experts in Mexico were calling for a liberalization reform “‘in favor of exports” (see Levy, 1982; Clavijo and Valdivieso, 1983).
However, this positive performance of the Mexican economy, shown by the results up to 1981, was not merely the outcome of a protectionist trade policy, but rather the combination of an industrial policy, a trade policy and a monetary policy, all three coordinated by the state for promoting growth.
The foreign exchange crisis turned into a foreign debt crisis in 1982, calling for the intervention of the international financial institutions, in the context of the economic liberalization policies promoted all over the world by the Reagan's us administration.
IIINeoliberal reforms and the Export-led growth strategy 1982-1993In the early eighties, years before the so-called “‘Washington Consensus” was widely known (Moreno-Brid, et al., 2004), a series of economic reforms were promoted by the World Bank and the International Monetary Fund, for highly-indebted Latin American countries as “‘structural adjustment programs” or “‘growth-oriented adjustment programs” (Sacks, 1987; Edwards, 1988). These programs promoted the following measures according to Sacks (1987, p. 2): 1) trade liberalization, especially the conversion of quantitative restrictions to low, uniform tariffs; 2) real exchange-rate depreciation and unification of the exchange rate; 3) an emphasis on the private sector as the source of growth, including the privatization of state enterprises; and 4) a general reduction in all forms of government intervention in markets (capital or factor), and in the overall level of government taxation and expenditure.
These reforms were applied under the assumption that deregulation constituted the structural change needed to correct a distorted economy and increase the level of employment and wages (Weller, 2000, p. 13). It was clear from the beginning that these policies were inspired by the so-called mainstream economics in which neoclassical thinking is predominant. In short, the programs aimed to promote free market in all markets, domestic and foreign, markets of goods and services, the labor market and the capital market, too. That is, a full “‘program” in clear opposition to the state-led growth strategy, not merely a liberalization of a previously protected economy as the Mexican was. The name given to this program in Mexico was “‘structural change program”.
These liberal policies, were based on the exports expansion as a new strategy for both, recovery and economic growth. The export-led growth strategies had been very successful in some Asian countries; however, they did not adopt all liberalization policies simultaneously as a strategy to promote exports. On the contrary, the East Asia experience shows that successful export-promoting policies have been accompanied regularly with import controls and rigid regulations on the movement of capital (Sachs, 1987, p. 3). And in South Korea and Taiwan, they were preceded by assorted industrial policies. The outward orientation of growth in these countries occurred as a consequence of an investment boom and not the other way around (Rodrik, 1995). Another experience closer to the Mexican case is that of Chile which started as a gradual process of trade liberalization in the mid-seventies, with some good results for exports but rather bad ones for employment (Cox and Edwards, 1997).
In Mexico, the idea was to induce growth by increasing exports, in particular manufacturing exports, without the help of state subsidies. One of the main reasons for abandoning protectionism was that it was producing a bias against exports (Lustig, 1992). This measure was considered conducive to structural change because liberalization of trade and capital flows would supposedly lead to accelerated industrialization. It was expected that the growing aggregate demand, produced by the increase of exports, would stimulate domestic production and hence employment too. Here structural change had a different meaning. It meant the change from an economy whose exports were mainly oil and other primary products to an economy based on manufacturing exports.
As shown in Figure 3, both the gdp and Employment experienced along this period very low rates of growth and even some negative ones. But the outstandingly bad performance was that of Exports, measured in constant pesos, which declined from its 1982 level to a negative rate in 1985 and then move towards convergence and stabilization with the two other variables after 1989, in a low rate of growth range level. This was called by the Mexican government the “‘lost decade”, in terms of growth. Also, the Balance of Trade showed a permanent declining tendency, which can be observed in Figure 4. After a few years with positive but declining balance, measured in dollars, it turned to a deficit in 1989 and it increased up to 1993.
 Source: Instituto Nacional de Estadística y Geografía (inegi).")
.")
In a previous work on the trade liberalization in México (Ruiz-Nápoles, 2001), it was estimated the effect of foreign competition in the manufacturing sector of the Mexican economy, using the formula:
where: di = displacement coefficient of industry I; mi = imports from industry I; oi = gross output of industry i, in the importing country, all in the same year.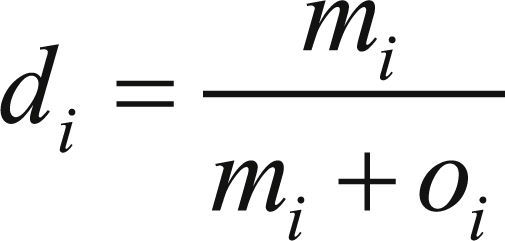
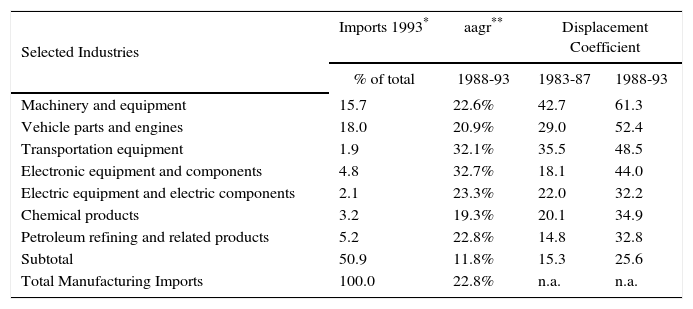
The idea was to estimate how much of the supply of a particular output of a given industry is made up by imports. The results of this estimation, only for the manufacturing sector in Mexico, during the period under analysis are shown in Table 2.
Manufacturing imports and displacement coefficient
| Selected Industries | Imports 1993* | aagr** | Displacement Coefficient | |
|---|---|---|---|---|
| % of total | 1988-93 | 1983-87 | 1988-93 | |
| Machinery and equipment | 15.7 | 22.6% | 42.7 | 61.3 |
| Vehicle parts and engines | 18.0 | 20.9% | 29.0 | 52.4 |
| Transportation equipment | 1.9 | 32.1% | 35.5 | 48.5 |
| Electronic equipment and components | 4.8 | 32.7% | 18.1 | 44.0 |
| Electric equipment and electric components | 2.1 | 23.3% | 22.0 | 32.2 |
| Chemical products | 3.2 | 19.3% | 20.1 | 34.9 |
| Petroleum refining and related products | 5.2 | 22.8% | 14.8 | 32.8 |
| Subtotal | 50.9 | 11.8% | 15.3 | 25.6 |
| Total Manufacturing Imports | 100.0 | 22.8% | n.a. | n.a. |
* Measured in millions of 1980 pesos **Annual Average Rate of Growth n.a. not available
Source: elaborated with data from inegi.
From Figure 4 we can infer that imports in Mexico were growing faster that exports after the start of the foreign trade liberalization. Now in Table 2 it is clear that, in manufacturing there are some industries (seven) whose imports were growing very fast and together they represented more than half of 1993 imports. These imports provided about one quarter of the total supply of goods produced in their respective industries. We divide the whole period 1982-1993 into two, to evaluate the displacement coefficient, due to the government administrations that worked out the trade liberalization program in different ways, in was in the last sub-period 1988-1993 when the liberalization increased including the opening of the capital account as a result of the reform of the laws and bylaws for foreign exchange in 1992 and the negotiation process of nafta.
Two of the group of imports by origin (Machinery and equipment, and Vehicles engines and parts) represented more than half of their respective supply in the period 1988-1993. In other words, under full free trade, the imported products of these industries displaced local producers as suppliers, with the corresponding negative effect on domestic production and employment. The rest of these imports were below 50 and above 30 percent of the total supply.
Here we are considering only manufacturing, since the intended purpose of the “‘structural change” was to move resources from primary activities in general to manufacturing. As we said, this was a particular meaning of structural change. But, should we analyzed what happened in this period in agriculture, we could find a very high displacement coefficient, especially in the early years of trade liberalization.
In short, during the full liberalization period there was no improvement, but worsening, of these basic economic indicators: gross domestic product, balance of trade and employment. In addition, there was a substantial displacement in major manufacturing industries of local producers by foreign ones, trough imports.
IVThe nafta period 1994-2015If we concentrate our analysis in the three main variables of Table 1, we can observe in Figure 5, that the performance of two of these three variables has been extremely bad in the light of was expected and promised by the various Mexican governments, since the signing of nafta. The rate of growth of gdp has been very low all along these 21 years and the rate of growth of employment has been always below that of gdp. The other variable, Exports in real terms, measured by its annual rate of growth, is clearly declining but it doesn’t mean that the level of exports was reducing, it only showed that it was impossible to sustain a high growth rate for real exports over a long period. We’ll see that in detail further on. For the moment, we can see that exports do not move at the same rate of growth that employment does.
.")
Since Keynes, the economy is conceived of, in a dynamic way, as being susceptible to stimulation by aggregate demand (Davidson, 1997). Aggregate demand can be divided into three components: consumption, investment and exports (government expenditures being included in consumption and investment). In a model with price stability plus fiscal and external equilibrium, a dynamic factor that does not create disequilibrium is foreign demand; that is, export demand (see Cornwall, 1977, ch.7; Davidson, 1997). The increase in exports has, by itself, a direct effect on the level of production and employment; it also expands the demand for intermediate goods and thereby causes an indirect increase in employment. On the other hand, the foreign exchange inflow generated by growing exports allows imports to increase by that same amount, without creating a deficit.
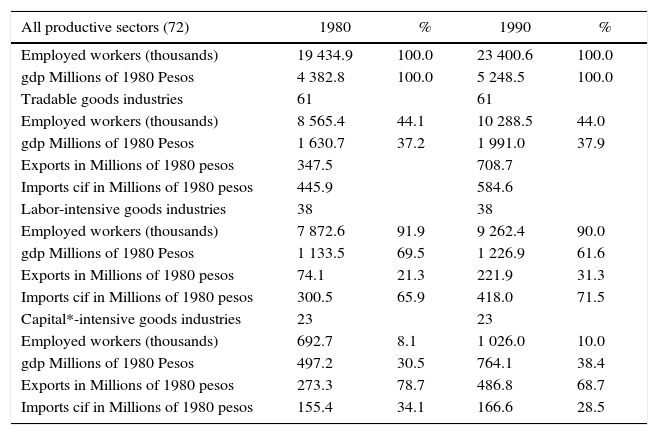
The resulting failure of such a strategy can be seen in the previous section referred to the period 1982-1993: there was no growth, either of gdp, or employment, nor a positive trade balance. But worst, the Heckscher-Ohlin theorem, the basic neoclassical argument for free trade was not working either: the Mexican economy was not specializing in the production and exporting of labor-intensive goods (being labor its abundant factor), but rather it was moving from a labor-intensive goods specialized economy to a capital-intensive goods one, as shown in Table 3.1
Labor and capital* intensive industries. Constant 1980 pesos
| All productive sectors (72) | 1980 | % | 1990 | % |
|---|---|---|---|---|
| Employed workers (thousands) | 19 434.9 | 100.0 | 23 400.6 | 100.0 |
| gdp Millions of 1980 Pesos | 4 382.8 | 100.0 | 5 248.5 | 100.0 |
| Tradable goods industries | 61 | 61 | ||
| Employed workers (thousands) | 8 565.4 | 44.1 | 10 288.5 | 44.0 |
| gdp Millions of 1980 Pesos | 1 630.7 | 37.2 | 1 991.0 | 37.9 |
| Exports in Millions of 1980 pesos | 347.5 | 708.7 | ||
| Imports cif in Millions of 1980 pesos | 445.9 | 584.6 | ||
| Labor-intensive goods industries | 38 | 38 | ||
| Employed workers (thousands) | 7 872.6 | 91.9 | 9 262.4 | 90.0 |
| gdp Millions of 1980 Pesos | 1 133.5 | 69.5 | 1 226.9 | 61.6 |
| Exports in Millions of 1980 pesos | 74.1 | 21.3 | 221.9 | 31.3 |
| Imports cif in Millions of 1980 pesos | 300.5 | 65.9 | 418.0 | 71.5 |
| Capital*-intensive goods industries | 23 | 23 | ||
| Employed workers (thousands) | 692.7 | 8.1 | 1 026.0 | 10.0 |
| gdp Millions of 1980 Pesos | 497.2 | 30.5 | 764.1 | 38.4 |
| Exports in Millions of 1980 pesos | 273.3 | 78.7 | 486.8 | 68.7 |
| Imports cif in Millions of 1980 pesos | 155.4 | 34.1 | 166.6 | 28.5 |
* Capital here is interpreted as circulating capital that is inputs.
Source: Elaborated with data from Sistema de Cuentas Nacionales, Instituto Nacional de Estadística y Geografía inegi, México.
The trade policy had been changed so that exporters could import low cost, high quality, intermediate goods (inputs) in order to use the relatively cheap local labor to produce manufacturing goods for export at a competitive level. However, such strategy was missing a crucial factor: investment. Since local investment was stagnated, it had to come from abroad. There was also the pressure coming from migrant workers displaced mostly from agriculture in the south part of the country, towards the northern border trying to cross it to the us, looking for jobs.
Therefore, the Mexican president at the time, Carlos Salinas, put forward an offer for the us to allowed Mexico to joining nafta: to open the Mexican border to us investments unconditionally, except for Oil and Electricity, both in the hands of the Mexican state. Preferential trade, which is nafta, was a better option for Mexico than free trade. To the Mexicans he promised “‘we are going to export goods not labor”.
2The Trade Balancenafta produced a big change in the direction of trade as illustrated in Figure 6. The Trade Balance of Mexico with nafta has been positive since the beginning, in 2015 was of around 122 billion dollars, while the Trade Balance with the rest of the World (row) has moved in the opposite direction and in 2015 showed a deficit of 147 billion, so the overall Trade Balance had a deficit of 25 billion dollars. It is important to note that this deficit is close to the figure of 1994. Most of the trade surplus of Mexico is with the us and most of the trade deficit is with China and Hong Kong. Exports represent more than 30% of aggregate demand and imports represent also more than 30% of aggregate supply.
.")
We can say, in sum, that nafta had been favorable for exporters of Mexican produced or assembled manufacturing goods, to the us, which are mostly foreigners, and among them, the us firms prevail.
But also, the foreign firms that export to Mexico have benefited in this period, and most of these firms while being in Asian countries, are us firms located in these countries. So, the us firms benefited both ways. The so-called “‘rules of origin” within nafta, never really applied.
3Employment and exportsEmployment and MigrationThe employment problem has been undoubtedly the most acute one for the Mexican economy for a long time. Migration flows to the us, due to the lack of jobs in Mexico had a very long tradition and during the nafta period, it did not stop. For some analysts, it was surprising that in the first five years of nafta when exports boomed, and gdp grew, migration flows to the us increased dramatically and these flows included then more qualified people, that is, with more schooling than before (Cornelius, 2002).
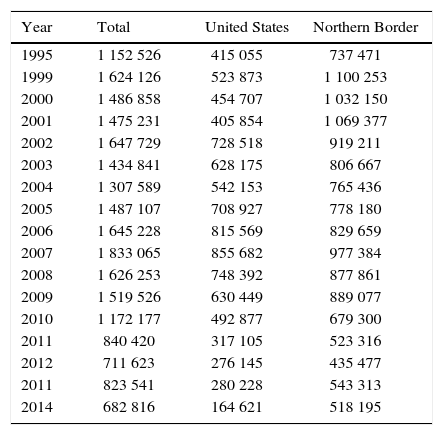
Table 4 shows the number of migrants from 1995 to 2014, that is, more or less the nafta period under analysis. The first column, shows the total of migrants from Mexican states located to the south of those states on the border. In the second column, are those migrants who actually crossed the border to the us, and the third column shows those who stayed on the cities close to the border, waiting for the opportunity to cross over to the us. This last group of people has created a problem in most border cities, since there are not enough facilities to support this growing amount of people, nor enough jobs to offer them, etc. The effect of anti-migrant policies applied during the us administration that ends this year, reduced substantially the number of people crossing the border, so in 2014 was only 164 thousand as compared to 855 thousand it was in 2007 (Li and Ordaz, 2014).
Mexican migrants from the south. Number of people including babies
| Year | Total | United States | Northern Border |
|---|---|---|---|
| 1995 | 1 152 526 | 415 055 | 737 471 |
| 1999 | 1 624 126 | 523 873 | 1 100 253 |
| 2000 | 1 486 858 | 454 707 | 1 032 150 |
| 2001 | 1 475 231 | 405 854 | 1 069 377 |
| 2002 | 1 647 729 | 728 518 | 919 211 |
| 2003 | 1 434 841 | 628 175 | 806 667 |
| 2004 | 1 307 589 | 542 153 | 765 436 |
| 2005 | 1 487 107 | 708 927 | 778 180 |
| 2006 | 1 645 228 | 815 569 | 829 659 |
| 2007 | 1 833 065 | 855 682 | 977 384 |
| 2008 | 1 626 253 | 748 392 | 877 861 |
| 2009 | 1 519 526 | 630 449 | 889 077 |
| 2010 | 1 172 177 | 492 877 | 679 300 |
| 2011 | 840 420 | 317 105 | 523 316 |
| 2012 | 711 623 | 276 145 | 435 477 |
| 2011 | 823 541 | 280 228 | 543 313 |
| 2014 | 682 816 | 164 621 | 518 195 |
Source: Colegio de la Frontera Norte-emif (2014).
The economically active population (eap) in Mexico in 1995 was estimated by official sources in 35.6 million people, in 2015 was of 52.9 million (migrants excluded). It implies an average growth rate of roughly 2 percent a year. This means that every year, from 1995 on, there are more than 700 thousand people looking for jobs, and this figure has been growing; in 2015 it was above one million. To keep up with this increase of the eap, both the private and the public sectors of the economy should have created that number of jobs in Mexico, and that has not happened. So, we have an excess supply of labor that, apart from migration flows to the us, already accounted for, goes to the so called informal labor, which these days represent about 60 percent of total labor and its activities produce an estimate of 25 per cent of total gdp. Still, that is not enough, so there has been a widespread of poverty2 which, of course, was not nafta the cause of, but the lack of well paid jobs.
Production and Employment generated by ExportsIn a previous study of trade opening and nafta in Mexico (Ruiz-Nápoles, 2004) we calculated by means of Input-Output analysis the impact of Exports on Employment both directly and indirectly in the period 1978-2000.
The results show in Figure 7 first the line of total employment measured in the left vertical axis in millions of workers, going from 17.6 million in 1978, to 30.6 million in 2000. It was an increase of 74 per cent in 12 years. Now, on the right vertical axis the shares of labor related to exports are measured in percentages. Labor generated directly or indirectly by exports goes from 4.6 to 11.2 percent of the total paid labor in the economy, from 1978 to 2000, that is, an increment of 325 percent in these 12 years. Finally, the lower line shows the share of the labor engaged directly on export activities, going from 2.7 to 5.9 percent of total labor in the same period. It meant an increment of 382 percent in the period 1978-2000.
.")
Employment, total and generated by exports Number of workers and relative shares
Source: Ruiz-Nápoles (2004).
The figures resulting from the I-O analysis indicated that, in fact, there was a significant increase of employment directly involved in exporting activities and also an important impact on the employment of other activities related to exports. There are two other important aspects of this development from the data that could not be overlooked. First, is the relative low importance that all exports related activities have, on the level of employment, 11.2 percent in 2000, a figure that only increases to around 15 percent, once we add up the amount of labor engaged in the so-called maquiladora industry. The other and more interesting aspect is that it was in 1995 when labor directly associated to exports really increased to a level of 10%, at the same time that total labor decreases due to the deep economic crisis there was in the whole economy; this is very clear in Figure 7. That means two things: one is that exports and related activities were somehow disconnected to the rest of the economy and second is that once the economy recovers, all variables followed more or less the same path. Since we don’t have any most recent I-O analysis at hand, we don’t know the behavior of these variables up to date. But it is conceivable that while some employment was gained in exports activities, some other employment was lost in local industries displaced by imports. So it was not a win-win game buy one in which one wins what the other loses.
ConclusionsWe have showed in the various graphs and tables, with data from official sources, that the Export-led growth strategy followed by the Mexican government, from 1983 to the present has failed in two of the selected indicators: gdp and Employment growth. nafta was one of the same reforms carried out by the Mexican government, widening up those neoliberal reforms by opening up the capital account of the Balance of Payments and accepting that there were no migration flows rules under nafta. In short, free movement of one factor of production, capital, no movement of the other, labor.
The additional source of growth which was foreign direct investment (fdi) since 1994, did not stimulate growth either. fdi as maintained a high level of foreign exchange inflow to Mexico, as Exports have done. Still, there has been not substantial, nor sustained, gdp growth in the nafta period.
With respect to gdp, we have seen that the Exports’ boom in the first years of nafta (see Figure 5) did not match a corresponding growth of gdp; and the following years while exports kept growing at a lower rate in real terms, gdp followed a stagnant tendency as well as employment.
The reason for this failure is not a simple one: there was a big transformation of the Mexican economy, not only there were not industrial, trade and monetary policies for growth, but the very institutions and organizations that made possible those policies for the State-led growth strategy, were either sold to the private sector, closed, or changed in their purpose, like the banking for development system. A famous Mexican Secretary of Commerce in 1992 is said to have declared that “‘the best policy is the non-existent one”, paraphrasing –maybe unconsciously– the us Civil War General Sheridan in the nineteenth century, saying: “‘The only good Indian is a dead Indian”.3
In this table we are not using capital as fixed capital for the lack of information at the time, we are considering inputs as circulating capital, as in Marx (1893).
The population living in poverty in Mexico was estimated in 46% of the total, that is, 52 million people (Coneval, 2015).
Philip Henry Sheridan (1831-1888) was a career United States Army officer and a Union general in the American Civil War. Sheridan fought in later years in the Indian Wars of the Great Plains.