


To perform a nationwide multicentric validatation of the nomogram of fetal middle cerebral artery peak systolic velocity (MCA-PSV); previously constructed by us and to compare and contrast it with similar studies in the world for an effective output.
Materials and methodsFetal MCA-PSV was measured in normal 1015 pregnant women attending the antenatal ultrasound clinic at least once between 12 and 40 weeks of gestation (35 patients per week of gestation), at this institute and a nomogram was constructed. MCA-PSV in 30 patients each at 12, 24 and 36 weeks of gestation (GA) were measured at multiple centers [other institutes by different observers] in this nation. Their mean values were compared with the mean values mentioned in the nomogram prepared by us. Similarly the linear correlation diagrams as well as the regression equations of this large local study were compared with those from other worldwide published studies. Statistical analysis was done using the SPSS 12 software.
ResultsA nationwide comparison of the mean and standard deviation (SD) values of MCA-PSV at 12, 24 and 36 weeks of gestation calculated at 95% confidence interval, in our study with studies from different other centers, using ANOVA the calculated F value was far too high than the table value. So, null hypothesis that the nomogram previously prepared by us at this center can be comfortably followed at other centers in this nation is rejected. Comparative analysis of linear correlation between GA (weeks) and MCA-PSV (cm/s) in our study and other studies also displayed a disparity.
ConclusionsA significant difference was found between local study and multicentric nation wide studies, as well as between local values and worldwide values. A multicentric nationwide input for a worldwide output thus enabled us not only to construct and compare normal local reference range of fetal MCA-PSV but also to validate it effectively and to realize its limitations. Hence it is time to say goodbye to the “One Size Fits All Theory” of fetal MCA-PSV and to welcome efforts to scientifically construct regional reference range all over the world.
Realizar una validación nacional multicéntrica del nomograma de la velocidad sistólica máxima de la arteria cerebral media (MCA-PSV) que había sido previamente construida por los autores a fin de comparar y contrastar con estudios similares en el mundo para obtener unas conclusiones o resultados eficaces.
Materiales y métodosEntre las 12 y 40 semanas de gestación, se midió una vez, como mínimo, la MCA-PSV fetal en 1.015 mujeres embarazadas normales (35 pacientes por semana de gestación) que fueron atendidas en la clínica de ecografía prenatal de este instituto y elaboró un nomograma. Se seleccionaron 30 pacientes por cada edad de gestación (12, 24 y 36 semanas de gestación) en varios centros [otros institutos y con diferentes observadores] en esta nación. Los valores medios se compararon con los valores medios obtenidos en el nomograma elaborado por los autores. Asimismo, se compararon los diagramas de correlación lineales y las ecuaciones de regresión de este amplio estudio local con los de otros estudios publicados en el resto del mundo. El análisis estadístico se realizó mediante el software SPSS 12.
ResultadosLa comparación a nivel nacional de la media y la desviación estándar (DE) de la MCA-PSV a los 12, 24 y 36 semanas de gestación, calculadas con un intervalo de confianza del 95%, entre nuestro estudio y otros estudios de diferentes centros de India, dio lugar a un valor F calculado mediante ANOVA mucho más alto que el valor de la tabla. Por lo tanto, se rechaza la hipótesis nula de que el nomograma previamente preparado por nosotros en este centro se pueda seguir cómodamente en otros centros de este país. El análisis comparativo de la correlación lineal entre la EG (en semanas) y la MCA-PSV (cm/seg.) en nuestro estudio y otros estudios también muestran disparidades.
ConclusionesSe encontró una diferencia significativa entre el estudio local y los otros estudios multicéntricos nacionales, así como entre los valores locales y los valores mundiales. Se trata de resultados de datos multicéntricos a nivel nacional para establecer valores mundiales, lo que nos permitió no sólo construir y comparar los valores de referencia locales de la MCA-PSV fetal normal, sino también validar de manera efectiva y conocer sus limitaciones. Por lo tanto, es el momento de decir adiós a la teoría de “una misma talla para todos” en cuanto a MCA-PSV fetal y dar la bienvenida a los esfuerzos por construir científicamente un rango de referencia regional en todo el mundo.
Earlier methods to diagnose fetal anemia by invasive techniques like estimation of bilirubin in the liquor obtained by amniocentesis1 or estimation of hemoglobin in blood obtained by cordocentesis,2 have now been replaced with the non-invasive color Doppler technique in which an abnormal rise in fetal Middle Cerebral Artery Peak Systolic Velocities (MCA-PSV) indicates fetal anemia.3,4 As this method has stood true on almost all occasions; it has become time tested and is now widely practised because the technique is quick, simple, reliable, repeatable, bedside performable and without much inter or intra observer variability. Moreover, it is entirely harmless to the fetus.
In such a scenario, the only chance of harm arises when there is incorrect standardization of what is referred to as ‘normal’. Therefore, the normal reference range has to be carefully and scientifically determined for each week of gestation age (GA) for obstetric population of each ethnicity and each geographic locality all over the world, so that only the ‘likes’ are compared with the ‘likes’ and not with ‘all alike’. Moreover, as fetal MCA-PSV is a population based parameter, loco-regional differences are bound to exist. Hence scientifically correct and statistically sound standardization is the key, as invasive procedures such as cordocentesis and subsequent fetal blood transfusion is undertaken relying heavily upon the result of this non-invasive fetal hemoglobin estimation.
With worldwide acceptance of the fact that fetal anemia can be non-invasively diagnosed by elevated fetal middle cerebral artery peak systolic velocity (MCA-PSV) as seen on color Doppler, it is essential to compare and contrast national reference values with the values published in international textbooks; and only then to accept and follow the nomograms which are most accurate for the community to which they cater.5–7
This quest should not stop at scientifically constructing the normal reference range for MCA-PSV in one single locality in a nation, but should equally concentrate on validating and consolidating this research by multicentric studies. A sufficiently large local study whose results are not significantly different than multicentric studies, would then qualify to be called a nationwide study. Such studies alone should be compared with different studies all over the world, so that all citizens irrespective of their ethnicity are benefitted in this cosmopolitan world that exists today.
This original research is therefore built around the central premise of first constructing a large local reference range and then validating it with multicentric nationwide input for an effective worldwide output for the accurate non-invasive diagnosis of fetal anemia.
Materials and methodsAppropriate permission from the institutional ethical and research committee, and informed written consent from the participating pregnant ladies were obtained for this research work which was carried out in the years 2010 to 2012.
A total of 1015 normal pregnant women with normal singleton pregnancy were randomly chosen for this study such that 35 individuals each for gestational age 12–40 formed 29 clusters. Maternal as well as fetal normalcy was the inclusion criteria category, while fetuses with anatomical abnormalities or maternal systemic diseases such as diabetes, hypertension and renal problems formed the exclusion criteria category. Standardized technique of measuring fetal MCA-PSV, technique of sampling and criteria of normalcy were followed as mentioned in prior published studies.5–7
The statistical details were accumulated and analyzed using the statistical analysis software SPSS version 12, Chicago, USA. The mean and standard deviation (SD) values of fetal MCA-PCV at various gestational ages were determined and a normal local nomogram was constructed.
For validating this local nomogram, values from 8 different distant places done by different researchers from this nation were requested. This multicentric contribution consisted of 30 MCA-PSV observations of normal fetuses at 12, 24 and 36 weeks of gestation each. Comparison of mean and standard deviation (SD) values of MCA-PCV at 12, 24 and 36 weeks of gestation calculated at 95% confidence in the local study and values obtained from these multicentric studies was done to evaluate whether the local constructed range was applicable to this centers from this nation as well.
Next step was to perform a comparison of the linear correlation between GA and MCA-PSV of the local study with linear correlation constructed from observations in other international studies. Finally a comparison of regression equations of international studies with local study was done.
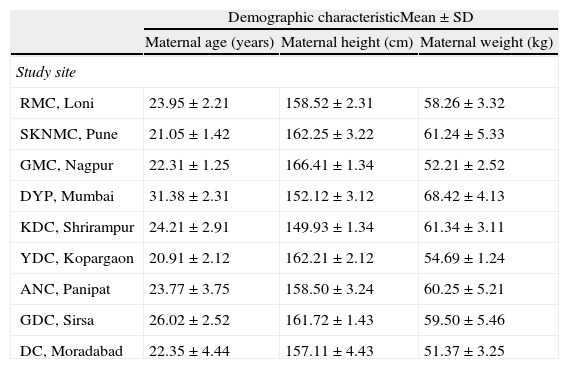
ResultsThe demographic information on the study population is shown in Table 1. The basic larger primary study was carried out on population living in plateau region. So were the other smaller studies. It must however be remembered that the country from which the study originates has majority of the region as plateau that has almost the same ethnicity or race, with differences in dietary habits and religion followed. This is basically a mix or hybrid of pure Aryan race and pure Dravidian race. However there are some hilly regions and tribal belts which have somewhat different ethnicity or race as can be seen from their external morphology. Measurements in these could not be included for the want of data from these regions.
Demographic characteristics of study population.
| Demographic characteristicMean±SD | |||
| Maternal age (years) | Maternal height (cm) | Maternal weight (kg) | |
| Study site | |||
| RMC, Loni | 23.95±2.21 | 158.52±2.31 | 58.26±3.32 |
| SKNMC, Pune | 21.05±1.42 | 162.25±3.22 | 61.24±5.33 |
| GMC, Nagpur | 22.31±1.25 | 166.41±1.34 | 52.21±2.52 |
| DYP, Mumbai | 31.38±2.31 | 152.12±3.12 | 68.42±4.13 |
| KDC, Shrirampur | 24.21±2.91 | 149.93±1.34 | 61.34±3.11 |
| YDC, Kopargaon | 20.91±2.12 | 162.21±2.12 | 54.69±1.24 |
| ANC, Panipat | 23.77±3.75 | 158.50±3.24 | 60.25±5.21 |
| GDC, Sirsa | 26.02±2.52 | 161.72±1.43 | 59.50±5.46 |
| DC, Moradabad | 22.35±4.44 | 157.11±4.43 | 51.37±3.25 |
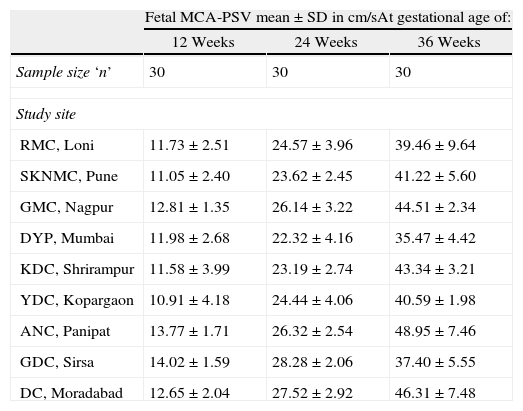
Comparison of national multicentric mean and standard deviation (SD) values of MCA-PCV at 12, 24 and 36 weeks of gestation calculated at 95% confidence interval is shown in Table 2.
Comparison of nationwide multicentric mean and standard deviation (SD) values of MCA-PCV at 12, 24 and 36 weeks of gestation calculated at 95% confidence interval.
| Fetal MCA-PSV mean±SD in cm/sAt gestational age of: | |||
| 12 Weeks | 24 Weeks | 36 Weeks | |
| Sample size ‘n’ | 30 | 30 | 30 |
| Study site | |||
| RMC, Loni | 11.73±2.51 | 24.57±3.96 | 39.46±9.64 |
| SKNMC, Pune | 11.05±2.40 | 23.62±2.45 | 41.22±5.60 |
| GMC, Nagpur | 12.81±1.35 | 26.14±3.22 | 44.51±2.34 |
| DYP, Mumbai | 11.98±2.68 | 22.32±4.16 | 35.47±4.42 |
| KDC, Shrirampur | 11.58±3.99 | 23.19±2.74 | 43.34±3.21 |
| YDC, Kopargaon | 10.91±4.18 | 24.44±4.06 | 40.59±1.98 |
| ANC, Panipat | 13.77±1.71 | 26.32±2.54 | 48.95±7.46 |
| GDC, Sirsa | 14.02±1.59 | 28.28±2.06 | 37.40±5.55 |
| DC, Moradabad | 12.65±2.04 | 27.52±2.92 | 46.31±7.48 |
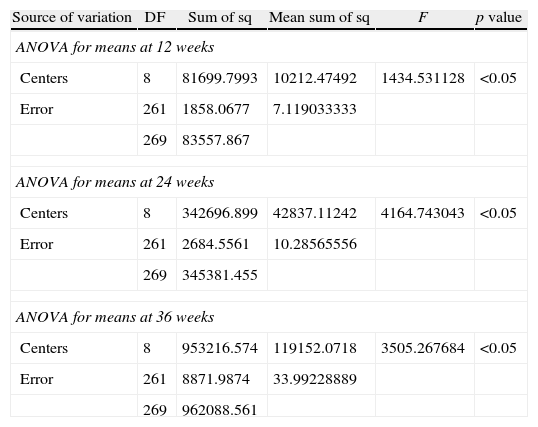
Analysis of variance test (ANOVA) was used for comparative analysis. Using ANOVA the calculated F value was far too high than the table value as shown in Table 3. So, null hypothesis that the nomogram previously prepared by us at this center can be comfortably followed at other centers in this nation is rejected. The p value was less than 0.05 (p<0.05) for each F value in this study.
Table showing results of ANOVA when applied to nationwide multicentric studies at 12, 24 and 36 weeks of gestation.
| Source of variation | DF | Sum of sq | Mean sum of sq | F | p value |
| ANOVA for means at 12 weeks | |||||
| Centers | 8 | 81699.7993 | 10212.47492 | 1434.531128 | <0.05 |
| Error | 261 | 1858.0677 | 7.119033333 | ||
| 269 | 83557.867 | ||||
| ANOVA for means at 24 weeks | |||||
| Centers | 8 | 342696.899 | 42837.11242 | 4164.743043 | <0.05 |
| Error | 261 | 2684.5561 | 10.28565556 | ||
| 269 | 345381.455 | ||||
| ANOVA for means at 36 weeks | |||||
| Centers | 8 | 953216.574 | 119152.0718 | 3505.267684 | <0.05 |
| Error | 261 | 8871.9874 | 33.99228889 | ||
| 269 | 962088.561 | ||||
On charting fetal MCA-PSV against gestational age in weeks, the correlation diagram was obtained for local study and for other studies. This comparison is expressed in Figs. 1 and 2. Although studies from other part of the world lacked certain data, we have showed all gestational weeks after calculating this data by interpolation. A graphical diagram showing relationship between GA and MCA-PSV was constructed for this purpose. The weeks in between were filled in and the MCA-PSV values were linearly drawn on this graph as there is a positive linear correlation between GA and MCA-PSV. From this comparative Figs. 1 and 2, it is clear that the local median value is consistently less than the studies reported from different parts of the world.
![Comparative analysis of linear correlation between gestational age (weeks) and MCA-PSV (cm/s) in our study and other studies including pregnancy upto mid-second trimesters alone [Tong – ref. no: 21, Jittima – ref. no: 20, KG – present study].](https://static.elsevier.es/multimedia/21734127/0000002400000004/v1_201311281157/S2173412713000383/v1_201311281157/en/main.assets/gr1.jpeg?xkr=ue/ImdikoIMrsJoerZ+w997EogCnBdOOD93cPFbanNcA402j4q1QsKtJT4INrVNsxVjm8m8rXahhwiXbAeJQS/q1igBhInCR7LnwCiIl9AEav7Zw3fGi+V8uRuMYX/pG0HATvQ/xq3iX/Mt46rRbTIIFkg/YtLMIrJDsWYov+BLWpx9ZqsU3AkT5zIL/gJfiDVaMYK5qdGszpBQbcDNVaEejYtOLh/F4jPIYzKhxR+2dGEV2NXVoHYFHsLM/b+0CH1sE4LAdejPH/DG9swNWDDndyLHx8zxw8HLm3HXg/c8= "Comparative analysis of linear correlation between gestational age (weeks) and MCA-PSV (cm/s) in our study and other studies including pregnancy upto mid-second trimesters alone [Tong – ref. no: 21, Jittima – ref. no: 20, KG – present study].")
![Comparative analysis of linear correlation between gestational age (weeks) and MCA-PSV (cm/s.) in our study and other studies including pregnancy upto third trimester [KG – present study, Alshmiri – ref no: 18, Klaristch – ref. no: 23, Ebbing – ref. no: 19, Tan – ref. no: 5, Teixeira – ref. no: 15, Zimmer – Ref. no: 17, Kurmana – ref. no: 16].](https://static.elsevier.es/multimedia/21734127/0000002400000004/v1_201311281157/S2173412713000383/v1_201311281157/en/main.assets/gr2.jpeg?xkr=ue/ImdikoIMrsJoerZ+w997EogCnBdOOD93cPFbanNcA402j4q1QsKtJT4INrVNsxVjm8m8rXahhwiXbAeJQS/q1igBhInCR7LnwCiIl9AEav7Zw3fGi+V8uRuMYX/pG0HATvQ/xq3iX/Mt46rRbTIIFkg/YtLMIrJDsWYov+BLWpx9ZqsU3AkT5zIL/gJfiDVaMYK5qdGszpBQbcDNVaEejYtOLh/F4jPIYzKhxR+2dGEV2NXVoHYFHsLM/b+0CH1sE4LAdejPH/DG9swNWDDndyLHx8zxw8HLm3HXg/c8= "Comparative analysis of linear correlation between gestational age (weeks) and MCA-PSV (cm/s.) in our study and other studies including pregnancy upto third trimester [KG – present study, Alshmiri – ref no: 18, Klaristch – ref. no: 23, Ebbing – ref. no: 19, Tan – ref. no: 5, Teixeira – ref. no: 15, Zimmer – Ref. no: 17, Kurmana – ref. no: 16].")
Comparative analysis of linear correlation between gestational age (weeks) and MCA-PSV (cm/s.) in our study and other studies including pregnancy upto third trimester [KG – present study, Alshmiri – ref no: 18, Klaristch – ref. no: 23, Ebbing – ref. no: 19, Tan – ref. no: 5, Teixeira – ref. no: 15, Zimmer – Ref. no: 17, Kurmana – ref. no: 16].
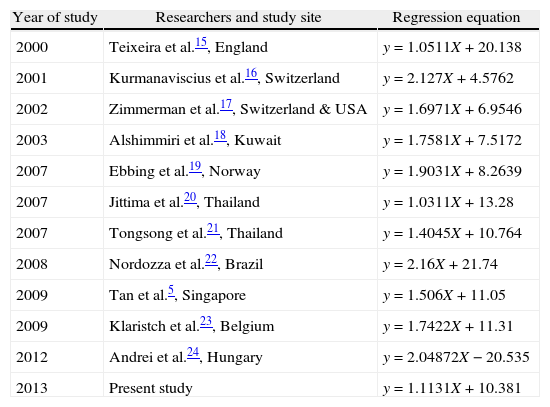
Similarly we constructed regression equations for our study as well as studies from other part of the world by using their published data and interpolating it with the regression curve computation software available in SPSS, and these equations are shown in Table 4, which again drives home the concept that no two equations are the same. Further statistical comparison between them requires Mean/Median and Standard deviation values of each GA in each study. Unfortunately as most of these studies do not give these values, we had to be content with the graphical comparison as shown in Figs. 1 and 2.
Comparison of regression equations of local nationwide as well as international worldwide studies.
| Year of study | Researchers and study site | Regression equation |
| 2000 | Teixeira et al.15, England | y=1.0511X+20.138 |
| 2001 | Kurmanaviscius et al.16, Switzerland | y=2.127X+4.5762 |
| 2002 | Zimmerman et al.17, Switzerland & USA | y=1.6971X+6.9546 |
| 2003 | Alshimmiri et al.18, Kuwait | y=1.7581X+7.5172 |
| 2007 | Ebbing et al.19, Norway | y=1.9031X+8.2639 |
| 2007 | Jittima et al.20, Thailand | y=1.0311X+13.28 |
| 2007 | Tongsong et al.21, Thailand | y=1.4045X+10.764 |
| 2008 | Nordozza et al.22, Brazil | y=2.16X+21.74 |
| 2009 | Tan et al.5, Singapore | y=1.506X+11.05 |
| 2009 | Klaristch et al.23, Belgium | y=1.7422X+11.31 |
| 2012 | Andrei et al.24, Hungary | y=2.04872X−20.535 |
| 2013 | Present study | y=1.1131X+10.381 |
Mankind's quest for a noninvasive method to determine fetal anemia, resulted in the finding that elevated fetal MCA PSV as measured on color Doppler was an acceptable methods than measuring spleenic perimeter, hepatic span or maximum velocity in intrahepatic umbilical vein,8,9 as it was found to be more sensitive and specific. Normal MCA PSV values have now made the invasive diagnostic tests redundant.10 Recognition of the fact that fetal cerebral circulatory changes are a better predictor of fetal plight rather than umbilical arterial changes11 gave a further boost toward wide scale usage of fetal MCA-PSV. The anemic fetal blood which has reduced hemoglobin and hematocrit has decreased viscosity and hence higher velocity.3,12 Moreover, the drive to provide sufficient oxygen to brain and vital body parts even in presence of anemia raises the stroke volume and the cardiac output which further pushes up the MCA PSV values.
Like in other studies across the world, this local study too concluded that the MCA-PSV increased with increased GA.13–23 This is indicated by the straight lines in linear correlation diagrams (Figs. 1 and 2). Global comparison shows that the local values are consistently less at all weeks of GA as is seen by the position of the local line (indicated by KG) at the bottom in both the figures. However the limits used to suspect fetal anemia would be the same as previously proposed by Mari et al.3.
Similarly when regression equations of other studies in the world were compared with that in the present study (Table 4), it is clear that no two equations are the same. Efforts to evaluate statistically significant difference between them required Mean/Median and Standard deviation values of each GA in each study. Unfortunately as most of these studies do not give these values, we had to be content with the graphical comparison as shown in Figs. 1 and 2.
Environmental geography and genetic diversity can explain the cause of these differences.
References range being a population based parameter is bound to vary with population dynamics such as age, sex, race, diet, use of prescribed or herbal drugs and stress. In the present study as well as in all the compared studies possible determinants such as age, height, diet, socio-economic status etc. are not accounted for. Hence it is of paramount importance to frame a reference range from a sample that will suit the population to which it caters best.6,7 Therefore, all evidence points against “One-Size Fits All” theory of fetal MCA PSV which is based upon the belief that variations in MCA-PSV range are not possible across the globe.
Experience has taught us that as the GA advances, the range of SD also increases.7 Hence in the later weeks of gestation, the cut off values of MCA PSV too have a larger range. As this period is crucial for making vital decisions in cases of fetal anemia either to intervene or not or to just wait and watch. Hence, there is a strong need for construction of scientifically sound and statistically correct local reference range and to validate it by multicentric regional studies by different researchers.
The strengths of the present study are its adequate sample size, simple random sampling, national multicentric validation and worldwide comparison, by performing the internationally standardized protocols followed by other researchers across the globe. This study proved that the “One-Size Fits All” theory of fetal MCA PSV needs a new look and a new vision.
Numerous worldwide studies5,6,7,22 have attempted to construct local reference ranges for fetal MCA-PSV per week of gestation. As new research on this topic continues,24–26 the evidence points away from the “One-Size Fits All” theory. The present study has undertaken a multicentric nationwide input for a worldwide output addressed the drawbacks of other studies. But the limits used to suspect fetal anemia is the same as previously proposed by Mari et al.3.
A limitation of our study is that the multicentric contribution was in the form of fetal MCA PSV measurements for GA at 12, 24 and 36 weeks only and not for all weeks from 12 to 40 as is desirable. This exhaustive task was out of the limits of this study. Hence, there is scope for health sector policy makers to get such data compiled of different regions in the nation. Although limitation is that we can only speculate and not strongly state what will happen when fetus is the fruit of parents of different ethnicity. Focused studies on these lines too are warranted for drawing fruitful conclusions.
Worldwide, nations have become cosmopolitan in terms of ethnicity of the citizens. Changing trends in trade and information technology have made the modern population migratory. Hence, a pregnant lady of any ethnic origin may present to any obstetrician. On such occasions if this doctor is not aware of the inherent loco-regional differences in fetal MCA PSV values, the health of the affected fetus is likely to be jeopardized. Hence it is time we reject the “One-Size Fits All” theory and undertake efforts to scientifically construct regional reference range all over the world. It may appear out of context, but in many matters like this we have to accept the fact that the world is livable because of the lack of similarity. It is in being different that we evolve and when similar we dissolve.
Ethical disclosuresProtection of human and animal subjects. The authors declare that no experiments were performed on humans or animals for this investigation.
Confidentiality of Data. The authors declare that they have followed the protocols of their work centre on the publication of patient data and that all the patients included in the study have received sufficient information and have given their informed consent in writing to participate in that study.
Right to privacy and informed consent. The authors declare that no patient data appears in this article.
Conflict of interestThe author has no conflict of interest to declare.
To Dr. A.P. Kulkarni, MBBS, MD, PhD; Director of Research at Pravara Institute of Medical Sciences(Deemed University), Loni, Maharashtra, India-413736 for excellent statistical work.
To all the pregnant ladies and contributors to this study, without whom this study would not have seen the light of this day.