


The stock analysts have a relevant role in the capital market, since, directly or indirectly, they contribute to the paper pricing and to the composition of the investment portfolio. The purpose of this study is to verify if it is possible to obtain extraordinary returns, above those offered by a market portfolio, with the monitoring of the stock recommendations issued by Brazilian capital market analysts, one of the most important in Latin America. Based on a wide range of consensual recommendations concerning the period from 2000 to 2010, and with the monitoring of the historical series of paper returns covered by the analyses, the performance of two portfolios were compared, one formed by stocks that received favorable and the other one formed by stocks that received unfavorable analyst recommendations. The results showed bias in recommendations, since there is, systematically, a greater number of favorable against unfavorable recommendations. The results mainly showed that the analysts were unable to identify the stocks that actually offered greater returns within the period considered.
Los analistas de acciones desempeñan un papel importante en los mercados de capitales, de modo que, directa o indirectamente, contribuyen a la fijación de precios de las acciones y a la composición de portafolios. El propósito de este estudio fue verificar si es posible obtener rendimientos extraordinarios, por encima de los ofrecidos por una cartera de mercado, con el acompañamiento de las recomendaciones de acciones realizadas por los analistas en el mercado de capitales brasileño. Basado en una gama de recomendaciones de consenso para el período comprendido entre los años 2000 y 2010, más el seguimiento de series de tiempo de los rendimientos de los títulos que abarca el análisis, fueron comparados la actuación de dos carteras, una formada por acciones que recibieron recomendaciones favorables y otra formada por las acciones que recibieron recomendaciones desfavorables de los analistas. Los resultados mostraron la existencia de la parcialidad en las recomendaciones, ya que hay, sistemáticamente, un mayor número de recomendaciones favorables en comparación con las recomendaciones desfavorables. Y se mostraron, principalmente, que los analistas no fueron capaces de identificar las acciones que ofrecieron una mayor rentabilidad en el período estudiado.
The opinions of capital market analysts were object of study of several researches, such as Bjerring, Lakonishok, and Vermaelen (1983), Elton, Gruber, and Grossman (1986), Womack (1996), Lin and McNichols (1998), Barber, Lehavy, McNichols, and Trueman (2001), Jegadeesh, Kim, Krische, and Lee (2004), Lim and Kong (2004), Chan, Brown, and Ho (2006), Moshirian, Ng, and Wu (2009), Hall and Tacon (2010), Sidhu and Tan (2011) and Hobbs and Singh (2015). Some used the recommendations, target prices, and profit previews per stocks to identify the impact of those predictions and recommendations in the stock prices, while others verified the analysts’ ability to select overestimated and underestimated stocks, through share investment recommendations.
The objective of this study is to test the effectiveness of the analysts’ stock recommendations made in the period of eleven years from 2000 to 2010.
The capital market analysts have, according to Loh and Mian (2006), an important role as middlemen in the financial market. They are responsible for analyzing and following companies’ performances, so that they can recommend investments to other participants of the market. The reports they issue take into account sector and economy analyses. Moreover, the analysts indicate target prices for the stocks, which is a widely disseminated reference in capital markets.
Jegadeesh et al. (2004) state that market researchers and participants are naturally interested in understanding how the activities of the analysts affect the efficiency of the capital market. According to Stickel (1995), the brokerage firms’ buy and sell recommendations are of interest to individual investors, investment fund managers, brokers and academic researchers. Chan et al. (2006) also highlighted the significant expenditures deployed by the brokerage firms aiming at empowering their analysts so that they produce investment recommendations.
Several studies, such as Dimson and Marsh (1984), Brav and Lehavy (2003) and Moshirian et al. (2009), detected evidences that the analyst-made recommendations are able to affect the behavior of the stock prices. Other studies, such as Bjerring et al. (1983), Elton et al. (1986), Lim and Kong (2004), Chan et al. (2006), and Moshirian et al. (2009) revealed that the investors who followed the analysts’ recommendations obtained significant and positive abnormal returns in the markets and samplings studied.
Due to results indicated by studies developed in worldwide markets since the 1980s, the motivating question of this study is the following: is it possible for an investor to obtain positive abnormal returns by following the Brazilian capital market analysts’ stock recommendations?
In response to the question posed earlier, the results showed bias in recommendations, since there is, systematically, a greater number of favorable against unfavorable recommendations. The results mainly showed that the analysts were unable to identify the stocks that actually offered greater returns within the period considered.
The study is organized in five parts: the first comprises this introduction; the second presents a literature review; the third presents the methodological aspects; the fourth presents the results obtained; and the fifth establishes the conclusions and final considerations.
Literature reviewIvković and Jegadeesh (2004) highlighted that the analysts perform the important role of collecting and processing information about the firms and disseminating them to the individual investors and institutions. The analysts are also responsible for producing firm profit forecasts, elaborating single companies’ reports and doing sector and industrial analyses, besides issuing stock recommendations. Hall and Tacon (2010) state investment analysts contribute to promoting the market efficiency by reducing the information asymmetry existent among the investors. Additionally, they provide three critical observations: profit forecasts, stock recommendations, and target prices. Naturally, it is the analysts’ role to help investors identify profitable investment opportunities.
Francis and Soffer (1997) and Salva and Sonney (2011) find the analysts’ stock recommendations form the final result of researches on companies and their markets, and reflect an expert and global opinion on the stock value in relation to its market price. Likewise, they can affect the behavior of the paper prices. Lim and Kong (2004), for example, revealed that the impact on the stock prices, after the issuance of negative reviews of profit forecasts, is consistently stronger than for positive reviews. The study was made on the stock markets of Australia, Hong Kong, Korea, and Singapore. Moreover, it showed that the positive reviews (of profit forecasts) seem to affect emerging and developed markets differently. Such effect was not detected in negative reviews.
Aiming at enhancing the result of the investment analysts’ work, especially those who work on stock markets, the studies of Brown and Rozeff (1978), Brown, Hagerman, Griffin, and Zmijewski (1987), Brown, Hagerman, Griffin, and Zmijewski (1987) and Chen (2010) affirmed that the profit forecasts issued by the analysts are widely used as market expectation proxies on future profits, because they are more precise and associate strongly with the additional returns attained on the disclosure of the results, when compared to profit time series models. However, there are studies that refuse to accept this statement, with no reservations. Guerard and Beidleman (1986), for instance, analyzed 35 North American companies from 1981 to 1982 and highlighted that the time series models in fact complement the analysts’ forecasts. The results of the study similarly indicated the precision of the analysts’ forecasts to be questionable. Other studies, such as Cragg and Malkiel (1968) and Elton and Gruber (1972), had already signaled this conclusion.
Dimson and Marsh (1984) showed that the stock prices suffer fast reactions based on the information included in the analysts’ forecasts. Brav and Lehavy (2003) found significant reactions of the stock prices in the market regarding the information contained in the so called target prices, indicated by the analysts, even when separate from the profit forecasts and Jiang, Lu, and Zhu (2014) showed that there are significant market reactions to both upgrades and downgrades. On the other hand, Bjerring et al. (1983) detected that the information contained in the recommendations was not immediately reflected in the market prices for all the stocks. This effect is more frequent for analyses made on papers considered blue-chips and the speculative ones.
Elton et al. (1986) noticed that the reviews of the recommendations made by the analysts have relevant informational power. The results of that study showed that, on average, 4.5% of the annual extra returns can be achieved by purchasing shares which presented new buy recommendations in place of sell recommendations. One of the conclusions of the study was that the change of a stock recommendation has greater informational power than the maintenance of the past recommendation. Elton et al. (1986) presented that when the analysts change their recommendations, positive returns can be attained, and the information is absorbed in the stock price within three months. Jegadeesh et al. (2004) examined the performance of strategies founded on the analysts’ consensual recommendation reviews and discovered that the changes of quarterly recommendations were formed based on a prognosis of future returns. Nevertheless, there are divergent empirical evidences in literature. Altınkılıç and Hansen (2009) did not find reactions of significant and great returns in the reviews when compared to prior studies. Altınkılıç and Hansen (2009) suggest that the difference appears due to the fact that the analysts quickly review their recommendations after corporate news and the studies do not separate the specific returns from the recommendation reviews and corporate news. Furthermore, Altınkılıç and Hansen (2009) find the markets are more efficient than previously believed.
Jegadeesh and Kim (2006) documented significant evidences that the analysts’ recommendations can be valuable as, indeed, they can indicate opportunities of extraordinary earnings. Other studies similarly reported such aspect. In Barber et al. (2001), for instance, using data from 1986 to 1996, a portfolio composed of stocks (listed in the CRSP NYSE/AMEX/Nasdaq indexes) with more favorable recommendations provided a positive average annual gross return of 4.13%, whereas a portfolio composed of stocks with less favorable recommendations provided a negative return of 4.91%. The strategy of following the analysts’ recommendations and buying stocks favorably recommended and selling the ones unfavorably recommended caused a positive average abnormal monthly return of 7.5%. However, the results also showed that this return was significantly reduced if the portfolio rebalancing was not done daily.
Stickel (1995) documented that the buy recommendations issued by brokerage firms were associated with an average increase of 1.16% in the stock prices eleven days after the recommendation, whereas the sell recommendations were associated with a negative average of 1.28% of price fall. Moreover, according to Loh and Mian (2006), analysts who issued more accurate profit forecasts issued more profitable recommendations as well. And Hall and Tacon (2010) showed that the analysts who issued more accurate profit forecasts were not able to recommend more profitable stocks, which raises some divergent empirical evidences in literature.
Regarding the bias of the analyses, many studies, such as Elton et al. (1986), Womack (1996), Lin and McNichols (1998), Jegadeesh and Kim (2006) and Moshirian et al. (2009) highlighted the existence of positive bias in the recommendations, that is, they identified a greater number of favorable recommendations against unfavorable ones. Besides, they detected that the profit forecasts are usually optimist and that the analysts are more confident in the buy recommendations and the maintenance of stocks when compared to the sell recommendations. Those findings are present in the work of Francis and Philbrick (1993) as well. Similarly, the study of Jegadeesh and Kim (2006) showed the sell and strong sell recommendations are less frequent than the buy and strong buy recommendations in the capital markets of G7 countries. More recently, Moshirian et al. (2009) found the existence of this sort of bias in the recommendations made by emerging market analysts. Womack (1996) showed, for example, that the new buy recommendations were issued seven times more than new sell recommendations; such a result suggests that the brokerage firms are reluctant to issue unfavorable recommendations. The bias is, according to researchers, attributed to the fear the brokerage firms have of depreciating their commercial businesses, causing the analysts bound to them to be reluctant to make unfavorable recommendations to the current or potential client companies.
Lin and McNichols (1998), showed that the analysts affiliated to investment banks, responsible for leading new share subscriptions, issued recommendations and profit forecasts significantly more favorable to the companies whose subscriptions they coordinated when compared to the boundless analysts. The authors find this bias may reflect the incentive of the affiliated analysts to issue extremely favorable recommendations in order to keep relations with their clients. The share subscription is a process that requires substantial investment in the development and management of the relationship with the issuing companies. The issuance of an unenthusiastic report can discourage the hiring of the bank for the current subscription and future similar operations. Lin and McNichols (1998) indicated that there are incentives for the companies, which will make share subscriptions, to choose investment banks whose analysts present systematically more favorable opinions on their papers.
Another explanation for the existence of positive bias in the analysts’ stock recommendations is indicated in the studies of Womack (1996), Lin and McNichols (1998) and Irvine (2001). Womack (1996) highlighted the costs of sell recommendation issues are higher when compared to the buy recommendation issues. The issue of unfavorable recommendations is less frequent and more visible, which may represent a greater risk to the analysts’ reputation in case of error. Lin and McNichols (1998) argued that the buy recommendations cause a greater volume of stock negotiations; hence their greater number. Irvine (2001) defended the idea that analysts generate business opportunities for the firms in which they work and that is a decisive factor when choosing whether or not to follow the stocks.
In summary, the bibliographical review reveals four important aspects of the theme under discussion: (a) the informational power of the analysts’ stock recommendations in markets worldwide is a theme which instigates the curiosity of the market agents, experts and scientists; (b) there are consistent evidences that the analysts’ opinions provoke effects on the stock prices; (c) there is a bias in the analysts’ recommendations in order to show more positive perspectives to the companies and to cause a greater number of stock buy recommendations than sell ones; and (d) there is not an agreement on the ability of the analysts to preview the future behavior of stock prices. The contribution of this study aims to focus on this last aspect.
Empirical analysisData descriptionThe data used in this study were the analysts’ consensual stock recommendations (the numerical average of the recommendations of the analysts who issued recommendations for specific stock in the period), collected quarterly and obtained from the Institutional Broker Estimates System – IBES and the closing price series adjusted for earnings, both referring to the period from January, 2000 to December, 2010, obtained from the Economáatica databank. Recommendations on quarterly basis provided by the IBES were similarly used in the studies of Chan et al. (2006), Moshirian et al. (2009), Chen (2010) and Sidhu and Tan (2011). The reference for the identification of abnormal returns was the behavior of the returns offered by the variations of the exchange quote rate of Ibovespa, main stock index of the Brazilian capital market. Ibovespa was used, then, as a market behavior proxy. The adoption of a stock index as reference was also done in the studies of Bjerring et al. (1983), Stickel (1995), Jegadeesh and Kim (2006), Chan et al. (2006), Loh and Mian (2006), Moshirian et al. (2009), and Chen (2010).
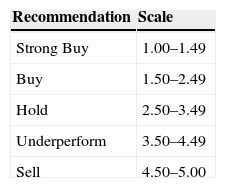
The recommendations collected were divided in five types: Strong Buy, Buy, Hold, Underperform, and Sell. This five-point scale is the most frequently used by the analysts, according to Barber et al. (2001). The issuances of recommendations are made in numerical scale provided by the IBES database, and are presented in Table 1.
MethodologyTreated as cross sectional data, the recommendations were useful for forming two stock portfolios, according to these steps:
- i.
The papers, which recommendations indicated Strong Buy and Buy, composed the Favorable Recommendation Portfolio – FR Portfolio, and the papers, which recommendations indicated Sell and Underperform, composed the Unfavorable Recommendation Portfolio – UR Portfolio. The recommendations taken into account for this initial composition of both portfolios were the ones publicized in the first quarter of 2000;
- ii.
In each one of the following quarters, the FR and UR portfolios were altered according to the new recommendations. The stocks of the FR portfolio, which received Strong Buy, Buy, and Hold were kept. The ones that received Sell and Underperform recommendations migrated to the UR portfolio. On the other hand, the stocks of the UR portfolio that received Sell, Underperform and Hold recommendations were kept on it. The ones that received Strong Buy and Buy recommendations migrated to the FR portfolio;
- iii.
Two historical series of quarterly returns were obtained, one for each portfolio. A statistical test of means was made to compare the portfolio returns.
The return on assets was calculated as follows:
where Rit=return of stock i at time t; Pit=closing price of stock i adjusted earnings in quarter t; Pit−1=closing price of stock i adjusted earnings in quarter t−1.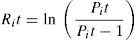
While the quarterly return of the portfolios was calculated as follows:
where Rp=portfolio return; R1, R2 and Rn=return on stocks included in the portfolio; n=number of stocks included in the quarter.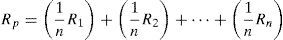
Stock returns were also calculated with the value-weighted portfolios.
Once the historical series of quarterly returns of the FR and UF portfolios were obtained, the following hypotheses were set and tested:H0 RμRF=RμRD→ The analysts are not able to forecast the future performance of the stocks. RμRF≠RμRD→ The analysts are able to forecast the future performance of the stocks.where RμRF is the average return of the FR portfolio; RμRD is the average return of the UR portfolio.
Two considerations deserve to be mentioned: (a) no special treatment was given to either the data or analyses due to the occurrence of the financial crisis which took place along the period chosen for the study, respected the affirmation of Sidhu and Tan (2011) that the most accurate analysts in the period prior to the crisis tend to be significantly more accurate also in contemporary and subsequent periods; (b) in case of acceptance of the hypothesis H1, the average returns of the FR portfolios must be higher than the ones of the UR portfolio so that the analysts can be considered capable of forecasting the future performance of the stocks.
The choice of the test of difference between the means was based on the studies of Lin and McNichols (1998), Irvine (2001), Hall and Tacon (2010) and Sidhu and Tan (2011) who made use of this method as well.
We performed additional tests separating the size of enterprises in small and medium-large. Medium and large companies have 85% capitalization of the Brazilian market and small have 15% of capitalization. We adapt from SMLL and MLCX indexes from BMF&Bovespa.
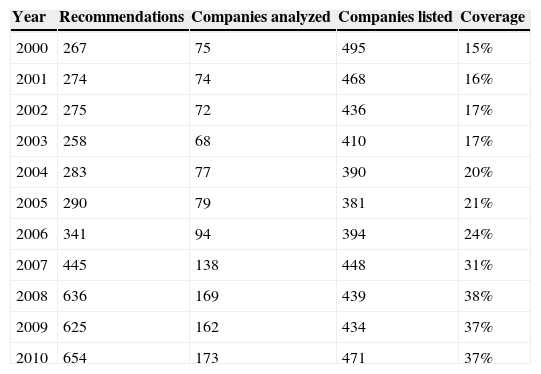
ResultsDescriptive analysisTable 2 shows, for each year, in the period from 2000 to 2010, the number of analysts’ recommendations analyzed, the number of companies analyzed and the percentage of the coverage reached by the analyses versus the number of companies listed at the BM&FBovespa. Clearly, it is possible to observe an increase, in this period, in the number of analyses (from 267 in 2000 to 654 in 2010), of the companies covered by the analysts (from 75 in 2000 to 173 in 2010) and in the coverage percentage (from 15% in 2000 to 37% in 2010).
Recommendations, companies and analyses coverage.
| Year | Recommendations | Companies analyzed | Companies listed | Coverage |
|---|---|---|---|---|
| 2000 | 267 | 75 | 495 | 15% |
| 2001 | 274 | 74 | 468 | 16% |
| 2002 | 275 | 72 | 436 | 17% |
| 2003 | 258 | 68 | 410 | 17% |
| 2004 | 283 | 77 | 390 | 20% |
| 2005 | 290 | 79 | 381 | 21% |
| 2006 | 341 | 94 | 394 | 24% |
| 2007 | 445 | 138 | 448 | 31% |
| 2008 | 636 | 169 | 439 | 38% |
| 2009 | 625 | 162 | 434 | 37% |
| 2010 | 654 | 173 | 471 | 37% |
Fig. 1 shows the comparison between the favorable (Strong Buy and Buy) and unfavorable (Underperform and Sell) consensual recommendations, according to the similar classification by Moshirian et al. (2009). It is worth highlighting that the number of favorable recommendations is higher in all the years analyzed. For each unfavorable recommendation issued, there was, on average, the issuance of twelve favorable recommendations. This type of bias had already been detected by Elton et al. (1986), Francis and Philbrick (1993), Womack (1996), Lin and McNichols (1998), Jegadeesh and Kim (2006), Martinez (2004) and Moshirian et al. (2009) as well, and it can be explained, according to Lin and McNichols (1998) and Moshirian et al. (2009), by the conflict of interests existing between the analysts who evaluate and recommend stocks of client companies, or potential client companies, of those same analysts.

The data raised revealed that, in 2008, the favorable recommendations reached 75% of the total recommendations analyzed. The Brazilian capital market lived, until 2008, a very positive phase of meaningful growth in the number of investors, of companies promoting their processes of going public, in the evolution of the stock prices and in the financial volume negotiated. In spite of the global positive scenario, Moshirian et al. (2009) indicated evidences that the favorable bias in emerging markets, such as the Brazilian market, tends to be greater than that in the developed markets.
The data reveals that the bias in the issuance of favorable recommendations made by the analysts is quite significant. While 62% of the recommendations were Strong Buy and Buy, only 6% received unfavorable recommendations of the Underperform and Sell types. The percentages detected are compatible with the ones obtained by Francis and Soffer (1997), who reported 55.2% of buy recommendations, 38% neutral and 6.8% sell recommendations.
The analysts, along with the brokerage firms, earn with the movements in the investors’ stock portfolios independently of the profitability given by the portfolio. This may indicate that the motivation for the number of favorable recommendations is the profit generated by the volume of stock negotiations made by the investors.
Thus, the recommendations may be classified as optimist and may be reclassified according to the analysts’ preference, demonstrating that there can be interest in the profit, which comes from the brokerage commission in the purchase of stocks. Besides, other forces can influence the forecasts and recommendations as well. For instance, there are arguments about the existence of incentives for the analysts to issue more buy than sell recommendations since the buy recommendations generate a greater negotiation volume, as indicated by Lin and McNichols (1998). In this sense, Irvine (2001) documented a positive relation between the coverage of the analysts and the negotiation volume of the brokerage firm, highlighting that during the year analyzed, the analysts’ coverage was positively associated with the brokerage firm negotiation volume. Furthermore, the study also revealed that the brokers present significantly more negotiations with covered than with non-covered stocks, a result which had already been detected by Lin and McNichols (1998).
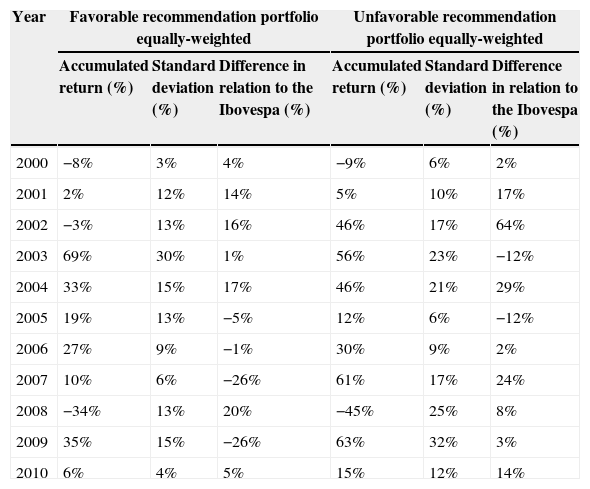
Out of the eleven years analyzed in this research, in seven of them (2001, 2002, 2004, 2006, 2007, 2009 and 2010), the accumulated return of the stock portfolio with unfavorable recommendations (UR) was higher than the stock portfolios with favorable recommendations (FR), whereas in four years (2000, 2003, 2005, 2008) out of the eleven, the FR presented a higher performance than the UR portfolio, considering equally-weighted portfolios. With value-weighted portfolios the UR exceeded in a single year (2004). These data can be observed in Table 3.
Behavior of the portfolio returns.
| Year | Favorable recommendation portfolio equally-weighted | Unfavorable recommendation portfolio equally-weighted | ||||
|---|---|---|---|---|---|---|
| Accumulated return (%) | Standard deviation (%) | Difference in relation to the Ibovespa (%) | Accumulated return (%) | Standard deviation (%) | Difference in relation to the Ibovespa (%) | |
| 2000 | −8% | 3% | 4% | −9% | 6% | 2% |
| 2001 | 2% | 12% | 14% | 5% | 10% | 17% |
| 2002 | −3% | 13% | 16% | 46% | 17% | 64% |
| 2003 | 69% | 30% | 1% | 56% | 23% | −12% |
| 2004 | 33% | 15% | 17% | 46% | 21% | 29% |
| 2005 | 19% | 13% | −5% | 12% | 6% | −12% |
| 2006 | 27% | 9% | −1% | 30% | 9% | 2% |
| 2007 | 10% | 6% | −26% | 61% | 17% | 24% |
| 2008 | −34% | 13% | 20% | −45% | 25% | 8% |
| 2009 | 35% | 15% | −26% | 63% | 32% | 3% |
| 2010 | 6% | 4% | 5% | 15% | 12% | 14% |
| Year | Favorable recommendation Portfolio value-weighted | Unfavorable recommendation portfolio value-weighted | ||||
|---|---|---|---|---|---|---|
| Accumulated return (%) | Standard deviation (%) | Difference in relation to the Ibovespa (%) | Accumulated return (%) | Standard deviation (%) | Difference in relation to the Ibovespa (%) | |
| 2000 | −39% | 16% | −28% | 1% | 5% | 12% |
| 2001 | −41% | 18% | −29% | −4% | 14% | 7% |
| 2002 | −27% | 15% | −9% | 79% | 20% | 97% |
| 2003 | 56% | 26% | −12% | 70% | 33% | 2% |
| 2004 | 29% | 11% | 13% | 25% | 14% | 9% |
| 2005 | 22% | 15% | −3% | 32% | 11% | 7% |
| 2006 | 30% | 9% | 2% | 36% | 9% | 8% |
| 2007 | 13% | 7% | −23% | 64% | 20% | 27% |
| 2008 | −23% | 10% | 30% | −10% | 8% | 43% |
| 2009 | 32% | 13% | −28% | 55% | 28% | −5% |
| 2010 | 7% | 4% | 6% | 24% | 14% | 23% |
According to the data in Table 3, in the first five years, the returns of the FR portfolios surpassed those of Ibovespa, but in the seven following years, the overturn took place only in 2008 and 2010. On the other hand, the UR portfolio had a fluctuating behavior in the six first years, but surpassed consistently the Ibovespa performance in the last five years of the period contemplated, considering equally weighted portfolios. In seven out of the eleven years, the UR portfolio surpassed the performance of the FR portfolio, which is evidence, under a first observation, that possibly the analysts had not been able to identify the best stocks in their recommendations. When the weight is value weighted the FR portfolio features lower returns to Ibovespa (2000, 2001, 2002, 2003, 2005, 2007 and 2009) while the UR portfolio has lower returns at the same index in a single year (2009).
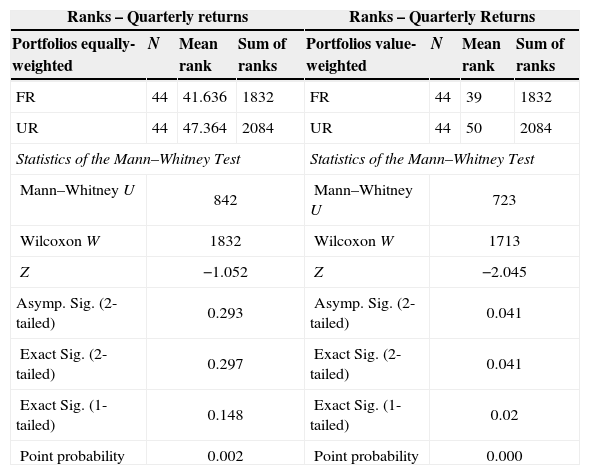
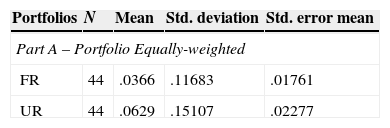
Tests performedTables 4 and 5 present the test of difference of means for independent samplings of quarterly returns of the FR and UR portfolios. It is seen that from the results obtained, there was no significant difference between the returns of the portfolios formed based on the analysts’ recommendations for the period analyzed (for equally weighted). In the value weighted portfolios there are significant differences between the means, but the UR portfolio offers superior performance in ten out of the eleven years analyzed indicating that analysts were not able to identify the difference between the returns.
Test of difference of means test of the quarterly returns of the portfolios.
| Ranks – Quarterly returns | Ranks – Quarterly Returns | ||||||
|---|---|---|---|---|---|---|---|
| Portfolios equally-weighted | N | Mean rank | Sum of ranks | Portfolios value-weighted | N | Mean rank | Sum of ranks |
| FR | 44 | 41.636 | 1832 | FR | 44 | 39 | 1832 |
| UR | 44 | 47.364 | 2084 | UR | 44 | 50 | 2084 |
| Statistics of the Mann–Whitney Test | Statistics of the Mann–Whitney Test | ||||||
| Mann–Whitney U | 842 | Mann–Whitney U | 723 | ||||
| Wilcoxon W | 1832 | Wilcoxon W | 1713 | ||||
| Z | −1.052 | Z | −2.045 | ||||
| Asymp. Sig. (2-tailed) | 0.293 | Asymp. Sig. (2-tailed) | 0.041 | ||||
| Exact Sig. (2-tailed) | 0.297 | Exact Sig. (2-tailed) | 0.041 | ||||
| Exact Sig. (1-tailed) | 0.148 | Exact Sig. (1-tailed) | 0.02 | ||||
| Point probability | 0.002 | Point probability | 0.000 | ||||
Test t of difference of means test of the quarterly returns of the portfolios.
| Portfolios | N | Mean | Std. deviation | Std. error mean |
|---|---|---|---|---|
| Part A – Portfolio Equally-weighted | ||||
| FR | 44 | .0366 | .11683 | .01761 |
| UR | 44 | .0629 | .15107 | .02277 |
| Levene's test for equality of variances | t-Test for equality of means | 95% confidence interval of the difference | |||||||
|---|---|---|---|---|---|---|---|---|---|
| F | Sig. | t | df | Sig. (2-tailed) | Mean difference | Std. error difference | Lower | Upper | |
| Equal variances assumed | 3.394 | .069 | −.912 | 86 | .364 | −.02625 | .02879 | −.08348 | .03099 |
| Equal variances not assumed | −.912 | 80.885 | .365 | −.02625 | .02879 | −.08353 | .03104 | ||
| Portfolios | N | Mean | Std. deviation | Std. error mean |
|---|---|---|---|---|
| Part B – Portfolio Value-weighted | ||||
| FR | 44 | .0133 | .13377 | .02017 |
| UR | 44 | .0843 | .15715 | .02369 |
| Levene's test for equality of variances | t-Test for equality of means | 95% confidence interval of the difference | |||||||
|---|---|---|---|---|---|---|---|---|---|
| F | Sig. | t | df | Sig. (2-tailed) | Mean difference | Std. error difference | Lower | Upper | |
| Equal variances assumed | 1.190 | .278 | −2.281 | 86 | .025 | −.07096 | .03111 | −.13281 | −.00911 |
| Equal variances not assumed | −2.281 | 83.861 | .025 | −.07096 | .03111 | −.13283 | −.00909 | ||
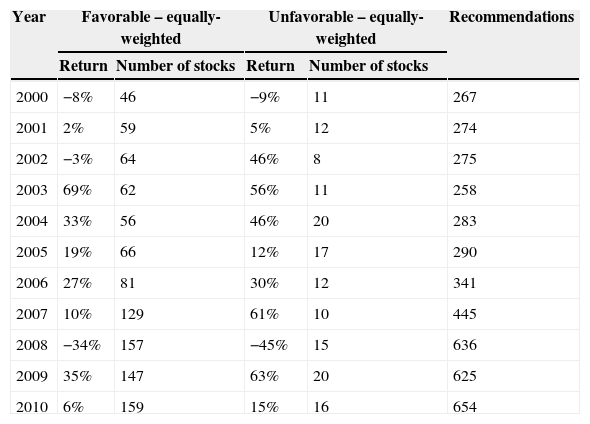
In Table 6 are presented not only the quarterly returns, but also the stocks, which composed the FR and UR portfolios in the period analyzed. Additionally, the number of the analysts’ recommendations considered in each year is presented. The data revealed that along the whole time, the FR portfolio was always composed by a higher number of stocks. This composition aspect of the portfolios may indicate that the analysts are more concerned about their own earnings rather than with a true analysis of the potential performance of the papers they recommend. Moreover, the companies analyzed could be clients or potential clients, what had already been indicated in studies, such as Lin and McNichols (1998), Irvine (2001) and Moshirian et al. (2009).
Return and number of stocks of the FR and UR portfolios and number of recommendations.
| Year | Favorable – equally-weighted | Unfavorable – equally-weighted | Recommendations | ||
|---|---|---|---|---|---|
| Return | Number of stocks | Return | Number of stocks | ||
| 2000 | −8% | 46 | −9% | 11 | 267 |
| 2001 | 2% | 59 | 5% | 12 | 274 |
| 2002 | −3% | 64 | 46% | 8 | 275 |
| 2003 | 69% | 62 | 56% | 11 | 258 |
| 2004 | 33% | 56 | 46% | 20 | 283 |
| 2005 | 19% | 66 | 12% | 17 | 290 |
| 2006 | 27% | 81 | 30% | 12 | 341 |
| 2007 | 10% | 129 | 61% | 10 | 445 |
| 2008 | −34% | 157 | −45% | 15 | 636 |
| 2009 | 35% | 147 | 63% | 20 | 625 |
| 2010 | 6% | 159 | 15% | 16 | 654 |
| Year | Favorable – value weighted | Unfavorable – value weighted | Recommendations | ||
|---|---|---|---|---|---|
| Return | Number of stocks | Return | Number of stocks | ||
| 2000 | −39% | 46 | 1% | 11 | 267 |
| 2001 | −41% | 59 | −4% | 12 | 274 |
| 2002 | −27% | 64 | 79% | 8 | 275 |
| 2003 | 56% | 62 | 70% | 11 | 258 |
| 2004 | 29% | 56 | 25% | 20 | 283 |
| 2005 | 22% | 66 | 32% | 17 | 290 |
| 2006 | 30% | 81 | 36% | 12 | 341 |
| 2007 | 13% | 129 | 64% | 10 | 445 |
| 2008 | −23% | 157 | −10% | 15 | 636 |
| 2009 | 32% | 147 | 55% | 20 | 625 |
| 2010 | 7% | 159 | 24% | 16 | 654 |
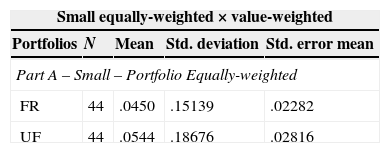
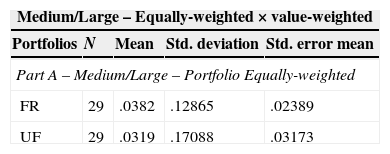
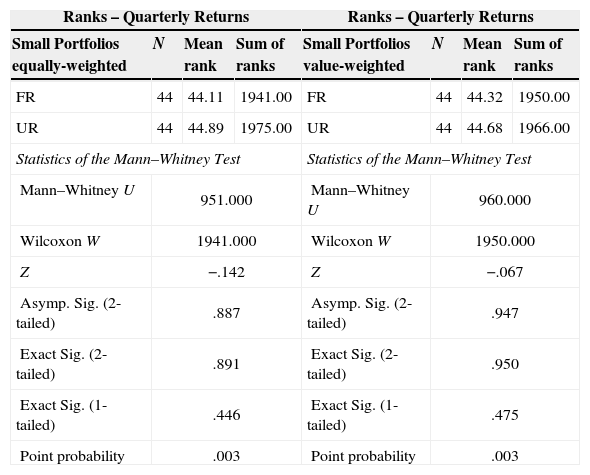
We can see in Tables 7–9 that the analysts were unable to differentiate the stocks with the separation in Small and Medium-Large capitalization. It is seen that from the results obtained, there was no significant difference between the returns of the portfolios formed based on the analysts’ recommendations for the period analyzed.
Test t of difference of means test of the quarterly returns of the portfolios (small capitalization).
| Small equally-weighted×value-weighted | ||||
|---|---|---|---|---|
| Portfolios | N | Mean | Std. deviation | Std. error mean |
| Part A – Small – Portfolio Equally-weighted | ||||
| FR | 44 | .0450 | .15139 | .02282 |
| UF | 44 | .0544 | .18676 | .02816 |
| Levene's test for equality of variances | t-Test for equality of means | 95% confidence interval of the difference | |||||||
|---|---|---|---|---|---|---|---|---|---|
| F | Sig. | T | df | Sig. (2-tailed) | Mean difference | Std. error difference | Lower | Upper | |
| Equal variances assumed | .764 | .384 | −.260 | 86 | .795 | −.00944 | .03624 | −.08149 | .06261 |
| Equal variances not assumed | −.260 | 82.468 | .795 | −.00944 | .03624 | −.08153 | .06265 | ||
| Portfolios | N | Mean | Std. deviation | Std. error mean |
|---|---|---|---|---|
| Part B – Small – Portfolio Value-weighted | ||||
| FR | 44 | .0476 | .14094 | .02125 |
| UF | 44 | .0573 | .17236 | .02598 |
| Levene's test for equality of variances | t-Test for equality of means | 95% confidence interval of the difference | |||||||
|---|---|---|---|---|---|---|---|---|---|
| F | Sig. | t | df | Sig. (2-tailed) | Mean difference | Std. error difference | Lower | Upper | |
| Equal variances assumed | 1.146 | .287 | −.287 | 86 | .775 | −.00963 | .03357 | −.07636 | .05709 |
| Equal variances not assumed | −.287 | 82.738 | .775 | −.00963 | .03357 | −.07640 | .05713 | ||
Test t of difference of means test of the quarterly returns of the portfolios (medium-large capitalization).
| Medium/Large – Equally-weighted×value-weighted | ||||
|---|---|---|---|---|
| Portfolios | N | Mean | Std. deviation | Std. error mean |
| Part A – Medium/Large – Portfolio Equally-weighted | ||||
| FR | 29 | .0382 | .12865 | .02389 |
| UF | 29 | .0319 | .17088 | .03173 |
| Levene's test for equality of variances | t-Test for equality of means | 95% confidence interval of the difference | |||||||
|---|---|---|---|---|---|---|---|---|---|
| F | Sig. | t | df | Sig. (2-tailed) | Mean difference | Std. error difference | Lower | Upper | |
| Equal variances assumed | .777 | .382 | .157 | 56 | .875 | .00625 | .03972 | −.07332 | .08582 |
| Equal variances not assumed | .157 | 52.023 | .876 | .00625 | .03972 | −.07345 | .08595 | ||
| Portfolios | N | Mean | Std. deviation | Std. error mean |
|---|---|---|---|---|
| Part B– Medium/Large – Portfolio Value-weighted | ||||
| FR | 29 | .0407 | .13491 | .02505 |
| UF | 29 | .0261 | .18822 | .03495 |
| Levene's test for equality of variances | t-Test for equality of means | 95% confidence interval of the difference | |||||||
|---|---|---|---|---|---|---|---|---|---|
| F | Sig. | t | df | Sig. (2-tailed) | Mean difference | Std. error difference | Lower | Upper | |
| Equal variances assumed | .944 | .335 | .339 | 56 | .736 | .01458 | .04300 | −.07157 | .10072 |
| Equal variances not assumed | .339 | 50.762 | .736 | .01458 | .04300 | −.07177 | .10092 | ||
Test of difference of means test of the quarterly returns of the portfolios (small and medium-large capitalization).
| Ranks – Quarterly Returns | Ranks – Quarterly Returns | ||||||
|---|---|---|---|---|---|---|---|
| Small Portfolios equally-weighted | N | Mean rank | Sum of ranks | Small Portfolios value-weighted | N | Mean rank | Sum of ranks |
| FR | 44 | 44.11 | 1941.00 | FR | 44 | 44.32 | 1950.00 |
| UR | 44 | 44.89 | 1975.00 | UR | 44 | 44.68 | 1966.00 |
| Statistics of the Mann–Whitney Test | Statistics of the Mann–Whitney Test | ||||||
| Mann–Whitney U | 951.000 | Mann–Whitney U | 960.000 | ||||
| Wilcoxon W | 1941.000 | Wilcoxon W | 1950.000 | ||||
| Z | −.142 | Z | −.067 | ||||
| Asymp. Sig. (2-tailed) | .887 | Asymp. Sig. (2-tailed) | .947 | ||||
| Exact Sig. (2-tailed) | .891 | Exact Sig. (2-tailed) | .950 | ||||
| Exact Sig. (1-tailed) | .446 | Exact Sig. (1-tailed) | .475 | ||||
| Point probability | .003 | Point probability | .003 | ||||
| Ranks – Quarterly Returns | Ranks – Quarterly Returns | ||||||
|---|---|---|---|---|---|---|---|
| Medium and Large Portfolios equally-weighted | N | Mean rank | Sum of ranks | Medium and large portfolios value-weighted | N | Mean rank | Sum of ranks |
| FR | 29 | 28.76 | 834.00 | FR | 29 | 29.17 | 846.00 |
| UR | 29 | 30.24 | 877.00 | UR | 29 | 29.83 | 865.00 |
| Statistics of the Mann–Whitney Test | Statistics of the Mann–Whitney Test | ||||||
| Mann–Whitney U | 399.000 | Mann–Whitney U | 411.000 | ||||
| Wilcoxon W | 834.000 | Wilcoxon W | 846.000 | ||||
| Z | −.334 | Z | −.148 | ||||
| Asymp. Sig. (2-tailed) | .738 | Asymp. Sig. (2-tailed) | .883 | ||||
| Exact Sig. (2-tailed) | .746 | Exact Sig. (2-tailed) | .890 | ||||
| Exact Sig. (1-tailed) | .373 | Exact Sig. (1-tailed) | .445 | ||||
| Point probability | .006 | Point probability | .006 | ||||
We emphasize that the difference between the number of quarters concerning small companies testing (n=44) and medium-large (n=29) occurred because there were no unfavorable recommendations for Medium-Large firms in 2002, 2003 and 2004 and in the 1st quarter of 2015, the 1st and the 2nd quarter of 2007.
DiscussionThe results of the study showed a bias in the issuance of stock recommendations made by the analysts who work in the capital market. In the period analyzed, there was a systematically higher number of favorable recommendations when compared to the number of unfavorable recommendations. In the general annual average, there were 62% favorable recommendations against 6% unfavorable recommendations. This bias found in the Brazilian analysts’ recommendations, during the analyzed period – from 2000 to 2010 – confirmed what had been documented by prior studies, such as Elton et al. (1986), Francis and Philbrick (1993), Womack (1996), Lin and McNichols (1998), Jegadeesh and Kim (2006), and Moshirian et al. (2009). This apparent optimism of the analysts, according to those researchers, can be explained by the existence of a conflict of interests since the companies analyzed could be clients of those same analysts. Moreover, Lin and McNichols (1998) discuss that the buy recommendations generate greater negotiation volume, which can motivate the analysts to issue a higher number of favorable recommendations than unfavorable ones.
Concerning the returns of the portfolios formed based on the stock recommendations issued by Brazilian analysts, it was seen that, in seven out of eleven years, the portfolio composed by stocks with unfavorable recommendations – UR Portfolio – surpassed the return of the market portfolio (Ibovespa) and the return of the portfolio composed by stocks with favorable recommendations – FR Portfolio. Besides, significant difference between the returns of the FR and UR Portfolios was not identified (for equally weighted), indicating, under another perspective, that the analysts were not able to properly detect the stocks that would offer greater returns. For the value-weighted portfolios there are significant differences between the means, but quarterly returns in the UR portfolio are greater than the FR portfolio quarters in 32 of the 44 analyzed. This represents 72.73% of the quarters. Therefore reinforcing that analysts failed to differentiate between stock returns over the period analyzed (even after controlling for size the results remained unchanged). These results are in accordance with the ones obtained by Cragg and Malkiel (1968), Elton and Gruber (1972), and Guerard and Beidleman (1986), who similarly questioned the efficiency of the forecasts issued by the market analysts. Still, Villalobos (2005) states that the activity of analysts does not add value in relation to statistical forecasting models.
Nevertheless, the results obtained herein are contrary to the results of Moshirian et al. (2009) and Martinez (2004), which found a significant difference between the most favorable and least favorable portfolio.
In the Brazilian capital market, a bias of a much higher number of favorable stock recommendations, made by the analysts, was detected. This bias, which was also detected by Irvine (2001) reveals that the number of stocks covered by the analysts was higher than the number of stocks which were not covered by them; and that the negotiation volumes of both stock groups reflect the same unbalance. The negotiation volume is a determining factor in the analyst's choice of which company to follow.
The overview conclusion of the study is that the Brazilian analysts were not able to correctly identify the best stocks, by the ability to generate higher returns along the period analyzed, which covered the period from 2000 to 2010.
Peer Review under the responsibility of Universidad Nacional Autónoma de México.