


This research attempts to detect some brand loyalty key specific antecedent variables based on three groups of measurements: consumer involvement, perceived brand value (consumer brand equity), and customer satisfaction. Questions that drove the study were: which variables from which of the three dimensions would have the major effect on loyalty measurements? Would the explicatory variables be consistent across all product categories? 649 respondents were divided into six product categories. Regression models were obtained for each product category and for each loyalty measurement. Perceived brand value variables tended to have the higher impact on loyalty measurements. Self-identification with the brand (self-congruence) and perceived brand quality tended to be the variables with the major effect on loyalty measurements across all product categories.
En este estudio se pretende detectar algunos antecedentes clave de la lealtad hacia la marca basándose en 3 grupos de variables: involucramiento del consumidor, percepción de valor de marca y satisfacción del cliente. Preguntas de investigación que dieron pie a este estudio fueron: ¿qué variables de estos 3 grupos tienen mayor impacto en las medidas de lealtad?, ¿es consistente este impacto en las diferentes categorías de producto? La muestra se conformó por 649 consumidores separados en 6 categorías de producto. Se realizaron análisis de regresión para cada categoría y para cada medida de lealtad. Las variables asociadas a la percepción de valor de la marca fueron las de mayor efecto sobre las medidas de lealtad. Particularmente, las variables que tuvieron mayor impacto en las distintas categorías fueron autoidentificación con la marca y calidad percibida de la marca.
Brand loyalty has become a major topic in marketing and consumer research, and its importance as a consumer–behavioral phenomena is that it is a business performance measurement that can have an effect on business financial performance (Khan, 2014; Khan, 2013; Kuo & Chang, 2011; Storbacka, Strandvik, & Grönroos, 1994; Hallowell, 1996). A review of the literature reveals that research efforts have basically been along two lines, one offering explanations of what it is and which dimensions conform it as a construct (Oliver, 1999; Rundle-Thiele & Mackay, 2001; Salegna & Goodwin, 2005), and the other searching for factors that can predict it and strategies that can effectively encourage it. In this second line, many antecedents of loyalty have been proposed as single constructs that result in many partial explanations (Bloemer, De Ruyter, & Wetzels, 1999; Spreng & Mackoy, 1996; Yu & Dean, 2001). In a more recent trend there are proposes more holistic multi-construct explanations as antecedents to brand loyalty (Aurier & Gilles Séré, 2012; Bei & Chiao, 2001; Curran & Healy, 2014; Lam, Shankar, Erramilli, & Murthy, 2004; Mattila, 2004; Qayyum, Khang, & Krairit, 2013; Suh & Yi, 2006).
This study considers measurements of three constructs established in literature as brand loyalty antecedents and efforts to determine which single variables have the greatest statistical effect on loyalty measurements. In this manner, these variables are grouped in: (1) consumer involvement with the product; (2) perceived brand value; and (3) customer satisfaction. The theory is that consumers tend to show loyalty toward a brand as long as they perceive a high brand value (equity), a significant involvement with the product, and a high brand satisfaction. Many studies have shown that satisfaction measurements (Baumann, Elliott, & Burton, 2012; Espejel, Fandos, & Flavián, 2008; Froehling, 2008; Qayyum et al., 2013; Toelle, 2006) and consumer involvement with the product (Hu, 2011; Ismail, Talukder, & Panni, 2006) lead to loyalty, but there have been no studies that offer a more well-rounded assessment by relating the diversity of variables that could explain loyalty measurements to diverse product categories, as this study is intended to do. Although studies addressing construct level relationships of antecedents to brand loyalty provide strong theoretical explanations (as the majority of the published studies have done), these explanations tend to be somehow too abstract and unspecific. On the other hand, knowing that some particular variables consistently explain loyalty measurements across different product categories could allow the proposition of tactics that could be used to encourage customers’ intentions toward a brand. Thus, this study attempts to contribute to an understanding of how brand loyalty can be encouraged by some specific variables in some specific product categories. Thus, the main research questions in the current study are (1) which of the variables associated to consumer involvement, perceived brand value, or customer satisfaction have the greatest effect on loyalty measurements? and (2) are the significant explicatory variables consistent across all product categories? Hypotheses and other research questions are presented in the Framework section.
Theoretical backgroundConsumer involvement componentsThere have been several studies on consumer involvement and its components. Involvement is understood as the quantity and type of information the consumer processes when making a decision about which brand to buy. For the buyer, purchasing implies a certain level of situational involvement and information processing (Laurent & Kapferer, 1985, 1986; McQuarrie & Munson, 1987; Ober-Heilig, Bekmeier-Feuerhahn, & Sikkenga, 2014; Schneider & Rodgers, 1996; Zaichkowsky, 1985). A review of the literature shows that the consumer involvement concept has greatly evolved. Originally, it was treated as a one-dimensional notion, but later different types of involvement were proposed, such as risk-based involvement and importance-based involvement (Laurent & Kapferer, 1985). Since 1985 a significant amount of literature has sustained that an involvement profile, formed by measurement of many components or dimensions, should be identified (Jain & Srinivasan, 1990; Laurent & Kapferer, 1985; Mittal, 1989; Schneider & Rodgers, 1996). This profile will be different for each product category and for each consumer segment (Laurent & Kapferer, 1985).
Perceived risk, symbolic value, product pleasure, and product relevance are some of the consumer involvement components that have been incorporated into the literature. As each component level increases, involvement becomes more complex (Laurent & Kapferer, 1985). Authors concur in general terms on the existence of these involvement components, although with certain variations on the exact type and number (Higie and Feick, 1989; Jain & Srinivasan, 1990; McQuarrie & Munson, 1987). Evidence suggests recognition of six components, (1) interest in the product, (2) perceived pleasure with the product, (3) symbolic or cultural value of the product, (4) importance of the product, (5) product risk importance, and (6) perceived product performance risk probability (Laurent & Kapferer, 1985; Schneider & Rodgers, 1996). The IP6 scale (Vera, 2003) is adopted for this study as it considers these six components.
Perceived brand value (brand equity)The term “perceived brand value” used in this study is based on the “consumer-based brand equity” term proposed by Feldwick (1996), where “brand equity” can assume three different meanings. First, it can be understood as a brand's monetary value; second, as related to a brand's performance in the market, performance linked to aspects such as awareness, perceived quality, and also loyalty; and third, as a brand image—a description of the perceptions, associations, and beliefs that the consumer may have about the brand. The last two uses are consistent with a customer's appreciation of a brand, and are the ones commonly called consumer brand equity (Aurier & Gilles Séré, 2012; Feldwick, 1996; Khan, Rahmani, Hoe, & Chen, 2015), or customer-based brand equity (Allaway, Huddleston, Whipple, & Ellinger, 2011; Chen & Tseng, 2010; Keller, 1993). In this article is adopted the term “perceived brand value” instead of “consumer brand equity” based on the name of the adopted scale for its measurement (Vera, 2008).
For consumer brand equity to be created, consumers have to believe that there are important differences between brands in the same product category (Keller, 1993, 2008). Forming strong, favorable, distinctive brand associations can positively affect consumers’ responses (Keller, 1993; Khan et al., 2015; Pinar, Girard, & Eser, 2012). Some authors, such as Aaker (1996), consider that loyalty represent a dimension of brand equity. Others, such as Keller (1993, 2008), adopt a vision where brand loyalty is a result of having a strong brand. In other words, brand loyalty is considered a dependent variable of brand equity rather than a dimension of it. This article follows this second idea, therefore the measurements of brand value and brand loyalty were separated into different groups. Thus, to measure perceived brand value, items related to loyalty were not retaken from the adopted scale (Vera, 2008); only items related to strong, favorable, distinctive brand connotations were used.
Customer satisfaction measurementsAlthough there is no clear consensus to give a single definition of satisfaction (Sawmong & Omar, 2004), authors tend to agree that it derives from a comparison process between previous experiences, expectations, and the product's real performance (Bei & Chiao, 2001; Oliver, 1980). It is frequently explained as a continuum confirmation–disconfirmation of the expectations that a customer has of a product or service (Oliver, 1980, 1999). There is no recognized standard scale for this construct, and even very sophisticated measurements of satisfaction have been proven with limitations (Nawi & Al Mamun, 2014; Reichheld, 2003). These limitations have to do in many cases with stability and generalizability issues. Nevertheless, some of the best-known, and frequently quoted satisfaction scales are the American Customer Satisfaction Index (ACSI) (Fornell, Johnson, Anderson, Cha, & Bryant, 1996), the European Customer Satisfaction Index (ECSI) (Kristensen, Juhl, & Østergaard, 2001), and the Malaysian Index of Customer Satisfaction (MICS) (Abdullah, Husain, & El-Nassir, 2001). In all three, satisfaction is measured in three forms: overall satisfaction, distance between the product performance and customer expectations, and distance between products’ perceived performance and the ideal performance. Thus, measurements based on these three variables are used for this study. Here, the participants were asked about their cumulative satisfaction, as Johnson and Fornell (1991) suggest. When cumulative satisfaction is measured, the respondents consider all the experiences with a brand over time (Fornell et al., 1996). According to different authors (Fornell et al., 1996; Johnson, Gustafsson, Andreassen, Lervik, & Cha, 2001; Line & Johnson, 2003) cumulative satisfaction is a better predictor for the future customers’ behavior than the satisfaction in a specific transaction. Oliver (1980) found that satisfaction derived from past experience precedes and influences post-purchase attitude. Hence, the concept of cumulative satisfaction implies that customers rely on their entire experience when forming intentions and making repurchase decisions (Line & Johnson, 2003).
Brand loyaltyNowadays the concept of loyalty tends to be considered a complex multidimensional phenomenon (Aurier & Gilles Séré, 2012; Curran & Healy, 2014; Oliver, 1999; Qayyum et al., 2013). Measuring a single variable (for example, repurchasing) provides an incomplete approach. Oliver (1999) points out that a customer goes through a process of becoming loyal to a brand. First, he is loyal in a cognitive sense when there is good information and positive previous experiences with the brand. Next, there is loyalty in an affective sense, which is achieved when a consumer is emotionally involved with the brand. Intentional loyalty is reflected in a customer's willingness to purchase, repurchase, or recommend the brand. Finally, action loyalty refers to the observed and actual repurchasing of the brand.
Oliver (1999) is not the only author who has identified different types of loyalty. Yu and Dean (2001) developed a study in which they recognized two components that affect loyalty. The first is the cognitive, which is defined as the performance evaluation perceived in terms of its adequacy as compared to expected standards. The second is the emotional, which is formed by feelings whose object of reference is the brand. Mattila (2004) defines loyalty as the relation between relative attitudes and the pattern of repeated purchases. For Lam et al. (2004) however loyalty has two dimensions: recommendation and pattern repetition. In Rundle-Thiele and Mackay (2001) loyalty measurement has two approaches. In one, loyalty is defined in terms of actual purchases observed during a period of time. This aspect is measured by real purchases, and the second measurement refers to attitude. For the latter, loyalty measurements are based on preferences, commitment, and purchase intention. Considering the above approaches, Oliver's (1999) can be considered the most holistic. His approach encompasses the dimensions of other authors, which is why it was the one selected to determine the loyalty measurements used here. These phases (components) of loyalty are described in the following paragraphs.
Cognitive phase. This is the first phase of loyalty. It is guided by the information that the consumer has about a product or service, especially regarding the costs and benefits of acquiring it. With this information, the customer prefers a certain brand over its alternatives (Oliver, 1999). In this phase loyalty is driven by certain practical factors, such as price; therefore, the bond with the brand is not as strong in this phase (Sivadas & Backer-Prewitt, 2000). Oliver (1999) suggests that once this phase is accomplished then the other phases of loyalty will follow in a sequential manner. Sawmong and Omar (2004) use the phases of loyalty proposed by Oliver (1999). They measure cognitive loyalty with costs and benefits. Yu and Dean (2001) also define the cognitive component in the same way. They measure it in terms of expectations, where meeting expectations implies a cognitive evaluation of the benefits. Once a brand is considered sufficient, then it can be among a customer's group of meaningful choices.
Affective phase. This can be explained as a customer's bond with the brand based on the accumulation of pleasing experiences (Baumann et al., 2012; Oliver, 1999). This type of loyalty is different from the rest since it involves a consumer's emotional attachment. In this stage, however, consumers may also switch to another brand even if this bond exists (Sawmong & Omar, 2004); for example, if the other brand offers suddenly a much lower price (Sawmong & Omar, 2004).
Intentional phase. In literature “intentional loyalty” is also referred as “behavioral intention”. It is influenced by events of emotional attachment toward a brand. It is during this phase when a customer's sustained commitment toward the brand begins (Oliver, 1999). The Behavioral-Intentions scale, developed by Zeithaml, Berry, & Parasuraman (1996), considers four measurements of intentional loyalty: recommendation, purchase intention, price sensibility, and complaint behavior. In recent studies are used this type of measurements to asses purchase intention (Aurier & Gilles Séré, 2012; Khan et al., 2015).
Action phase. In this type of loyalty, habits and routine behavioral responses already exist (Oliver, 1999). Here the customer chooses the same alternative regardless of the possibility that other brands might be offering appreciable benefits. Some authors, such as Sawmong and Omar (2004), measured this type of loyalty in supermarkets. They focused on aspects such as the lapse of time between one purchase and another as well as on the money spent on each alternative.
Conceptual frameworkIn some previous studies it has been exclusively linked satisfaction with loyalty (Baumann et al., 2012; Espejel et al., 2008; Froehling, 2008; Qayyum et al., 2013; Toelle, 2006) while in others it has been established consumer brand equity (perceived brand value) variables as loyalty antecedents (Chaudhuri, 1999; Curran & Healy, 2014; Pinar et al., 2012; Qayyum et al., 2013; Taylor, Celuch, & Goodwin, 2004). In others it has been stated consumer involvement components as precedents for loyalty (Hu, 2011; Ismail et al., 2006; Olsen, 2007; Suh & Yi, 2006). Suh and Yi (2006) find that in low involvement products satisfaction has a major effect on loyalty. On the other hand, in high involvement products, other variable would have a major impact, such as corporate image, advertising, and brand attitudes (Suh & Yi, 2006). As previously noted, the purpose of the present study is to outline certain key variables that could explain brand loyalty based on: perceived brand value, consumer involvement, and customer satisfaction, as it is shown in Fig. 1.

Thus, the present article explores a wide range of variables that may significantly relate to loyalty. As noted before, according to Oliver's components (1999), the following dependent variables (loyalty dimensions) were established to assess brand loyalty:Cognitive loyalty (favorable knowledge about the brand)Affective loyalty (emotional attachment to the brand)Intentional loyalty (intentional behavior to purchase the brand)Action loyalty (repurchase behavior)
In the case of perceived brand value (consumer brand equity), this article considers Aaker's (1994, 1996) perspective on the dimensions within the brand equity construct, using a scale developed to measure brand equity profiles (Vera, 2008) and selecting only the items related to brand favorable and distinctive brand association performance. This scale also includes loyalty items. Because the obvious overlap with the dependent variables, they were not used. Thus the components used to assess this perceived brand value were:Perceived brand quality (how good are the products under the brand)Perceived brand leadership (how innovative its products are perceived)Perceived brand use-value (usefulness of the products under the brand)Disposition to pay a higher price for the brand (premium price)Self-identification with the brand (degree in which a consumer relates himself to the brand's image, self-congruence with brand's personality)
If perceived brand value, under many types of measurements, has been established as a loyalty antecedent (Chaudhuri, 1999; Liu, Xue, & Duan (2011); Nam, Ekinci, & Whyatt, 2011; Taylor et al., 2004), then a positive effect between these variables and the loyalty measurements is to be expected. Therefore, the hypothesis can be expressed as:H1 Perceived brand value measurements would have a positive relationship with loyalty measurements.
This study used several items to measure consumer involvement components. They were obtained from a scale called IP6 (Vera, 2003), developed to measure involvement profiles with Mexican consumers based on six components. The IP6 takes elements from the scale developed by Laurent and Kapferer (1985) and also measures an additional component (product importance) proposed by Schneider and Rodgers (1996). Thus for consumer involvement the measured variables were:Interest in the productPerceived pleasure in the productProduct symbolic valuePerceived product importance (Schneider & Rodgers, 1996)Perceived product risk importancePerceived product risk probability
Some studies have empirically established a low positive relation between consumer involvement and loyalty (Hu, 2011; Quester, Karunaratna, & Lim, 2003). Even more, it has been found that involvement can have a moderating effect between satisfaction and loyalty (Olsen, 2007; Suh & Yi, 2006). In the current study it is assumed that as the consumer involvement toward the product increases, so will the importance of the brand's evaluation. Consequently, when the product implies a higher degree of involvement for the consumer (higher interest, pleasure, importance, risk, and risk importance) therefore it is assumed that he would try to find a brand of higher perceived value that could guarantee the product performance. In other words, he will look for a brand toward which he would be inclined to have a higher psychological commitment and thus more loyalty (Iwasaki & Havitz, 1998; Quester et al., 2003). Therefore, a positive statistical association between involvement components and loyalty measurements can be expected, hence:H2 Consumer involvement measurements would have a positive relationship with loyalty measurements.
Consistent with previous approaches (Abdullah et al., 2001; Fornell et al., 1996; Kristensen et al., 2001; Nawi & Al Mamun, 2014), in the present study the following three measurements (forms) are used to assess customer satisfaction:Overall satisfaction expressed toward the product performancePerceived distance between product performance and client expectationsPerceived distance between the product performance and its ideal performance
The satisfaction and loyalty relationship has been widely dealt with in marketing research literature. Thus, satisfaction has been established as an important brand loyalty precedent (Baumann et al., 2012; Bei & Chiao, 2001; Cronin, Brady, & Hult, 2000; McDougall & Levesque, 2000; Olsen, 2007; Qayyum et al., 2013; Ryu, Lee, & Kim, 2012; Suh & Yi, 2006). In this line of reasoning the assumption is that when a customer is more gratified with a brand then he would manifest behavioral intentions and repurchasing behavior. The corresponding hypothesis can be phrased as:H3 Customer satisfaction forms would have a positive relationship with loyalty components.
As brand perceived value, consumer involvement and customer satisfaction have been previously proposed as explanatory factors for brand loyalty; therefore, the three hypotheses here presented can be considered as accepted principles. For this reason, the current article does not rely on these hypotheses. The unique contribution of the present study is based on an identification of a particular set of independent variables that may explain different loyalty measurements in a variety of product categories. The goal here is to find a consistent group of specific variables that could be considered more effective as loyalty generators in a wide range of product categories. Therefore, the research questions that have driven the current research work can be expressed as follows:
- •
Which of the independent variables established here would have a greater significantly effect on the loyalty measurements?
- •
Which of the three groups of independent variables (involvement, brand value or satisfaction), would have the major effect on the loyalty measurements?
- •
To what degree would the independent variables explain the loyalty measurements?
- •
Would the significant explicatory variables be consistent across all product categories?
Different product categories were used to obtain a larger external validation. The selected six product categories correspond to different levels of involvement, from high to low, according to the type of selected consumers: laptops (high) women's dress shoes (high); running shoes (medium-high); lipstick (medium-low); canned soda (low); and bottled water (low). Previous studies related to loyalty have used some of the same product categories as those posed in this one: Moradi and Zarei (2012) conducted a study with laptops; Matzler, Bidmon, and Grabner-Kräuter (2006) had a sample of buyers of running shoes; and Kim, Morris, and Swait (2008) used soft drinks.
As it can be seen in many studies (Laurent & Kapferer, 1985; Quester et al., 2003; Suh & Yi, 2006; Van den Brick, Odekerken-Schröder, & Pauwels, 2006; Zaichkowsky, 1985) complex, technological, hedonic and costly products tend to correspond to high consumer involvement products as they demand an extensive decision-making process and signify a high buying risk importance (bra, dress, T.V., photographic camera, automobile). On the other hand, mass-produced inexpensive products of daily consumption tend to correspond to low involvement products as they are chosen with a short decision-making process and denote a low purchase risk importance (instant coffee, soap, oil, toothpaste, detergent).
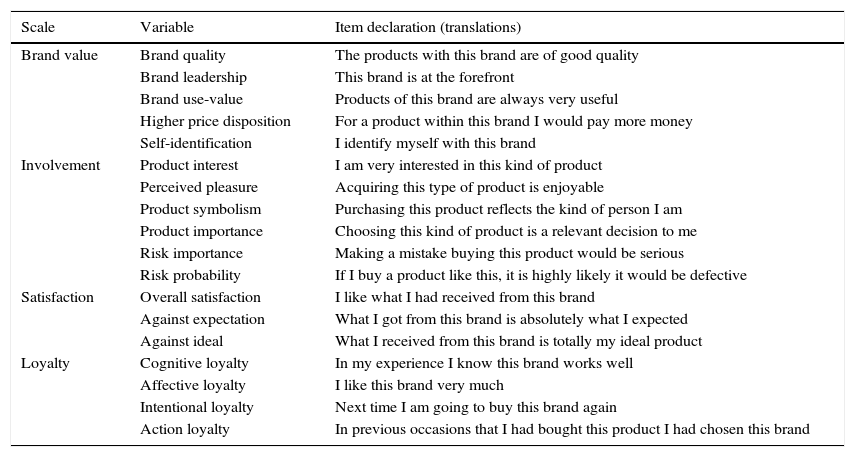
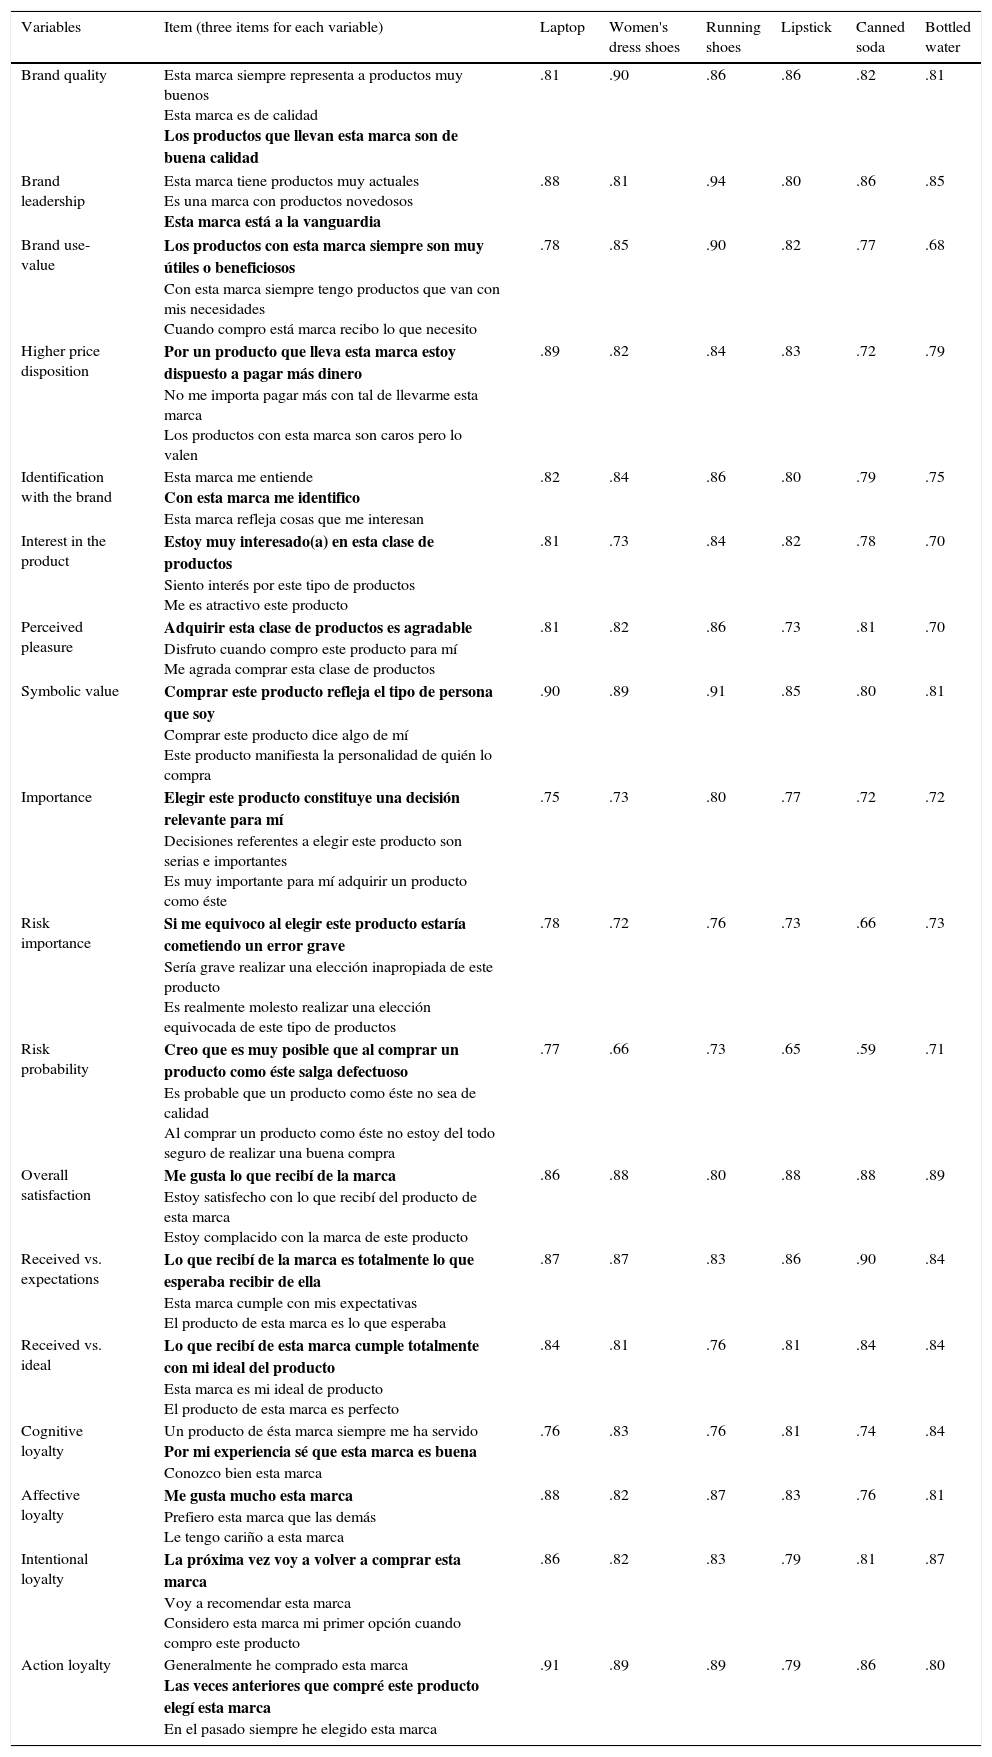
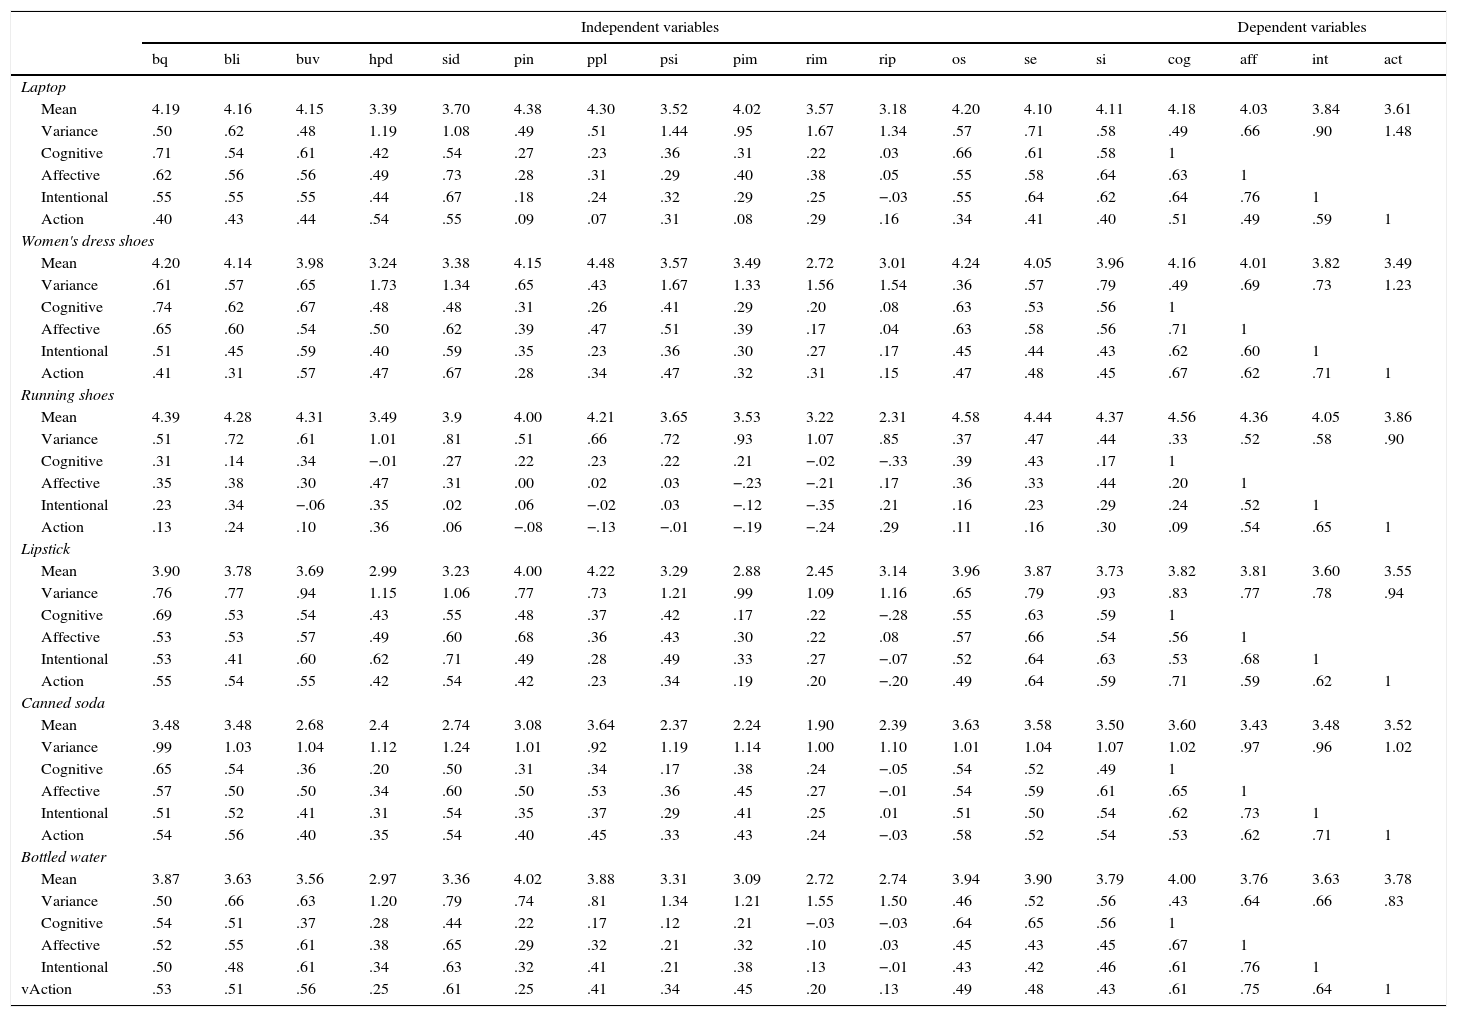
A questionnaire was designed that included the items for the four groups of variables. Given that variable measurement contemplated six product categories, multi-category scales were necessary. The survey consisted of items posed in a generic manner alluding to “the product.” At the beginning of the questionnaire, the product's category was indicated. Buil, Martínez, and de Chernatony (2013) conducted a study using a similar methodology to evaluate the influences of brand equity on consumer responses. They used six different questionnaires, one for each brand; each respondent needed to be aware of the questionnaire's brand. Five-point attitudinal scales were used with the options: totally agree, agree, neutral, disagree, and totally disagree. Consumer involvement items were located at the beginning of the questionnaire. The survey asked the respondent to name the brand of the product, and then presented the rest of the items (for brand value, for satisfaction toward the purchased product's brand, and for loyalty). There were three items for each variable. Measurement reliability coefficients are shown in Appendix 1 (Cronbach's alphas). Cronbach's alphas is a highly trustworthy internal consistency reliability test when it is used attitudinal scales in a multi-item measurement for a single dimension (Gliem & Gliem, 2003), as in this case. As shown in Appendix 1, all the obtained alpha coefficients can be considered between acceptable and good (Darren & Mallery, 2003, p. 231; Gliem & Gliem, 2003). Only the item that best represented the collinearity of each trio was used in the data analysis. Items declarations are shown in Table 1. To select the best item from each trio, correlation coefficients were estimated between the three items, and those that showed the highest correlations were chosen. Appendix 2 shows means, variances, and correlations with loyalty measurements of these items.
Items declarations for variables used in data analyses.
| Scale | Variable | Item declaration (translations) |
|---|---|---|
| Brand value | Brand quality | The products with this brand are of good quality |
| Brand leadership | This brand is at the forefront | |
| Brand use-value | Products of this brand are always very useful | |
| Higher price disposition | For a product within this brand I would pay more money | |
| Self-identification | I identify myself with this brand | |
| Involvement | Product interest | I am very interested in this kind of product |
| Perceived pleasure | Acquiring this type of product is enjoyable | |
| Product symbolism | Purchasing this product reflects the kind of person I am | |
| Product importance | Choosing this kind of product is a relevant decision to me | |
| Risk importance | Making a mistake buying this product would be serious | |
| Risk probability | If I buy a product like this, it is highly likely it would be defective | |
| Satisfaction | Overall satisfaction | I like what I had received from this brand |
| Against expectation | What I got from this brand is absolutely what I expected | |
| Against ideal | What I received from this brand is totally my ideal product | |
| Loyalty | Cognitive loyalty | In my experience I know this brand works well |
| Affective loyalty | I like this brand very much | |
| Intentional loyalty | Next time I am going to buy this brand again | |
| Action loyalty | In previous occasions that I had bought this product I had chosen this brand |
To participate in the study, four restrictions were established. The respondents had to be between the ages of 18 and 35 years old and within the middle to upper-middle class economic range. This consumer profile was chosen to ensure that each of the respondents could be a regular consumer of each of the selected product categories and to ensure some variability control over the sample. Furthermore, the participants should have recently acquired one of the product categories evaluated, and they had to remember the brand name and the general purchase decision situation. Laptops had to be acquired within a year, running shoes and women's dress shoes within six months or less, lipstick within a month, and canned soda or bottled water had to have been purchased no earlier than the previous day. For variable control, additional requirements of the participants were: to belong to a household with one to three cars; to have at least one credit card at home; and finally, to have traveled abroad no more than once during the previous year. These characteristics are consistent with the middle and upper middle class economic levels established for this study (López, 2009, 2011). The questionnaires were answered only by Mexican citizens who live in Mexico City. A convenience sampling method was implemented in shopping malls at consumer flow points. The sample was balanced by age and gender, except in the women's product categories where only the age factor applied. The numbers of respondents per product category were: laptop n=153; women's dress shoes n=81; running shoes n=99; lipstick n=83; canned soda 355ml n=143; and bottled water 600ml n=90 for a total of n=649 participants.
For data analysis a selection procedure was used to detect which of the independent variables were statistically significant to each of the dependent variables. For each product category, four regression models were obtained, one for each loyalty measurement. To obtain each regression model, all the independent variables (involvement, brand value, and satisfaction) were used. For each of the dependent variables (loyalty measurements), significant independent variables were gradually identified. To determine if each independent variable was statistically significant, the t test coefficient was observed. Coefficients had to achieve a p value of 0.05 or less. These processes were repeated until only significant independent variables were left. For the final model to be accepted, the constant had to be significant. Stepwise regression was not used, due to anomalies commonly related to this technique; instead subgroup selection of variables could be more useful and precise using biased estimation to select subsets (Hoerl, Schuenemeyer, & Hoerl, 1986; Roecker, 1991). Hence the procedures used were case-by-case regressions, seeking individually statistical significant variables and grouping them gradually in multiple regression models. For example, with the current data, stepwise regression did not always achieve final models with significant constants.
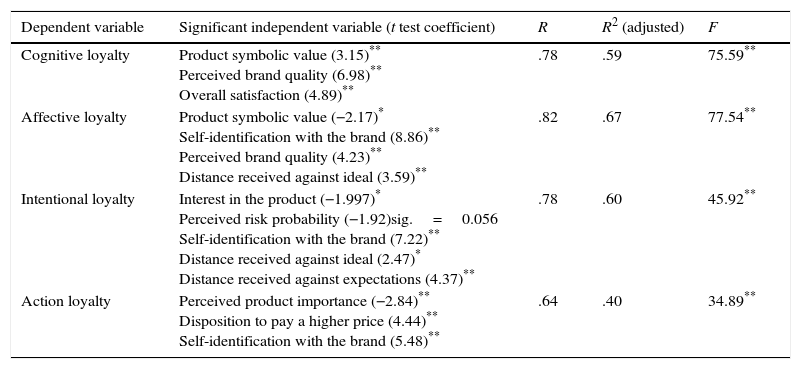
Results and discussionLaptopRegarding laptops, Table 2 shows that a lower level of determination than what is common was achieved for cognitive loyalty than for both affective and intentional loyalties. Oliver's (1999) theory suggests that cognitive loyalty should be at least equal to affective loyalty. Furthermore, from the large number of possible independent variables, only a relatively few remained at the end of the selection process. This is consistent with the results of the other product categories. Concerning the involvement variables, most coefficients were negative, implying an inverse relationship to loyalty, which contradicts with what the hypothesis (H2) proposed. The highest positive coefficients were obtained from perceived brand value variables, implying that it (perceived brand value) is a strong antecedent to brand loyalty measurements.
Laptop. Regression analyses.
| Dependent variable | Significant independent variable (t test coefficient) | R | R2 (adjusted) | F |
|---|---|---|---|---|
| Cognitive loyalty | Product symbolic value (3.15)** Perceived brand quality (6.98)** Overall satisfaction (4.89)** | .78 | .59 | 75.59** |
| Affective loyalty | Product symbolic value (−2.17)* Self-identification with the brand (8.86)** Perceived brand quality (4.23)** Distance received against ideal (3.59)** | .82 | .67 | 77.54** |
| Intentional loyalty | Interest in the product (−1.997)* Perceived risk probability (−1.92)sig.=0.056 Self-identification with the brand (7.22)** Distance received against ideal (2.47)* Distance received against expectations (4.37)** | .78 | .60 | 45.92** |
| Action loyalty | Perceived product importance (−2.84)** Disposition to pay a higher price (4.44)** Self-identification with the brand (5.48)** | .64 | .40 | 34.89** |
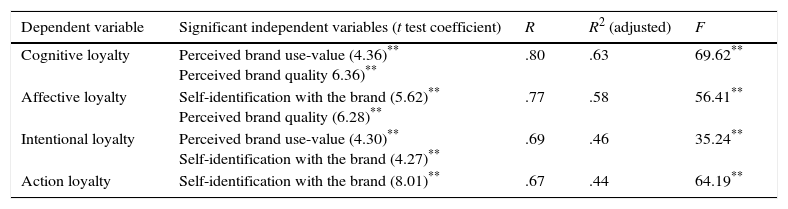
For women's dress shoes, Table 3 shows that only the brand value variables achieved significant coefficients. No involvement or satisfaction variables surfaced. Consistent with Oliver's (1999) theory about the stages of loyalty—from cognitive loyalty to action loyalty—the degree of determination for each of the dependent variables decreases.
Women's dress shoes. Regression analyses.
| Dependent variable | Significant independent variables (t test coefficient) | R | R2 (adjusted) | F |
|---|---|---|---|---|
| Cognitive loyalty | Perceived brand use-value (4.36)** Perceived brand quality 6.36)** | .80 | .63 | 69.62** |
| Affective loyalty | Self-identification with the brand (5.62)** Perceived brand quality (6.28)** | .77 | .58 | 56.41** |
| Intentional loyalty | Perceived brand use-value (4.30)** Self-identification with the brand (4.27)** | .69 | .46 | 35.24** |
| Action loyalty | Self-identification with the brand (8.01)** | .67 | .44 | 64.19** |
n=81.
*Significance at 0.05.
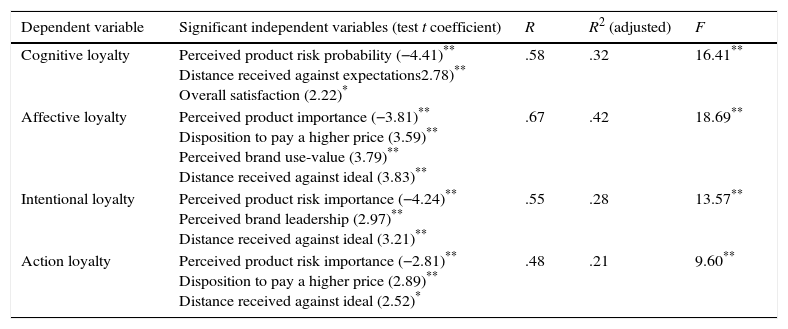
It is interesting to note in Table 4 that lower determination coefficients were obtained for the running shoes category than for those in the two previous categories (laptop and women's dress shoes). Three out of the four loyalty variables (affective, intentional, and action) related significantly to the perceived product importance (I) as well as the distance between received and ideal.
Running shoes. Regression analyses.
| Dependent variable | Significant independent variables (test t coefficient) | R | R2 (adjusted) | F |
|---|---|---|---|---|
| Cognitive loyalty | Perceived product risk probability (−4.41)** Distance received against expectations2.78)** Overall satisfaction (2.22)* | .58 | .32 | 16.41** |
| Affective loyalty | Perceived product importance (−3.81)** Disposition to pay a higher price (3.59)** Perceived brand use-value (3.79)** Distance received against ideal (3.83)** | .67 | .42 | 18.69** |
| Intentional loyalty | Perceived product risk importance (−4.24)** Perceived brand leadership (2.97)** Distance received against ideal (3.21)** | .55 | .28 | 13.57** |
| Action loyalty | Perceived product risk importance (−2.81)** Disposition to pay a higher price (2.89)** Distance received against ideal (2.52)* | .48 | .21 | 9.60** |
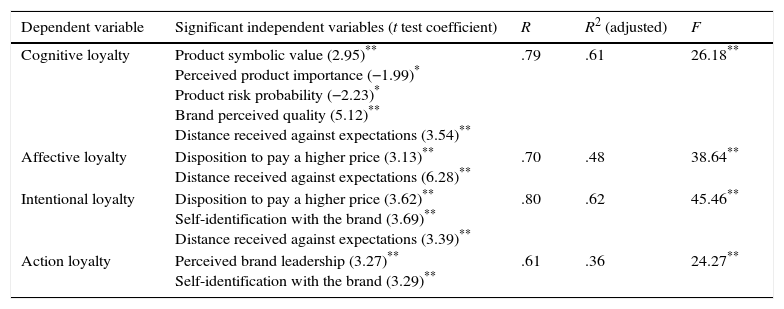
In Table 5 it is noteworthy that in the lipstick product category the majority of the significant independent variables were related to the perceived brand value measurements.
Lipstick. Regression analyses.
| Dependent variable | Significant independent variables (t test coefficient) | R | R2 (adjusted) | F |
|---|---|---|---|---|
| Cognitive loyalty | Product symbolic value (2.95)** Perceived product importance (−1.99)* Product risk probability (−2.23)* Brand perceived quality (5.12)** Distance received against expectations (3.54)** | .79 | .61 | 26.18** |
| Affective loyalty | Disposition to pay a higher price (3.13)** Distance received against expectations (6.28)** | .70 | .48 | 38.64** |
| Intentional loyalty | Disposition to pay a higher price (3.62)** Self-identification with the brand (3.69)** Distance received against expectations (3.39)** | .80 | .62 | 45.46** |
| Action loyalty | Perceived brand leadership (3.27)** Self-identification with the brand (3.29)** | .61 | .36 | 24.27** |
n=83.
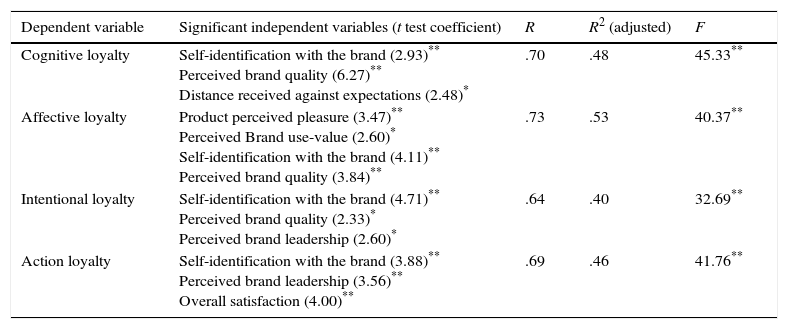
It is noteworthy in Table 6 that in the canned soda category no significant variables related to the consumer involvement measurements were obtained. Perceived brand value variables were predominant.
Canned soda 355ml. Regression analyses.
| Dependent variable | Significant independent variables (t test coefficient) | R | R2 (adjusted) | F |
|---|---|---|---|---|
| Cognitive loyalty | Self-identification with the brand (2.93)** Perceived brand quality (6.27)** Distance received against expectations (2.48)* | .70 | .48 | 45.33** |
| Affective loyalty | Product perceived pleasure (3.47)** Perceived Brand use-value (2.60)* Self-identification with the brand (4.11)** Perceived brand quality (3.84)** | .73 | .53 | 40.37** |
| Intentional loyalty | Self-identification with the brand (4.71)** Perceived brand quality (2.33)* Perceived brand leadership (2.60)* | .64 | .40 | 32.69** |
| Action loyalty | Self-identification with the brand (3.88)** Perceived brand leadership (3.56)** Overall satisfaction (4.00)** | .69 | .46 | 41.76** |
Contrary to expectations, the cognitive loyalty determination coefficient was lower than the determination coefficients of the other measurements of loyalty. According to Oliver's theory (1999), higher degrees of explanation should be expected for cognitive and affective loyalties than those for intentional and action loyalties.
In intentional loyalty is interesting to note that out of the four independent significant variables, two belong to involvement (product symbolic value, showing a negative coefficient, and perceived product importance). In other product categories the pattern is that only a few involvement variables tended to be significant.
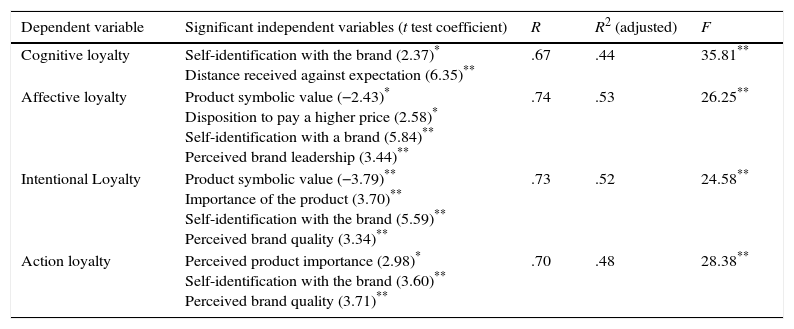
As shown in Table 7, for bottled water self-identification with the brand turned out to be significant for the four types of loyalty. Compared to other product categories evaluated here, there is a larger participation of involvement variables compared to satisfaction variables. The perceived brand value dimension contributed with the largest amount of independent variables to explain loyalty measurements
Bottled water 600ml. Regression analyses.
| Dependent variable | Significant independent variables (t test coefficient) | R | R2 (adjusted) | F |
|---|---|---|---|---|
| Cognitive loyalty | Self-identification with the brand (2.37)* Distance received against expectation (6.35)** | .67 | .44 | 35.81** |
| Affective loyalty | Product symbolic value (−2.43)* Disposition to pay a higher price (2.58)* Self-identification with a brand (5.84)** Perceived brand leadership (3.44)** | .74 | .53 | 26.25** |
| Intentional Loyalty | Product symbolic value (−3.79)** Importance of the product (3.70)** Self-identification with the brand (5.59)** Perceived brand quality (3.34)** | .73 | .52 | 24.58** |
| Action loyalty | Perceived product importance (2.98)* Self-identification with the brand (3.60)** Perceived brand quality (3.71)** | .70 | .48 | 28.38** |
n=90.
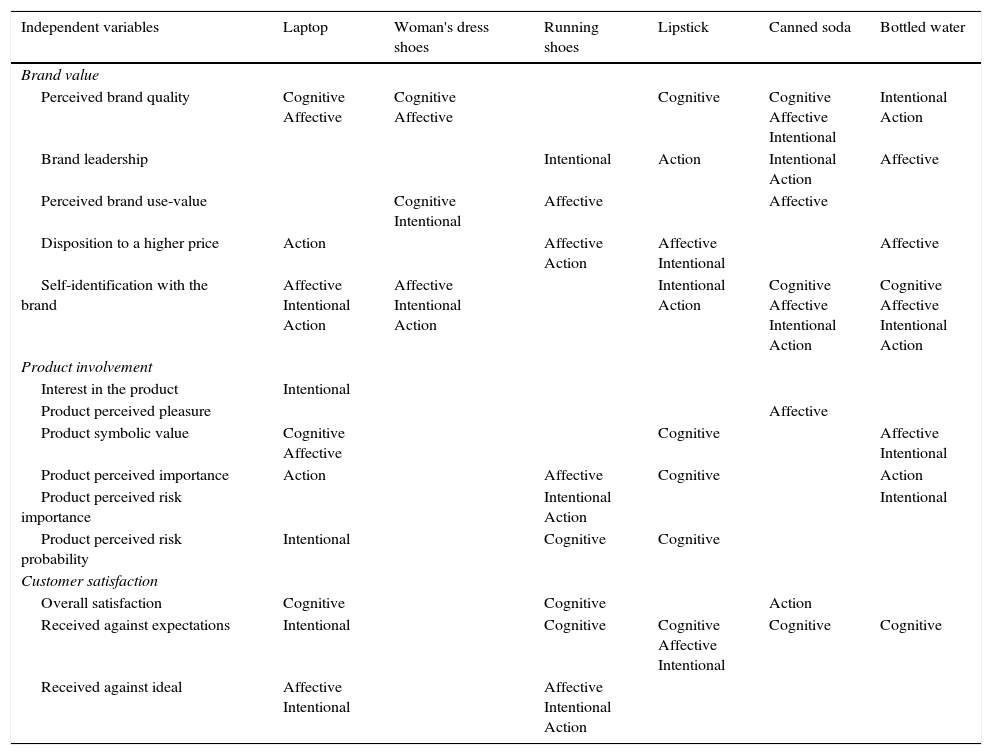
As this article was titled “an exploratory study”, it aims to test, without any kind of predisposition, different variables to seek which ones can have a greater effect on loyalty measurements in different product categories while trying to find if there is any regularity across the different product categories concerning a common group of explanatory variables. As pointed out in Table 8, the brand value variables tended to relate more consistently with the four types of loyalty throughout all product categories in comparison with the other two groups of independent variables (involvement and satisfaction). The customer satisfaction variables were also significant in most of the products, though not with the incidence and weight of the perceived brand value measurements. These conclusions are consistent with correlations shown in Appendix 2.
Independent variables related to loyalty measurements by product categories. In each cell, it can be noted which type of loyalty is explained by each independent variable within each product category.
| Independent variables | Laptop | Woman's dress shoes | Running shoes | Lipstick | Canned soda | Bottled water |
|---|---|---|---|---|---|---|
| Brand value | ||||||
| Perceived brand quality | Cognitive Affective | Cognitive Affective | Cognitive | Cognitive Affective Intentional | Intentional Action | |
| Brand leadership | Intentional | Action | Intentional Action | Affective | ||
| Perceived brand use-value | Cognitive Intentional | Affective | Affective | |||
| Disposition to a higher price | Action | Affective Action | Affective Intentional | Affective | ||
| Self-identification with the brand | Affective Intentional Action | Affective Intentional Action | Intentional Action | Cognitive Affective Intentional Action | Cognitive Affective Intentional Action | |
| Product involvement | ||||||
| Interest in the product | Intentional | |||||
| Product perceived pleasure | Affective | |||||
| Product symbolic value | Cognitive Affective | Cognitive | Affective Intentional | |||
| Product perceived importance | Action | Affective | Cognitive | Action | ||
| Product perceived risk importance | Intentional Action | Intentional | ||||
| Product perceived risk probability | Intentional | Cognitive | Cognitive | |||
| Customer satisfaction | ||||||
| Overall satisfaction | Cognitive | Cognitive | Action | |||
| Received against expectations | Intentional | Cognitive | Cognitive Affective Intentional | Cognitive | Cognitive | |
| Received against ideal | Affective Intentional | Affective Intentional Action | ||||
An inconsistency with the hypothesis (H2) was found in which consumer involvement measurements presented an unexpected behavior. In only a few cases they surfaced as independent significant variables, and in most of these the coefficients were negative, which is consistent with what was found by Quester et al. (2003). This could indicate a slightly inverse relationship between consumer involvement components and brand loyalty indicators. Perhaps in the degree that a product implies more involvement, the customer becomes more demanding toward the brand thereby challenging the loyalty toward it. Nevertheless, the involvement variable that had significant effect on loyalty measurements along a higher number of product categories was product importance. The other two hypotheses (H1 and H3) are supported by the results: the correlation coefficients presented in Appendix 2 tend to confirm that the brand value measurements, as the satisfaction measurements, have positive statistical relationships with the loyalty measurements; the regression models shown through Tables 2–7 also tend to confirm this.
Self-identification with the brand (self-congruence) stood out as the independent variable with the largest presence in most product category regression models. It also had incidence in the majority of loyalty measurements. The self-identification measurements used here are very consistent with the notion of “actual self-congruence” with the brand's personality. As observed in the results of the current study, previous evidence suggests that self-congruence is a stronger antecedent to emotional brand attachment than other explanatory variables (Malär, Krohmer, Hoyer, & Nyffenegger, 2011). The self-identification variable having a consistently effect on cognitive and affective loyalty measurements, suggests an emotional connection. Accordingly, affective commitment has been found as an important mediator between customer brand experience and actual loyalty (Iglesias, Singh, & Batista-Foguet, 2011).
Another independent variable with an important incidence was perceived brand quality. Except for running shoes, this variable was present as significant in most loyalty regression models in all the other product categories. This is consistent with preceding literature in which brand quality is assessed as an antecedent for expected outcomes as perceived value (Chen & Myagmarsuren, 2011; Cronin et al., 2000; Ulaga & Chacour, 2001).
In almost all product categories, a similar behavior was observed for the independent variables that showed an effect on loyalty measurements. This was not the case in the running shoes category where a different tendency emerged: perceived quality and self-identification with the brand were not significant to explain brand loyalty measurements. In this category, brand value variables had the lowest incidence presenting an equilibrium with the other two groups of independent variables (involvement and satisfaction).
Another result worth mentioning, because of a certain contradictory behavior compared to the previous one (running shoes), was in the women's dress shoes category. Here, all independent significant variables were from the group of perceived brand value measurements. Here, no significant variable of satisfaction or involvement emerged.
Concerning the satisfaction group of variables, “received versus customer expectation” had a greater effect on a larger number of product categories as well as in a larger number of loyalty measurements. This variable had a significant effect on loyalty measurements in five out of six product categories.
To summarize, along product categories, out of all the independent variables in this study, those that had a higher impact on loyalty measurements were three: self-identification with the brand, perceived brand quality, and received against client expectations. It is noteworthy that self-identification and quality had a greater effect over variables as use-value, product importance and satisfaction, suggesting an important role these two variables could play in future studies.
Another contribution of the present study is the proposal to collectively measure all the variables involved. As a result, it attempts to provide a more well-rounded assessment of loyalty. As observed, a single model cannot be offered. In its place, the specific set of independent variables should be identified in each product category. So it would be recommendable to develop further research among several categories of the same level of involvement to contrast the findings of this study in order to find a possible consistent model throughout product categories.
Furthermore, the variable relationship approach taken in this study does not allow to support an integrated theoretical model. Therefore, a future study with a structural multi-construct approach to test the relevance of self-identification and perceived quality as key loyalty antecedents is desirable.
Another limitation of the present study is how action loyalty was measured. The respondents were asked to give their perceptions about their past purchase frequency behavior toward the brand. This was due to the different nature of product categories selected for present study; their actual repurchase rates would not be commensurable. To be more meticulous, however, the actual repurchase rate of the brand should be measured.
Managerial implicationsAs discussed above, the variables related to brand value have a higher incidence of loyalty variables in all product categories. So, it is recommended that companies should not forget that a strong brand is not just about having a name and an attractive design. Behind the name and the design there must be a solid and differentiated product and a consolidated corporate identity. Some of the suggested actions to build or maintain a strong brand are: be aware of the changing needs of the consumer, conduct market research constantly to know buying trends and consumers’ values, tastes and key drivers; to monitor periodically the strengths and weaknesses of competitors’ brands; and finally to develop a constant self-analysis of their branding program in order to verify that the brand and overall business strategy are aligned.
The present work suggests that the mix of variables that have an effect on brand loyalty measurements varies noticeably from one product category to another. From a marketer standpoint it is important to understand that if brand perceived value is going to play an important role, it should be recognized that, depending on each product category, other elements can be very influential. Business managers who handle another product category are urged to replicate this study, making changes specifically for their category.
Based on the results from the categories that were analyzed, only the women's dress shoes category depended almost exclusively on the perceived brand value variables. This is understandable, as this kind of product is often chosen based on hedonistic reasons rather than functional ones.
Given the results for laptops, it may be inferred that for technological products, loyalty may depend on a more complex mix of elements due to the impact of consumer involvement and satisfaction variables. Therefore, for technological product categories, a communication strategy that is more related with the consumer involvement aspects of the products would be recommendable. For example, an advertising campaign could be designed to arouse interest in the product by emphasizing its symbolic value. In the results for laptops, intentional loyalty can be observed as having to do with the probability that the purchase would be risky. Therefore, communication content should include elements that are conceived to reduce the perceived risk. To increase satisfaction, the suggestion is to generate customer feedback mechanisms in order to obtain post-purchase information. In this sense a company could keep up with the customers’ expectations, thereby being able to orient the strategies to meet them.
As shown in Table 8, the high involvement products (laptops and women's dress shoes) have a greater number of variables affecting the intentional loyalty, so a recommendation for managers is to design loyalty programs (reward programs) that encourage their customers’ subsequent repurchases. In the middle involvement products (running shoes and lipstick), cognitive loyalty is the one with more recurrence (see Table 8), so a possible course of action for marketers is to develop communication based on benefits and to offer a guarantee as well. In low involvement products, as affective loyalty is the one with more occurrence (see Table 8), staying connected to the client on an emotional level using communication tactics such as storytelling can be recommended.
In marketing applications, the final objective is to achieve action loyalty (repurchasing). From a marketeer's perspective, the other phases of loyalty are merely elements to generate loyal actions by the customers. In other words, the development of strategies to achieve cognitive, affective, and intentional loyalty will pave the way for repurchasing. From the rational and emotional points of view, these strategies may sensitize the consumer to repurchase based on a high value perception. The results suggest that action loyalty is not only the most difficult to achieve, but it is also very difficult to statistically explain. In this study, self-identification with the brand is the one variable that showed a major effect on action loyalty. As previously noted, in five of the six product categories, this variable offered a significant degree explanation for the repurchase variable. In marketing application this could be an important element for strategic brand management as well as for shaping marketing mix tactics. In this way the customer can identify with the offer that is being made. Therefore, encouraging consumers’ self-identification with the brand should be considered a more important brand management strategy than it has been in the past.
| Variables | Item (three items for each variable) | Laptop | Women's dress shoes | Running shoes | Lipstick | Canned soda | Bottled water |
|---|---|---|---|---|---|---|---|
| Brand quality | Esta marca siempre representa a productos muy buenos Esta marca es de calidad Los productos que llevan esta marca son de buena calidad | .81 | .90 | .86 | .86 | .82 | .81 |
| Brand leadership | Esta marca tiene productos muy actuales Es una marca con productos novedosos Esta marca está a la vanguardia | .88 | .81 | .94 | .80 | .86 | .85 |
| Brand use-value | Los productos con esta marca siempre son muy útiles o beneficiosos Con esta marca siempre tengo productos que van con mis necesidades Cuando compro está marca recibo lo que necesito | .78 | .85 | .90 | .82 | .77 | .68 |
| Higher price disposition | Por un producto que lleva esta marca estoy dispuesto a pagar más dinero No me importa pagar más con tal de llevarme esta marca Los productos con esta marca son caros pero lo valen | .89 | .82 | .84 | .83 | .72 | .79 |
| Identification with the brand | Esta marca me entiende Con esta marca me identifico Esta marca refleja cosas que me interesan | .82 | .84 | .86 | .80 | .79 | .75 |
| Interest in the product | Estoy muy interesado(a) en esta clase de productos Siento interés por este tipo de productos Me es atractivo este producto | .81 | .73 | .84 | .82 | .78 | .70 |
| Perceived pleasure | Adquirir esta clase de productos es agradable Disfruto cuando compro este producto para mí Me agrada comprar esta clase de productos | .81 | .82 | .86 | .73 | .81 | .70 |
| Symbolic value | Comprar este producto refleja el tipo de persona que soy Comprar este producto dice algo de mí Este producto manifiesta la personalidad de quién lo compra | .90 | .89 | .91 | .85 | .80 | .81 |
| Importance | Elegir este producto constituye una decisión relevante para mí Decisiones referentes a elegir este producto son serias e importantes Es muy importante para mí adquirir un producto como éste | .75 | .73 | .80 | .77 | .72 | .72 |
| Risk importance | Si me equivoco al elegir este producto estaría cometiendo un error grave Sería grave realizar una elección inapropiada de este producto Es realmente molesto realizar una elección equivocada de este tipo de productos | .78 | .72 | .76 | .73 | .66 | .73 |
| Risk probability | Creo que es muy posible que al comprar un producto como éste salga defectuoso Es probable que un producto como éste no sea de calidad Al comprar un producto como éste no estoy del todo seguro de realizar una buena compra | .77 | .66 | .73 | .65 | .59 | .71 |
| Overall satisfaction | Me gusta lo que recibí de la marca Estoy satisfecho con lo que recibí del producto de esta marca Estoy complacido con la marca de este producto | .86 | .88 | .80 | .88 | .88 | .89 |
| Received vs. expectations | Lo que recibí de la marca es totalmente lo que esperaba recibir de ella Esta marca cumple con mis expectativas El producto de esta marca es lo que esperaba | .87 | .87 | .83 | .86 | .90 | .84 |
| Received vs. ideal | Lo que recibí de esta marca cumple totalmente con mi ideal del producto Esta marca es mi ideal de producto El producto de esta marca es perfecto | .84 | .81 | .76 | .81 | .84 | .84 |
| Cognitive loyalty | Un producto de ésta marca siempre me ha servido Por mi experiencia sé que esta marca es buena Conozco bien esta marca | .76 | .83 | .76 | .81 | .74 | .84 |
| Affective loyalty | Me gusta mucho esta marca Prefiero esta marca que las demás Le tengo cariño a esta marca | .88 | .82 | .87 | .83 | .76 | .81 |
| Intentional loyalty | La próxima vez voy a volver a comprar esta marca Voy a recomendar esta marca Considero esta marca mi primer opción cuando compro este producto | .86 | .82 | .83 | .79 | .81 | .87 |
| Action loyalty | Generalmente he comprado esta marca Las veces anteriores que compré este producto elegí esta marca En el pasado siempre he elegido esta marca | .91 | .89 | .89 | .79 | .86 | .80 |
Note 1: Items are showed in Spanish as they were used in the questionnaire.
Note 2: In boldface are the items for each variable that were selected for the regression analyses.
| Independent variables | Dependent variables | |||||||||||||||||
|---|---|---|---|---|---|---|---|---|---|---|---|---|---|---|---|---|---|---|
| bq | bli | buv | hpd | sid | pin | ppl | psi | pim | rim | rip | os | se | si | cog | aff | int | act | |
| Laptop | ||||||||||||||||||
| Mean | 4.19 | 4.16 | 4.15 | 3.39 | 3.70 | 4.38 | 4.30 | 3.52 | 4.02 | 3.57 | 3.18 | 4.20 | 4.10 | 4.11 | 4.18 | 4.03 | 3.84 | 3.61 |
| Variance | .50 | .62 | .48 | 1.19 | 1.08 | .49 | .51 | 1.44 | .95 | 1.67 | 1.34 | .57 | .71 | .58 | .49 | .66 | .90 | 1.48 |
| Cognitive | .71 | .54 | .61 | .42 | .54 | .27 | .23 | .36 | .31 | .22 | .03 | .66 | .61 | .58 | 1 | |||
| Affective | .62 | .56 | .56 | .49 | .73 | .28 | .31 | .29 | .40 | .38 | .05 | .55 | .58 | .64 | .63 | 1 | ||
| Intentional | .55 | .55 | .55 | .44 | .67 | .18 | .24 | .32 | .29 | .25 | −.03 | .55 | .64 | .62 | .64 | .76 | 1 | |
| Action | .40 | .43 | .44 | .54 | .55 | .09 | .07 | .31 | .08 | .29 | .16 | .34 | .41 | .40 | .51 | .49 | .59 | 1 |
| Women's dress shoes | ||||||||||||||||||
| Mean | 4.20 | 4.14 | 3.98 | 3.24 | 3.38 | 4.15 | 4.48 | 3.57 | 3.49 | 2.72 | 3.01 | 4.24 | 4.05 | 3.96 | 4.16 | 4.01 | 3.82 | 3.49 |
| Variance | .61 | .57 | .65 | 1.73 | 1.34 | .65 | .43 | 1.67 | 1.33 | 1.56 | 1.54 | .36 | .57 | .79 | .49 | .69 | .73 | 1.23 |
| Cognitive | .74 | .62 | .67 | .48 | .48 | .31 | .26 | .41 | .29 | .20 | .08 | .63 | .53 | .56 | 1 | |||
| Affective | .65 | .60 | .54 | .50 | .62 | .39 | .47 | .51 | .39 | .17 | .04 | .63 | .58 | .56 | .71 | 1 | ||
| Intentional | .51 | .45 | .59 | .40 | .59 | .35 | .23 | .36 | .30 | .27 | .17 | .45 | .44 | .43 | .62 | .60 | 1 | |
| Action | .41 | .31 | .57 | .47 | .67 | .28 | .34 | .47 | .32 | .31 | .15 | .47 | .48 | .45 | .67 | .62 | .71 | 1 |
| Running shoes | ||||||||||||||||||
| Mean | 4.39 | 4.28 | 4.31 | 3.49 | 3.9 | 4.00 | 4.21 | 3.65 | 3.53 | 3.22 | 2.31 | 4.58 | 4.44 | 4.37 | 4.56 | 4.36 | 4.05 | 3.86 |
| Variance | .51 | .72 | .61 | 1.01 | .81 | .51 | .66 | .72 | .93 | 1.07 | .85 | .37 | .47 | .44 | .33 | .52 | .58 | .90 |
| Cognitive | .31 | .14 | .34 | −.01 | .27 | .22 | .23 | .22 | .21 | −.02 | −.33 | .39 | .43 | .17 | 1 | |||
| Affective | .35 | .38 | .30 | .47 | .31 | .00 | .02 | .03 | −.23 | −.21 | .17 | .36 | .33 | .44 | .20 | 1 | ||
| Intentional | .23 | .34 | −.06 | .35 | .02 | .06 | −.02 | .03 | −.12 | −.35 | .21 | .16 | .23 | .29 | .24 | .52 | 1 | |
| Action | .13 | .24 | .10 | .36 | .06 | −.08 | −.13 | −.01 | −.19 | −.24 | .29 | .11 | .16 | .30 | .09 | .54 | .65 | 1 |
| Lipstick | ||||||||||||||||||
| Mean | 3.90 | 3.78 | 3.69 | 2.99 | 3.23 | 4.00 | 4.22 | 3.29 | 2.88 | 2.45 | 3.14 | 3.96 | 3.87 | 3.73 | 3.82 | 3.81 | 3.60 | 3.55 |
| Variance | .76 | .77 | .94 | 1.15 | 1.06 | .77 | .73 | 1.21 | .99 | 1.09 | 1.16 | .65 | .79 | .93 | .83 | .77 | .78 | .94 |
| Cognitive | .69 | .53 | .54 | .43 | .55 | .48 | .37 | .42 | .17 | .22 | −.28 | .55 | .63 | .59 | 1 | |||
| Affective | .53 | .53 | .57 | .49 | .60 | .68 | .36 | .43 | .30 | .22 | .08 | .57 | .66 | .54 | .56 | 1 | ||
| Intentional | .53 | .41 | .60 | .62 | .71 | .49 | .28 | .49 | .33 | .27 | −.07 | .52 | .64 | .63 | .53 | .68 | 1 | |
| Action | .55 | .54 | .55 | .42 | .54 | .42 | .23 | .34 | .19 | .20 | −.20 | .49 | .64 | .59 | .71 | .59 | .62 | 1 |
| Canned soda | ||||||||||||||||||
| Mean | 3.48 | 3.48 | 2.68 | 2.4 | 2.74 | 3.08 | 3.64 | 2.37 | 2.24 | 1.90 | 2.39 | 3.63 | 3.58 | 3.50 | 3.60 | 3.43 | 3.48 | 3.52 |
| Variance | .99 | 1.03 | 1.04 | 1.12 | 1.24 | 1.01 | .92 | 1.19 | 1.14 | 1.00 | 1.10 | 1.01 | 1.04 | 1.07 | 1.02 | .97 | .96 | 1.02 |
| Cognitive | .65 | .54 | .36 | .20 | .50 | .31 | .34 | .17 | .38 | .24 | −.05 | .54 | .52 | .49 | 1 | |||
| Affective | .57 | .50 | .50 | .34 | .60 | .50 | .53 | .36 | .45 | .27 | −.01 | .54 | .59 | .61 | .65 | 1 | ||
| Intentional | .51 | .52 | .41 | .31 | .54 | .35 | .37 | .29 | .41 | .25 | .01 | .51 | .50 | .54 | .62 | .73 | 1 | |
| Action | .54 | .56 | .40 | .35 | .54 | .40 | .45 | .33 | .43 | .24 | −.03 | .58 | .52 | .54 | .53 | .62 | .71 | 1 |
| Bottled water | ||||||||||||||||||
| Mean | 3.87 | 3.63 | 3.56 | 2.97 | 3.36 | 4.02 | 3.88 | 3.31 | 3.09 | 2.72 | 2.74 | 3.94 | 3.90 | 3.79 | 4.00 | 3.76 | 3.63 | 3.78 |
| Variance | .50 | .66 | .63 | 1.20 | .79 | .74 | .81 | 1.34 | 1.21 | 1.55 | 1.50 | .46 | .52 | .56 | .43 | .64 | .66 | .83 |
| Cognitive | .54 | .51 | .37 | .28 | .44 | .22 | .17 | .12 | .21 | −.03 | −.03 | .64 | .65 | .56 | 1 | |||
| Affective | .52 | .55 | .61 | .38 | .65 | .29 | .32 | .21 | .32 | .10 | .03 | .45 | .43 | .45 | .67 | 1 | ||
| Intentional | .50 | .48 | .61 | .34 | .63 | .32 | .41 | .21 | .38 | .13 | −.01 | .43 | .42 | .46 | .61 | .76 | 1 | |
| vAction | .53 | .51 | .56 | .25 | .61 | .25 | .41 | .34 | .45 | .20 | .13 | .49 | .48 | .43 | .61 | .75 | .64 | 1 |
Correlations 0.21–0.29 are significant at a .05 p value. Correlations above 0.31 are significant at a .01 p value. Brand quality (bq), brand leadership (bli), brand use-value (buv), higher price disposition (hpd), self-identification (sid), product interest (pin), product pleasure (ppl), product symbolism (psi), product importance (pim), product risk importance (rim), product risk probability (rip), overall satisfaction (os), satisfaction vs. expectation (se), satisfaction vs. ideal (si), cognitive loyalty (cog), affective loyalty (aff), intentional loyalty (int), action loyalty (act).
Peer Review under the responsibility of Universidad Nacional Autónoma de México.