


Financial inclusion is emerging as a new paradigm of economic growth that plays major role in driving away the poverty from the country. It refers to delivery of banking services to masses including privileged and disadvantaged people at an affordable terms and conditions. Financial inclusion is important priority of the country in terms of economic growth and advanceness of society. It enables to reduce the gap between rich and poor population. In the current scenario financial institutions are the robust pillars of progress, economic growth and development of the economy. The present study aims to examine the impact of financial inclusion on growth of the economy over a period of seven years. Secondary data is used which has been analyzed by multiple regression model as a main statistical tool. Results of the study found positive and significant impact of number of bank branch and Credit deposit ratio on GDP of the country, whereas an insignificant impact has been observed in case of ATMs growth on Indian GDP.
La inclusión financiera se está convirtiendo en un nuevo paradigma de crecimiento económico que desempeña un papel importante en la eliminación de la pobreza del país. Se refiere a la prestación de servicios bancarios a las masas, incluyendo los privilegiados y desfavorecidos en unas condiciones asequibles. La inclusión financiera es una prioridad importante del país en términos de crecimiento económico y avances de la sociedad. Permite reducir la brecha entre la población rica y la pobre. En el escenario actual las instituciones financieras son los sólidos pilares del progreso, el crecimiento económico y el desarrollo de la economía. El presente estudio tiene como objetivo examinar el impacto de la inclusión financiera en el crecimiento de la economía durante un período de 7 años. Se utilizan datos secundarios que han sido analizados por modelo de regresión múltiple como herramienta estadística principal. Los resultados del estudio encontraron un impacto positivo y significativo del número de sucursales bancarias y la proporción de depósitos de crédito sobre el PIB del país, mientras que se observó un impacto insignificante en el caso de los cajeros automáticos de crecimiento en el PIB de la India.
India is a country of 1.2 billion people, spread across 29 states and seven union territories. There are around 600,000 villages and 640 districts in our country. A vast majority of the population, especially in rural areas, is excluded from the easy access to finance (Gounasegaran, Kuriakose, & Iyer, 2013). Forty per cent of the households having bank accounts, but only 38 per cent of the 117,200 branches of scheduled commercial banks are working in rural areas. Accessibility of financial services at affordable and appropriate prices has been always a global issue. Hence, an inclusive financial system is required widely not only in India, but has become a policy priority in various countries. Financial access can surely improve the financial condition and living standard of the poor and the deprived section. So, RBI has been continuously stimulating the banking sector to extend the banking network both by setting up of new branches and installation of new ATMs (Dangi & Kumar, 2013). Financial inclusion means the delivery of financial services, including banking services and credit, at an affordable cost to the vast sections of disadvantaged and low-income groups who tend to be excluding (Chhabra, 2015). Financial inclusion takes into account the participation of vulnerable groups such as weaker sections of the society and low income groups, based on the extent of their access to financial services such as savings and payment account, credit insurance, pensions etc. (Singh et al., 2014).
The different financial services include access to savings, loans, insurance, payments and remittance facilities offered by the formal financial system. This aspect of financial inclusion is of vital importance in providing economic security to individuals and families (Kelkar, 2014). India is one country where the Financial Stability and Development Council (FSDC) have a specific mandate for financial inclusion and financial literacy. There is a separate Technical Group on Financial Inclusion and Financial Literacy under the aegis of FSDC with representation from all the financial sector regulators. In order to spearhead efforts towards greater financial inclusion, RBI has constituted a Financial Inclusion Advisory Committee (FIAC) under the Chairmanship of a Deputy Governor from RBI.
DefinitionFinancial Inclusion is defined as “the process of ensuring access to financial services and timely and adequate credit where needed by vulnerable groups such as weaker sections and low income groups at an affordable cost” (Rangarajan, 2008) in the report of the Committee on financial inclusion in India. During April 2012, World Bank carried out a study which revealed that only 9 per cent individuals’ avails new loans from banks in the previous year and 35 per cent population are having formal bank accounts in India whereas in the case of developing economies it is 41 per cent.
“Financial inclusion is the process of ensuring access to appropriate financial products and services needed by all sections of society including vulnerable groups such as weaker sections and low income groups at an affordable cost in a fair and transparent manner by mainstream institutional players” (Chakrabarty, 2013). The aim of Financial Inclusion (FI) is to make easy access of financial services to the large underprivileged population of the country. It is an attempt for achieving inclusive growth of the society by making availability of finance to the deprived section of population. In order to reap the benefits of the financial services, lot of measures has been taken by Government of India in the favour of poor and neglected section of the society.
Factors affecting access to financial servicesFinancial Inclusion, on the one hand, is a process aiming at providing banking services like saving account, credit facility, and insurance product to weaker sections of the society. While on the other hand, it refers to the objective of ensuring financial services (banking, insurance, and capital market services) and timely and adequate credit to every section of the society as well as of the economy. Access to financial services has been recognized as an important aspect of development and more emphasis is given to extending financial services to low-income households as the poor lack the education and knowledge needed to understand financial services that are available to them. The lack of financial access limits the range of services and credits for household and enterprises. Although there is some evidence that access is improving but still there are multiple factors which have affected the access to financial services.
Place of livingMost of commercial banks operate only in commercial areas and these banks set their branches in profitable areas. Hence population lives in rural areas find it difficult to access the financial services. Although effective distance is as much about transportation infrastructure as physical distance, factors like density of population, rural and remote areas, mobility of the population (i.e., highly mobile people with no fixed or formal address) etc. also affect access to these services.
Absence of legal identity and gender biasnessMinorities, economic and political migrants, refugee workers and women's are excluded from accessing financial services due to lack of legal identities such as original birth certificates and identity cards. It is generally difficult to access credit facilities for those females, who do not possess property and assets. They also needed male guarantee to access the credit from any financial institutions.
Limited knowledge of financial servicesIncomplete basic education and financial literacy are the major hurdles in order to access various financial services to the individuals. They do not Know the significance of different financial products i.e., bank accounts, cheque facility, bank loan or overdraft and insurance. If people having proper financial literacy, it boost up the use of many financial products by different economic agents like Business Correspondents, NGOs and MFIs and etc.
Level of income and bank chargesFinancial prominence of people is always plays a pivotal role in accessing available financial services. It is impossible for poor people to access financial services even when these services are made for lower income level group. Moreover in India, a lot of hidden bank charges which has been demotivated poor persons in availing these services.
Rigid terms and conditionsPeople are also least interested using such type of financial products or services which are attached with some inflexible terms and conditions. Many financial institutions having different rules relating with the use of accounts like minimum balance requirements.
Type of businessNature of occupation also an important factor in availing the financial services, whether it is small scale, large scale, organized and unorganized firm. Most of the banks do not preferred the small borrowers and unorganized enterprise for giving loans. Hence these loan applications tends to be rejected.
Review of literatureMany studies (Aghion & Bolton, 1997; Banerjee & Newman, 1993; Banerjee, 2001) discussed that access to finance has been seen as a critical factor in enabling people to transform their production, employment activities and to exit poverty. Researchers have been argued that the very fundamental activity of the banking sector, delivery of credit, are essential to boost any economic activity and enables the generation of capabilities (Sen, 2000). Dangi and Kumar (2013) examined the initiatives and policy measures taken by RBI and Government of India. This study also focused on current status and future prospects of financial inclusion in India. It has been concluded that financial inclusion shows progressive and valuable changes but sufficient provisions should be incorporate in the business model to certify that the poor are not driven away from banking. Suryanarayana (2008) focused on definition of inclusion/exclusion with reference to an outcome scenario for broad-based growth as reflected in estimates of production, income, and consumption distribution. The study helps in drawing a sketch of occupational, social, regional profiles of the excluded in the mainstream growth process. Hence researcher made an attempt to provide a perspective, a measure of inclusion, and finally an evaluation based on the available estimates of consumption distribution for the year 2004–2005 for India. Agrawal (2008) studied the financial inclusion from the behavioural perspective based on both factors supply and demand end. Results revealed that evaluation from the behavioural perspective provided the scope for the policy-makers and marketers to strategically align their approach with the behavioural aspect, without confining their thoughts to the economical evaluations.
On the other hand, in 2003, the RBI policy of financial inclusion was to provide access to financial service to the underprivileged could be earmarked as another bold initiative in serving the rural transects targeting inclusive growth. Committee on financial inclusion in 2008 (Rangarajan Committee) observed that financial inclusion to hitherto excluded segments of the population was critical to sustain and accelerate growth momentum. For achievement of the objective, the committee had put forward multi-pronged strategies include establishment of National mission on financial inclusion, revitalizing the RRBs and Cooperatives, introducing MFI model (SHG-bank linkage) and Business Facilitator and Business Correspondents Model. Mukherjee and Chakraborty (2012) studied the role and efficiency of the commercial banks in Jharkhand state with their capacity and role of institutions like regional rural banks (RRBs), self-help groups (SHGs), non-banking financial companies (NBFCs) for the purpose of promoting financial inclusion. The results of analysis shown that banks were not able to achieve the desired aims and study suggested that every bank should reports to the RBI on its achievement on financial inclusion more frequently. Uma and Rupa (2013) made an attempt to examine the role of SHGs in financial inclusion and reflected the positive relationship between SHGs membership and financial inclusion. The study revealed that after the membership to SHGs there was increase in the number of bank accounts, credit availed by the members and annual repayment of the loan also shown positive trend.
Joseph and Varghese (2014) analyzed the effect of financial inclusion on the development of Indian economy by bank growth rate in terms of number of bank branches, usage of debit card and credit cards. It has been observed that the usage of debit cards increased tremendously throughout the study period and decreased the number of people with access to the products and services offered by the banking system continues to be very limited, even years after introduction of inclusive banking initiatives in the country. Ravikumar (n.d.) made an attempt to assess the role of banking sector in financial inclusion process from different viewpoints namely branch penetration, ATM penetration, population per branch, distribution of banking branches, credits, deposits of SCBs and Co- operative banks in India. This study revealed that banking is a key driver for financial inclusion/inclusive growth but large proportion of population excluded from the formal financial system also show higher poverty ratios and higher inequality. Paramasivan and Ganeshkumar (2013) discussed the overview of financial inclusion in India and concluded that branch density has a significant impact on financial inclusion. Julie (2013) analyzed the relationship between financial inclusion and economic growth in Kenya and found that both have a strong positive relationship. Economic growth has a strong positive relationship with branch networks and a weak positive relationship with the number of mobile money users/accounts. The study also concluded the weak negative relationship with the number of automated teller machines in the country and a strong negative relationship with the bank lending interest rates. Study conducted in India by Kamboj (2014) found out the positive relationship between number of bank branch networks and number of ATMs in the country with the GDP growth rate of the country.
Research gapFinancial inclusion is an important step towards inclusive growth. It helps in the overall economic development of the underprivileged population. In India effective financial inclusion is needed for upliftment of the poor and disadvantaged people by providing them the modified financial products and services. This leads to inclusive growth encompassing the deprived and marginalized sections. Some studies are done on the financial inclusion by analyzing selected banks and other work has been found on state wise growth of financial inclusion. A few studies have been analyzed the impact of financial inclusion on Indian economic growth and found mixed results. With this backdrop, this research study is an attempt to find out the present scenario of financial inclusion in India and assessing the role of financial inclusion in economic growth of the country.
Objectives- 1.
To examine present scenario of financial inclusion in India.
- 2.
To investigate the major factors affecting access to financial services.
- 3.
To study the impact of financial inclusion indicators on growth of Indian economy.
This study is based on secondary data that was mainly collected from Report of RBI, Ministry of Finance, Government of India, Reports on trend and progress of banking in India, Newspapers, Research Articles, Research Journals, E-Journals, Books and Magazines. Various websites were also used like RBI, Ministry of Finance, and Government of India (GoI). The period under consideration for the study is seven years from 2007–2008 to 2013–2014. Data has been analyzed by applying multiple regression as a main statistical tool. Multiple regression analysis has been used to establish an empirical relationship between Financial Inclusion and growth of the country. The present study taking Gross Domestic Product (GDP) as a dependent variable and independent variables are Number of Bank Branches in the country, ATMs growth rate across the country and Credit deposit ratio.
where Y=Gross Domestic Product (GDP)
X1=Number of Bank Branches
X2=ATMs growth rate
X3=Credit deposit ratio
Hypothesis of the studyOn the basis of the objectives of the study, following hypothesis has been formulated:H01 There is no significant impact of financial inclusion on the growth of Indian economy. There is a significant impact of financial inclusion on the growth of Indian economy.
H01.1 There is no significant impact of Number of bank branches on Indian GDP. There is a significant impact of Number of bank branches on Indian GDP. There is no significant impact of ATM growth on GDP of Indian economy. There is a significant impact of ATM growth on GDP of Indian economy. There is no significant impact of Credit deposit ratio on GDP of Indian economy. There is a significant impact of Credit deposit ratio on GDP of Indian economy.
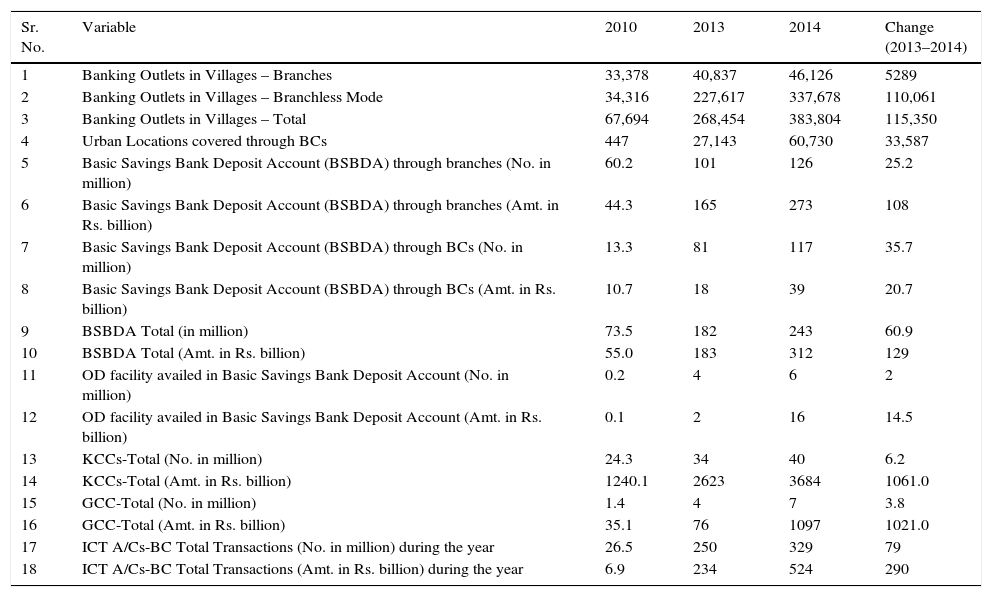
The RBI has encouraged banks to implement a planned and structured Financial Inclusion Plans (FIPs) for the growth and development of the country. The first phase of FIPs was covered a time period of three years which has started from 2010 and ends in 2013. FIPs have been used by Reserve Bank of India (RBI) for measuring the banks performance under their FI initiatives. Table 1 displays that a large number of bank accounts have been opened during this period and shaped a big banking network across the country. Despite, the results of first FIP witnessed that there has been insignificant improvement operations in terms of transactions. Hence, banks were instructed to draw up new three-year FIP from 2013 to 2016 for ensuring meaningful access of financial services.
Financial inclusion plan and its performance evaluation.
| Sr. No. | Variable | 2010 | 2013 | 2014 | Change (2013–2014) |
|---|---|---|---|---|---|
| 1 | Banking Outlets in Villages – Branches | 33,378 | 40,837 | 46,126 | 5289 |
| 2 | Banking Outlets in Villages – Branchless Mode | 34,316 | 227,617 | 337,678 | 110,061 |
| 3 | Banking Outlets in Villages – Total | 67,694 | 268,454 | 383,804 | 115,350 |
| 4 | Urban Locations covered through BCs | 447 | 27,143 | 60,730 | 33,587 |
| 5 | Basic Savings Bank Deposit Account (BSBDA) through branches (No. in million) | 60.2 | 101 | 126 | 25.2 |
| 6 | Basic Savings Bank Deposit Account (BSBDA) through branches (Amt. in Rs. billion) | 44.3 | 165 | 273 | 108 |
| 7 | Basic Savings Bank Deposit Account (BSBDA) through BCs (No. in million) | 13.3 | 81 | 117 | 35.7 |
| 8 | Basic Savings Bank Deposit Account (BSBDA) through BCs (Amt. in Rs. billion) | 10.7 | 18 | 39 | 20.7 |
| 9 | BSBDA Total (in million) | 73.5 | 182 | 243 | 60.9 |
| 10 | BSBDA Total (Amt. in Rs. billion) | 55.0 | 183 | 312 | 129 |
| 11 | OD facility availed in Basic Savings Bank Deposit Account (No. in million) | 0.2 | 4 | 6 | 2 |
| 12 | OD facility availed in Basic Savings Bank Deposit Account (Amt. in Rs. billion) | 0.1 | 2 | 16 | 14.5 |
| 13 | KCCs-Total (No. in million) | 24.3 | 34 | 40 | 6.2 |
| 14 | KCCs-Total (Amt. in Rs. billion) | 1240.1 | 2623 | 3684 | 1061.0 |
| 15 | GCC-Total (No. in million) | 1.4 | 4 | 7 | 3.8 |
| 16 | GCC-Total (Amt. in Rs. billion) | 35.1 | 76 | 1097 | 1021.0 |
| 17 | ICT A/Cs-BC Total Transactions (No. in million) during the year | 26.5 | 250 | 329 | 79 |
| 18 | ICT A/Cs-BC Total Transactions (Amt. in Rs. billion) during the year | 6.9 | 234 | 524 | 290 |
Source: Based on different issues of Reserve Bank of India (RBI).
A snapshot of the performance of banks under FIP up to March 31, 2014 is:
The number of banking outlets were 115,350 opened during the period of 2013–2016 which has been increased up the total number of outlets nearly 384,000. It is demonstrated by Table 1 that the number of BCs outlets opened in urban areas have increased up to 60,730 in the year of 2014 out of which 33,587 outlets opened during the year 2013–2014. It is a significant increment in number of BCs outlets. During the year 2013–2014 the number of basic savings bank deposit accounts (BSBDAs) opened were 60.9 million and total number of BSBDAs reached up to 243 million.
The number of small farm sector credits recorded a growth of 40 million in 2013–2014 out of these 6.2 million KCCs recorded during the year 2013–2014. Along with that the number of small non-farm sector credit cards were 3.8 million during 2013–2014 and total number was 7 million over the whole period of FIP. Table 1 further revealed that the 329 million transactions were carried out in BC-ICT accounts at the end of March 2014 and recorded a growth of 79 million transactions in 2013–2014.
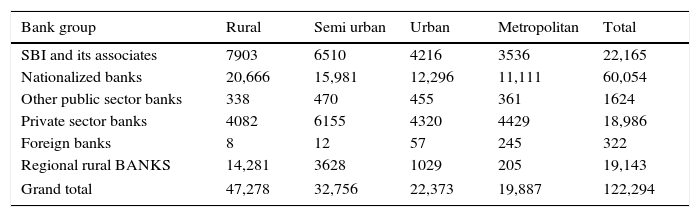
Table 2 shows the Bank group as well as population group wise number of bank branches in India as on 2014. From the table it is clear that all the bank groups operate more in rural areas except private and foreign banks. These groups dominate in metropolitan area with more branches compared to other area.
Bank group and population group wise number of functioning branches as on December 31, 2014.
| Bank group | Rural | Semi urban | Urban | Metropolitan | Total |
|---|---|---|---|---|---|
| SBI and its associates | 7903 | 6510 | 4216 | 3536 | 22,165 |
| Nationalized banks | 20,666 | 15,981 | 12,296 | 11,111 | 60,054 |
| Other public sector banks | 338 | 470 | 455 | 361 | 1624 |
| Private sector banks | 4082 | 6155 | 4320 | 4429 | 18,986 |
| Foreign banks | 8 | 12 | 57 | 245 | 322 |
| Regional rural BANKS | 14,281 | 3628 | 1029 | 205 | 19,143 |
| Grand total | 47,278 | 32,756 | 22,373 | 19,887 | 122,294 |
Source: Reserve Bank of India.
Fig. 1 shows the Bank group as well as population wise growth trend of number of bank branches over the India as on 31st December 2014. It is clear from the graph that SBI and its associates, public sector and regional rural banks are operates more in rural areas compared to others. The overall growth in rural and semi urban areas is comparatively more compared to urban and metropolitan. The private sector banks dominate in semi-urban areas with 6155 bank branches whereas foreign banks dominate in metropolitan area. The total number of functioning bank branches are122, 294 across the country.
Data analysis
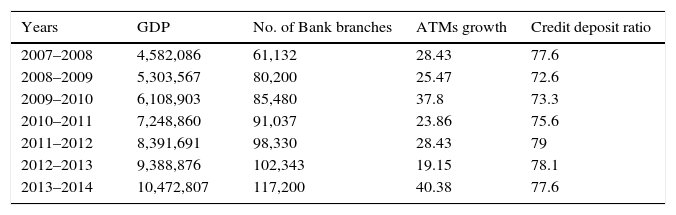
GDP is an important economic indicator to find out the growth of a country and it is widely used by researchers (Chithra & Selvam, 2013; Kamboj, 2014). Fig. 2 illustrates Gross Domestic Product (GDP) of India during a period of seven years starting from the financial year 2008–2009 to the financial year 2013–2014. GDP has been on continuous increase during these financial years. In 2008–2009 GDP recorded 4582,086, it was noted at a level of 5303,567 in financial year 2009–10 (an increase of 15.75% from the previous financial year). GDP shows 18.7% growth in the year 2010–2011, which is the highest growth over the period of time (Table 3).
.")
Variables of the study.
| Years | GDP | No. of Bank branches | ATMs growth | Credit deposit ratio |
|---|---|---|---|---|
| 2007–2008 | 4,582,086 | 61,132 | 28.43 | 77.6 |
| 2008–2009 | 5,303,567 | 80,200 | 25.47 | 72.6 |
| 2009–2010 | 6,108,903 | 85,480 | 37.8 | 73.3 |
| 2010–2011 | 7,248,860 | 91,037 | 23.86 | 75.6 |
| 2011–2012 | 8,391,691 | 98,330 | 28.43 | 79 |
| 2012–2013 | 9,388,876 | 102,343 | 19.15 | 78.1 |
| 2013–2014 | 10,472,807 | 117,200 | 40.38 | 77.6 |
Source: Compiled on the basis of different publication of RBI.
Fig. 3 shows the trend of number of functioning branches of Scheduled Commercial Banks (SCBs) in the country. It is clear from the graph that bank branches showing an increasing trend over the period of seven year. There were 61,132 bank branches in 2007–2008 that has been increased up to 117,200 in 2013–2014. The highest growth (31.2%) has been marked during the year 2008–2009 and lowest growth (4.1%) recorded in the year 2012–2013 in number of bank branches across the country.

The study also covered the Automatic Teller Machines (ATMs) in India as an indicator of financial inclusion growth. The number of ATMs has continuously increasing from the financial year 2007–2008 to the financial year 2013–2014. Fig. 4 depicts growth rate of ATMs across the country and 40.38% maximum growth has been noticed during the year 2013–2014. Minimum growth has been observed in 2012–2013 and it is dropped from 28.43% to 19.5%.

Fig. 5 demonstrates the credit deposit ratio during the period of seven financial years which is started from 2007–2008 to 2013–2014. The remarkable growth has been observed in the year 2011–2012 and maximum declined recorded in 2008–2009. Credit deposit ratio is slightly fell in during the years 2012–2013 and 2013–2014.

Table 4 indicates the model summary of multiple regression analysis which is carried out through SPSS. The result of the Model shows that the value of R is .995, which indicates a high correlation between dependent (GDP) and independent variables. The value of R square is .990 and Adjusted R square is .980. The p value of the model is .002 which is less than .05 indicating that the regression model is statistically significant and a fit model. The value of the Durbin–Watson test less than one or greater than three is not acceptable, as a rule of thumb and is an indication of autocorrelation problem. The model summary displays the value of Durbin–Watson statistic 2.590 which is free from autocorrelation problem.
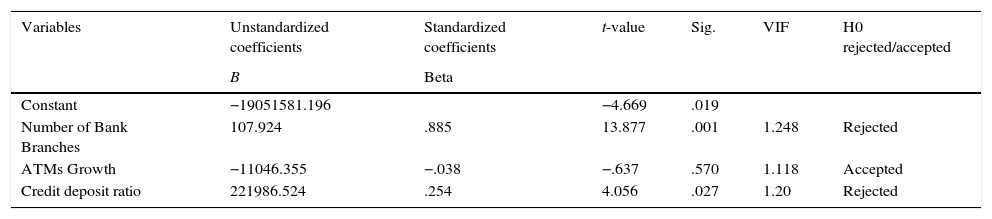
Table 5 illustrates the results of regression analysis for GDP and Financial inclusion indicators, it is to be noted that financial inclusion variables include Number of bank branches, ATMs growth in the country and Credit deposit ratio. Results of multiple regression reveals that the beta value of Number of bank branches is 107.9 which shows a positive impact on GDP. The p value is .001 which is less than .05 at 5% level of significance, which indicates that there is a statistically significant impact on GDP. It further reveals that the beta value of ATM growth is −11046.3 and p value is .570 which shows negative insignificant impact on GDP, as the p value is more than .05. Moreover, Credit deposit ratio shows 221986.5 beta value which shows positive impact on dependent variable. The p value of Credit deposit ratio is .027 lesser than .05, which indicates a significant impact on GDP. As a rule of thumb if the VIF values more than 10 are not acceptable and shows a sign of multicollinearity. This regression model is free from multicollinearity as all VIF values are less than 10 for all of the explanatory variables shown in Table 5. The following regression equation was obtained:

Regression coefficients.
| Variables | Unstandardized coefficients | Standardized coefficients | t-value | Sig. | VIF | H0 rejected/accepted |
|---|---|---|---|---|---|---|
| B | Beta | |||||
| Constant | −19051581.196 | −4.669 | .019 | |||
| Number of Bank Branches | 107.924 | .885 | 13.877 | .001 | 1.248 | Rejected |
| ATMs Growth | −11046.355 | −.038 | −.637 | .570 | 1.118 | Accepted |
| Credit deposit ratio | 221986.524 | .254 | 4.056 | .027 | 1.20 | Rejected |
Dependent variable: GDP.
Source: SPSS.
Therefore, study find the vigorous relationship between economic growth and financial inclusion indicators in India. These findings are consistent with the findings of Julie (2013) who established that financial sector plays a crucial role in economic development.
ConclusionIn developing economies like India, the banks work as mobilizers of savings and allocators of credit for production and investment, have a very critical role. As a financial intermediary, the banks contribute to the economic growth of the country by identifying the entrepreneurs with the best chances of successfully initiating new commercial activities and allocating credit to them (Chakrabarty, 2013). Financial access can really boost the financial condition and standards of life of the poor and the disadvantaged population of the country. Lack of accessible, affordable and appropriate financial services has always been an Indian problem and effective inclusive financial system is needed for economic growth of the country. Reserve bank of India (RBI) and government plays an important role in promoting financial inclusion for economic growth to increase the banking penetration, installation of new ATMs and implementation of various schemes in the country (Raman, 2012). The Reserve Bank has used FIPs to gauge the performance of banks under their financial inclusion initiatives. During the first phase of FIPs 2010–2013 a large number of bank accounts have been opened. However, it has been observed that the accounts opened and the banking infrastructure created has not seen substantial operations in terms of transactions. RBI has been applied a fresh three-year FIPs during 2013–2016 for ensuring meaningful access to banking services to the excluded population. The new FIP is now more focused on the volume of transactions which plays an important role in growth and development of the India. The most robust relationship is observed among financial inclusion and economic growth of the country (Julie, 2013). The present study found the positive significant impact of number of bank branches and credit deposit ratio of banks (proxies of financial inclusion) on GDP of the country. Whereas one indicator of financial inclusion, ATMs growth rate has been shown a statistically insignificant impact on Indian GDP. Hence, the study observed that financial inclusion is strongly associated with the progress and development of the economy. In spite of this there should be a need for proper financial inclusion regulation in the country to access financial services and customer awareness E-banking training and financial literacy programmes should be organized. Thus, financial inclusion is a big road which India needs to travel to make it completely successful.
Peer Review under the responsibility of Universidad Nacional Autónoma de México.