


The objective of this article is to propose a management index for the Internal Control of care entities. This was conceived following the multicriteria modeling guidelines in conjunction with the detection of weaknesses through the Petri networks. For this purpose, the order of importance and compliance of the internal control components were determined, and the lack of reliability of the critical processes in the entity subject to the practical implementation was identified. Derived from its humanitarian mission – lending quality health care to the population – it is necessary to decrease the emergence of events that could infringe upon the physical and psychological integrity of the patients in hospitals. One of the strategies to consider to overcome this challenge is the adequate implementation of the Internal Control System, which guarantees the sustainability of the insurers through the increase in the efficiency of the care of the people, feasible only within a care model that quantifies the control over the population already identified and cared for.
El objetivo de este artículo fue proponer un índice de gestión del control interno para una entidad hospitalaria. Este fue concebido siguiendo las pautas de la modelación multicriterio en conjunto con la detección de debilidades a través de las redes de Petri. Para esto se determinó el orden de importancia y cumplimiento de los componentes del control interno y al unísono se identificó la no fiabilidad de los procesos críticos en la entidad objeto de aplicación práctica. Derivado de su misión humanitaria, de prestar una asistencia sanitaria de calidad a la población, en los hospitales y establecimientos sanitarios, se necesita disminuir la aparición de hechos que puedan atentar contra la integridad física y psicológica de los pacientes que atienden. Una de las estrategias a considerar para superar este reto es la implementación adecuada del sistema de control interno, que garantice la sostenibilidad de los aseguradores, mediante el aumento de la eficiencia en la atención de las personas, factible únicamente dentro de un modelo de atención que cuantifique la gestión sobre la población ya identificada y atendida.
The uncertainty of the current scenarios in which the entrepreneurial activity develops, together with the need to adequately address the continuous changes and changing demands of the clients, entails a significant modification regarding entrepreneurial management. Thus, the role of Internal Control is essential as the element of the management process that contributes the most to the development of the system.
In recent studies (Bolaño Rodríguez, 2014; Comas Rodríguez, 2013), a group of shortcomings related to the management of Internal Control in Cuban organizations are demonstrated, and these are fundamentally focused on:
- 1.
A limited process-based approach that moves toward continuous improvement.
- 2.
The isolated implementation of control tools for entrepreneurial management.
- 3.
Inopportuneness and little flexibility in the decision-making process.
- 4.
Lack of tools for a permanent diagnosis.
- 5.
Poor reliability of the information provided.
- 6.
Little reliability of the decision-making process developed by the management.
The intention of entities belonging to the health sector in particular, after declaring the Hippocratic Oath, is to benefit the patients and hold said oath as a policy and obligation. However, as the result of the complex relation between the developed processes, the influence of technologies, and human relations, this care implies the high probability of occurrence of adverse events that could harm the patient (Pérez Rave, Trujillo, Castro, & Gómez, 2014). These generate an increase in claims and/or legal actions, together with the over expenditure in the medical care global cost.
In order to solve this problematic situation, a procedure that integrates Management Control tools such as Internal Control assessment, Risk management, and Process Approach was developed. This was done through the determination of the General Administration Evaluation Value (Valor de Evaluación General de Administración – VEGA) in Internal control, contextualized to the Cuban regulatory framework by means of its five components stated in Resolution 60 of 2011 of the Comptroller General of the Republic of Cuba. Given the diversity of variables that influence in its determination, the introduction of the multicriteria modeling was necessary. This has been used in similar contexts (Badri, Ghazanfari, & Shahanaghi, 2014; Mejía Argueta, Gaytán Iniestra, & Arroyo López, 2014) to determine the level of importance of the variables within a certain object of study.
Parting from the fact that the Internal Control intends to simultaneously inspect the activities under determined restrictions in their functioning, such as the use of the available resources, the Petri networks were used as an analysis tool that allowed identifying, modeling, and prioritizing these restrictions (Araújo, Araújo, Medeiros, & Barroso, 2015; Castro Rivera & Cuervo Oliveros, 2015; Hernández Cely, Leal, & López, 2013; Morales Varela, Rojas Ramírez, Hernández Gómez, Morales González, & Jiménez Reyes, 2015; Zapata, Hoyos, & Quintero, 2014). In order to validate the proposal, its implementation in a Cuban care entity is presented.
MethodologyThe design of the procedure resulted from the analysis of the theoretical-practical experience of the authors and the results analyzed in the Cuban entrepreneurial system. The procedure is comprised by four phases, as shown in Figure 1, and is explained below:

Objectives: to determine the vital elements for the start of the control management; define the objectives of the investigation, the state of the Internal Control in accordance with the controls of the last periods according to the self-control guide, and the critical processes of the organization to achieve relevance in the study.
Define the research objectivesThe objectives specific to the assessments to be carried out will be defined in order to verify in what measure the desired state is achieved once this phase culminates, which will help prevent moving on to the next phase with an erroneous model.
Internal contextsThese will be defined in conjunction with the auditing group and the prevention committee, the report of the results of the implementation of the self-control guide, issued in Resolution 60 of 2011 by the Comptroller General of the Republic of Cuba, as well as other strategic elements related to the control.
Selection of the expertsFor this, the field of knowledge that encompasses their expertise will be defined as “Management” with command of the following topics: quality specialist, auditing and process control, high proven experience and institution diversity.
Identification of the most significant processes in the entityThe weights of each process will be obtained through the valuations of the experts, who will be able to express their preferences in two forms: through a quantitative value or through the comparison between the criteria. If two criteria issued by the experts have an equal valuation, this will indicate that both criteria are equally significant; nevertheless, if a criterion has a greater value than another, it will mean that the former is more significant. The weight values must comply with the following condition:
where m is the maximum amount of processes and j represents the displacement pointer in the selection of a process within the summation function. Afterwards, the Pareto principle will be implemented to select those critical processes.Phase II. Diagnostic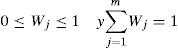
Objective: to determine the control management indices through two variants: the process approach and the Internal Control components, by means of the reliability and significance of the processes and their components.
Determining the significance of each internal control componentFor this, each expert will be asked for their opinion regarding the significance of each Internal Control component with regard to the rest of the components, this according to different criteria such as societal impact and the need for improvement. It will be verified that the sum of these relative values is equal to 100 (Mar Cornelio, Jiménez Hernández, & Bron Fonseca, 2014).
Determining the assessments issued by the componentsEach indicator will be assigned to its percentage, equivalent to the average of the selected component, to match the values identified in the guide.
Determining the control index by componentsThe implementation of the Weighted Sum method is proposed, using expression (1) presented below:
where ICcompSCI: internal control management index by components; Pi: absolute weight of component i (previously obtained); Ci: represents the numerical values corresponding to the compliance of the standards (previously obtained).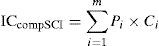
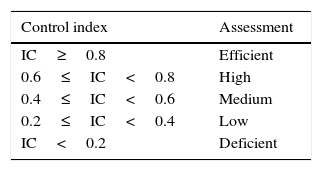
With the IC result, the scale defined in Table 1 will be used, corresponding the control values to the state of the organization.
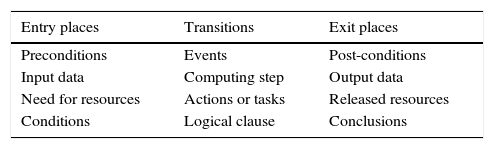
Construction of the Petri networkFrom the process or processes selected as critical, we will start with the translation of the actions to places and transitions1 for the construction of the Petri network, as shown in Table 2.
Interpretations for a Petri network.
| Entry places | Transitions | Exit places |
|---|---|---|
| Preconditions | Events | Post-conditions |
| Input data | Computing step | Output data |
| Need for resources | Actions or tasks | Released resources |
| Conditions | Logical clause | Conclusions |
The graph will be made using the symbols presented in Figure 2.
Determining control points
The objective is to avoid errors as those exemplified in Figure 3 (Gómez Alvarado, Alverca Torres, & Valarezo Collahuazo, 2012; Distéfano & Pérez, 2011; Murillo Soto, 2010; Sánchez, Herrera, & Rovetto, 2014):
- 1.
Transitions without entry and/or exit conditions: prevents the process from ending satisfactorily. Transitions two and four do not have places of entry or exit, respectively.
- 2.
Dead transitions: transitions that can never be ended. Transition six does not have the place or marking of condition P4, therefore, it will never be executed and would be dead.
- 3.
Blocking: standstill of a transition before it reaches the final process. Transition three sends a single marking to place three, therefore, one of the transitions, six or five, will not occur, which would cause a blockage in the process and it will not continue its course.
- 4.
Infinite cycles: a trap in which a transition can repeatedly fall into over and over in an endless loop, as is the case of transition five.
- 5.
Activity in execution after finalizing the process: the final objective of the process is reached, followed by transitions that continue to be executed. Transition nine will be executed when the final marker is reached from transition seven.
- 6.
Places in sites different from the final site after finalizing the process: the existence of markers after finalizing the process. Place nine will be marked when it is reached in the process.

Similar to the aforementioned, this time for the processes, the following criteria are recommended: societal impact of the process, generated income, maturity of the information system, and process performance.
Determining the reliability of the processesDetermine the reliability of each individual task through the following steps.
Step 1. Determining the minimum cutsA path between two places is any succession of tasks and arches, where no tasks are repeated. A cut (Ki) is a set of arches, whose failure causes the failure of the system (Andújar Rodríguez, García Pérez, & Cruz Rembaud, 2000).
Step 2. Determining the critical cutsOnce the paths and minimum cuts have been determined, the non-reliability will be determined as the probability that at least a minimum cut has occurred. From the minimum paths, it will be possible to find the minimum cuts, which will be determined by assuming independence in the failures, such as the probability that both procedures fail as a result of the non-reliability of the tasks that comprise them.
Determining the reliability of each activityIn order to determine the reliability of the system, the reliability of the activities will be individually determined, following a similar method to that proposed in the PERT (Program Evaluation and Review Technique) method, with the reliability being given by expression (2):
where a: optimistic reliability, minimum execution reliability of an activity when all the variables that intervene are exceptionally developed; b: pessimistic reliability, execution reliability when unfavorable circumstances coincide; m: most probable reliability, when the execution reliability does not experience positive or negative circumstances.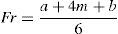
In order to determine the most probably reliability, the complement of the number of times that failures occurred within a determined (expression (3)) period (Nf) will be looked for in a given time horizon, taking into consideration that in a single determined interval of time (NT) there can be different failures.
Determining the non-reliability of the cuts
After calculating the individual reliability of the activities, the minimum cuts were determined by assuming the independence of the failures. The probability that both procedures fail is due to the non-reliability of the tasks that comprise them. The critical cuts are determined by selecting those activities whose probability of non-reliability is greater than 5% (though this threshold is recommended, the audit team could very well change it).
Step 3. Determining the reliability indexThe calculation of the reliability of the process control (Fi) is done using expression (4):
where Nk: number of critical cuts in process i; NT: total number of minimum cuts in process i.Determining the process control index
The determination of the process control management index is done using expression (5), and its evaluation is to be done according to what is shown in Table 1.
where ICprocess: internal control management index by process; Pi: absolute weight of process i (previously obtained); Fi: represents the reliability of process i (previously obtained).Phase III. Evaluation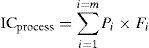
Objective: to determine the internal control management through the General Administration Evaluation Value (VEGA) of the Internal Control.
Determining the VEGA of the Internal ControlOnce the control indices are determined by the Internal Control component and by the critical process of the organization, the VEGA is calculated using expression (6):
For the evaluation of the indicator, the reference levels shown in Table 1 will be used.Elaboration and discussion on the evaluation report
The report will be prepared according to the weaknesses detected, in which the auditor must include, as part of their systematic study, all that concerns the suggestions made to increase the reliability of the critical processes and in the evaluation of the standards of the Internal Control System. The reports of the results must include the description of the procedures utilized, the verification of the results, as well as the analysis of the historical behavior of the values obtained and their trend analysis.
Phase IV. ImprovementObjective: to evaluate the supervisory and monitoring activities of Internal Control, under the guidelines of continuous improvement.
Comparison of the resultsThe trends (increase, decrease, seasonality, or stability) of the indicator will be compared to previous periods. When changes are made to the reference values of the indicator, the causes for these changes must be detailed.
Development of the action planTo define the implementation program of the improvement projects for which the action plans or specific programs would be established, as well as the technical and organizational means necessary for their effective execution.
ResultsThe objective of this study was to determine the VEGA in the health care entity selected as the practical subject of study. For this, we began with the characterization of the entity, which has strategic elements relevant for this study, such as a mission, vision and work objectives, in addition to the results of the self-control guide applied on July 2015 as a result of an external audit.
In the selection of the experts who would work on the implementation of the procedure, it was necessary to consider the criteria established here, with a final selection of the following: General Manager, Teaching Deputy Director, Nursing Deputy Director, Administration Deputy Director, Internal Control Specialist, Leader of the Oncological Center Department, and Leader of the Emergency Care Department. The critical and most significant processes were selected according to criteria such as the societal impact of the process, generated costs, maturity of the information system, and process performance in the entity through a weighted vote. Subsequently a Pareto analysis was carried out (Fig. 4) with its weights remaining as relevant processes: Sterilization, Emergency Services, Outpatient Consultation, Hospitalization, Egress, and Care to the Population, where the key processes predominated due to their societal impact.

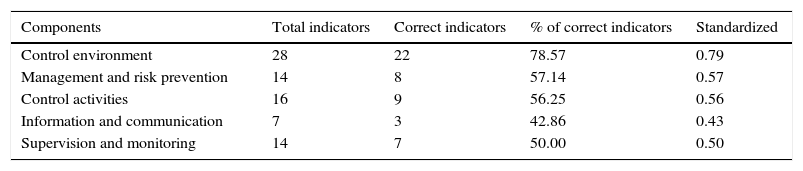
For this step, the result of the applied Guide was reviewed. Table 3 shows the indicators that were satisfactorily defined by the organization and standardized, expressing their corresponding percentage.
Compliance weight of the indicators.
| Components | Total indicators | Correct indicators | % of correct indicators | Standardized |
|---|---|---|---|---|
| Control environment | 28 | 22 | 78.57 | 0.79 |
| Management and risk prevention | 14 | 8 | 57.14 | 0.57 |
| Control activities | 16 | 9 | 56.25 | 0.56 |
| Information and communication | 7 | 3 | 42.86 | 0.43 |
| Supervision and monitoring | 14 | 7 | 50.00 | 0.50 |
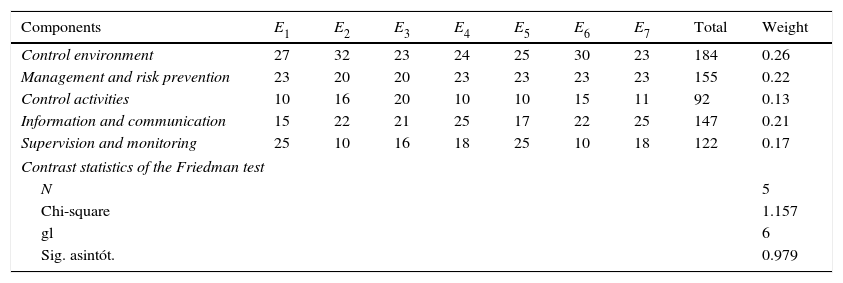
The value relative to the significance that was attributed to the evaluation of an internal control component with regard to the rest was determined. Table 4 visualizes the result of the survey applied to the experts, which allows determining the weight of each component. The consistency of the experts was verified, for which the Friedman contrast test was carried out with the help of the SPSS software version 20.0. The results are shown in Table 4.
Weights of the components according to the experts.
| Components | E1 | E2 | E3 | E4 | E5 | E6 | E7 | Total | Weight |
|---|---|---|---|---|---|---|---|---|---|
| Control environment | 27 | 32 | 23 | 24 | 25 | 30 | 23 | 184 | 0.26 |
| Management and risk prevention | 23 | 20 | 20 | 23 | 23 | 23 | 23 | 155 | 0.22 |
| Control activities | 10 | 16 | 20 | 10 | 10 | 15 | 11 | 92 | 0.13 |
| Information and communication | 15 | 22 | 21 | 25 | 17 | 22 | 25 | 147 | 0.21 |
| Supervision and monitoring | 25 | 10 | 16 | 18 | 25 | 10 | 18 | 122 | 0.17 |
| Contrast statistics of the Friedman test | |||||||||
| N | 5 | ||||||||
| Chi-square | 1.157 | ||||||||
| gl | 6 | ||||||||
| Sig. asintót. | 0.979 | ||||||||
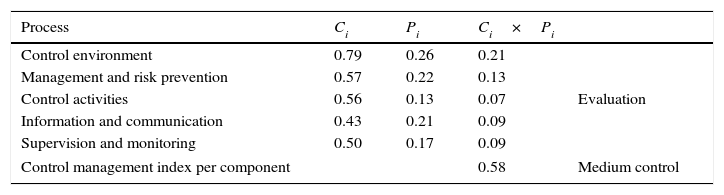
According to the result of the calculation in the previous table: p-value=0.979>0.05, therefore, there was consistency between the experts. Subsequently, the Control Management Index was calculated by component as shown in Table 5.
Determination of the control index by component.
| Process | Ci | Pi | Ci×Pi | |
|---|---|---|---|---|
| Control environment | 0.79 | 0.26 | 0.21 | Evaluation |
| Management and risk prevention | 0.57 | 0.22 | 0.13 | |
| Control activities | 0.56 | 0.13 | 0.07 | |
| Information and communication | 0.43 | 0.21 | 0.09 | |
| Supervision and monitoring | 0.50 | 0.17 | 0.09 | |
| Control management index per component | 0.58 | Medium control | ||
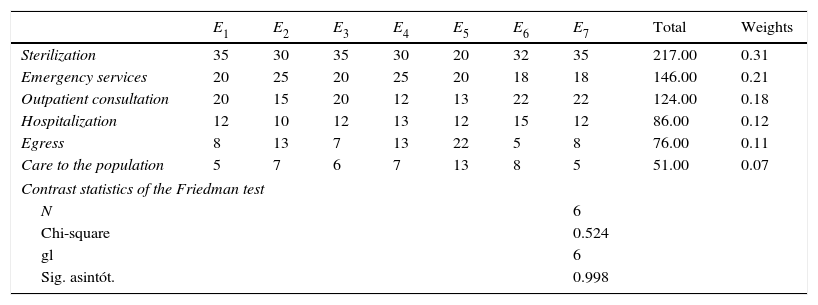
For this, each expert was surveyed a second time, requesting for them to provide their opinion on the importance of each selected process with regard to the rest of the processes, this according to different criteria such as: monthly and yearly evaluation, indiscipline increase, maturity of the information system, and process performance. The results are shown in Table 6. The consistency of the experts was verified.
Weights of the processes according to the experts.
| E1 | E2 | E3 | E4 | E5 | E6 | E7 | Total | Weights | |
|---|---|---|---|---|---|---|---|---|---|
| Sterilization | 35 | 30 | 35 | 30 | 20 | 32 | 35 | 217.00 | 0.31 |
| Emergency services | 20 | 25 | 20 | 25 | 20 | 18 | 18 | 146.00 | 0.21 |
| Outpatient consultation | 20 | 15 | 20 | 12 | 13 | 22 | 22 | 124.00 | 0.18 |
| Hospitalization | 12 | 10 | 12 | 13 | 12 | 15 | 12 | 86.00 | 0.12 |
| Egress | 8 | 13 | 7 | 13 | 22 | 5 | 8 | 76.00 | 0.11 |
| Care to the population | 5 | 7 | 6 | 7 | 13 | 8 | 5 | 51.00 | 0.07 |
| Contrast statistics of the Friedman test | |||||||||
| N | 6 | ||||||||
| Chi-square | 0.524 | ||||||||
| gl | 6 | ||||||||
| Sig. asintót. | 0.998 | ||||||||
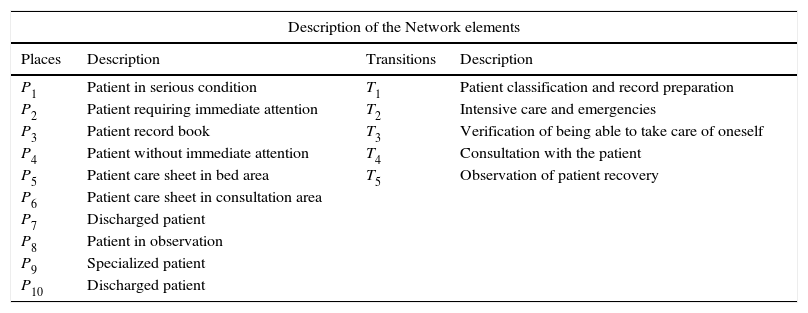
According to the result of the calculation in the previous table: p-value=0.998>0.05, there was consistency between the experts. Subsequently, the process structure and sequences were represented. Figure 5 shows the RdP that represents one of the selected processes (Emergency Service); the key of the RdP is defined in Table 7.

Description of the Petri network elements.
| Description of the Network elements | |||
|---|---|---|---|
| Places | Description | Transitions | Description |
| P1 | Patient in serious condition | T1 | Patient classification and record preparation |
| P2 | Patient requiring immediate attention | T2 | Intensive care and emergencies |
| P3 | Patient record book | T3 | Verification of being able to take care of oneself |
| P4 | Patient without immediate attention | T4 | Consultation with the patient |
| P5 | Patient care sheet in bed area | T5 | Observation of patient recovery |
| P6 | Patient care sheet in consultation area | ||
| P7 | Discharged patient | ||
| P8 | Patient in observation | ||
| P9 | Specialized patient | ||
| P10 | Discharged patient | ||
In the network, the activity executed after finalizing the process is evidenced. In the case of task two, it will be executed and will reach the final state while tasks three and four are activated, respectively. Tokens in sites different from the final site will be activated as well, after finalizing the processes by the same event; therefore, the control in task two must be imminent. The aforementioned allows concluding that, although the control is established in most of the analyzed activities, the need to increase it in the previously mentioned task can be inferred, since this would incur in high budgetary costs by concept of time, workforce, and possible loss of human lives due to the nature of the decisions.
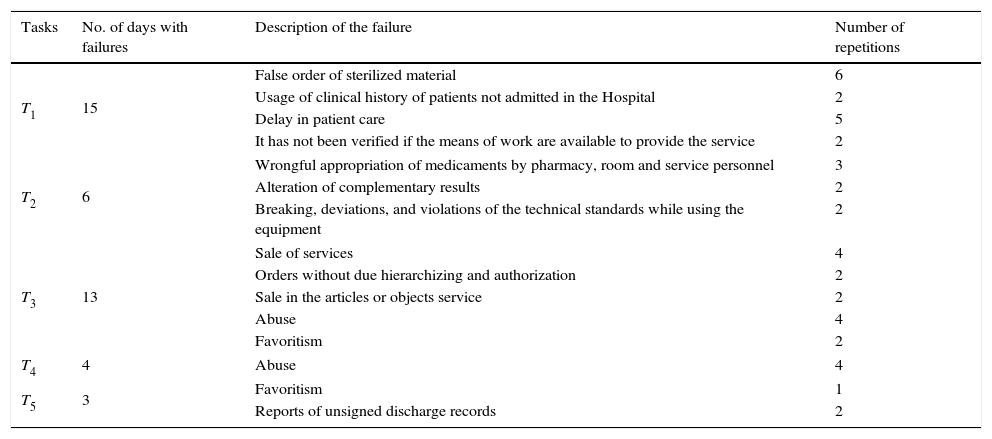
In order to calculate the more probable reliability, that is, the number of times that no failures occurred in a given temporal horizon,2 it was taken into consideration that in a single determined interval of time different failures could occur. The data are presented in Table 8.
Description of the failures due to activities of the process.
| Tasks | No. of days with failures | Description of the failure | Number of repetitions |
|---|---|---|---|
| T1 | 15 | False order of sterilized material | 6 |
| Usage of clinical history of patients not admitted in the Hospital | 2 | ||
| Delay in patient care | 5 | ||
| It has not been verified if the means of work are available to provide the service | 2 | ||
| T2 | 6 | Wrongful appropriation of medicaments by pharmacy, room and service personnel | 3 |
| Alteration of complementary results | 2 | ||
| Breaking, deviations, and violations of the technical standards while using the equipment | 2 | ||
| T3 | 13 | Sale of services | 4 |
| Orders without due hierarchizing and authorization | 2 | ||
| Sale in the articles or objects service | 2 | ||
| Abuse | 4 | ||
| Favoritism | 2 | ||
| T4 | 4 | Abuse | 4 |
| T5 | 3 | Favoritism | 1 |
| Reports of unsigned discharge records | 2 | ||
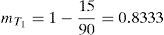
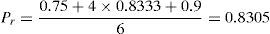
Therefore, the most probable reliability of task one was of 83.33%. The rest of the reliabilities (optimist and pessimist) were determined through a survey for the experts in each process. Subsequently, we proceeded according to the established to calculate the reliability of the task, obtaining that the reliability of task one is of 83.05% as shown below:
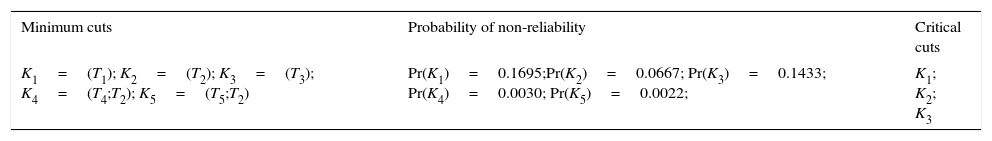
Afterwards, the critical cuts were determined (Table 9). Given that independence is assumed in the failures, the probability that both procedures fail is the result of the non-reliability of the tasks that comprise them. For the cuts, those activities with a non-reliability probability greater than 5% were selected (this threshold was established by the audit team). The summary of the diagnostic of the cuts is shown in Table 9.
The reliability calculation of the emergency service process control (Ci) ended up as follows:
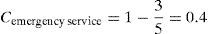
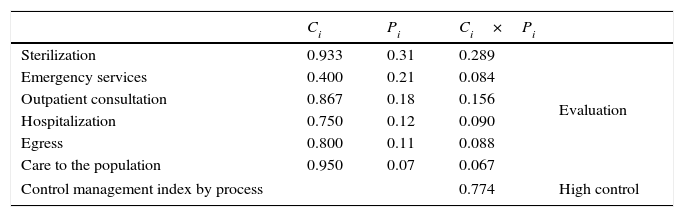
The reliability was of 40% in the particular case of this process. Afterwards, the reliability (Ci) of the rest of the processes was identified and the control index (IC) was calculated from the integral solution per processes, as shown in Table 10.
Determination of the control index per process.
| Ci | Pi | Ci×Pi | ||
|---|---|---|---|---|
| Sterilization | 0.933 | 0.31 | 0.289 | Evaluation |
| Emergency services | 0.400 | 0.21 | 0.084 | |
| Outpatient consultation | 0.867 | 0.18 | 0.156 | |
| Hospitalization | 0.750 | 0.12 | 0.090 | |
| Egress | 0.800 | 0.11 | 0.088 | |
| Care to the population | 0.950 | 0.07 | 0.067 | |
| Control management index by process | 0.774 | High control | ||
The VEGA of the Internal Control was determined through its two components as follows:

The Internal Control management in the entity was of 67%, classified as High; however, it is not considered efficient given that it is a health care entity, as such this VEGA is not considered acceptable. For the elaboration of the report, the weaknesses detected in the individual tasks of each processes were taken into consideration, then it was discussed with the managers of the entity to subsequently elaborate an action plan in function of its weaknesses, with the corresponding people responsible and executors.
DiscussionIn recent decades, the evaluation of internal control is carried out through the Self-control Guide (Cuba) and other control reports (other countries), which, although relevant tools, are limited exclusively to the identification of conformities with the elements associated to its components, such as the determination of a value of compliance with the standards or maturity index of the internal control as is the case of the Internal Control Standard Model in Latin American countries such as Columbia with the Town Hall of Gachancipa in 2014. On the other hand, the management by process through the ISO 9000:2015 is revealed, where the shortcomings in its integration with the internal control system are identified. Recent studies (Mar Cornelio et al., 2014) highlight the need of the multicriteria modeling for an increase in effectiveness in their evaluation, in addition to the proposal of Andújar Rodríguez et al. (2000) of a mathematical algorithm to detect failures in the internal control system, where the weaknesses by components are not evidenced.
The opinion of the authors is that the proposed tool solves the aforementioned shortcomings by allowing to identify, in the critical processes, the activities that comprise them and the components of Internal Control, which are critical points for this, with the use of the multicriteria modeling and the Petri networks as efficient tools in the representation of processes and the detection of failures. The usage of these contributes to the determination of the VEGA and the elaboration of objective and concrete action plans, through the detected weaknesses, to which the integral solutions would be focused, impacting simultaneously on various elements of Internal Control.
ConclusionsThe relevance of the multicriteria modeling and the Petri networks was proven for the conception and development of the model proposed, validating its reliability in practice. As a result of determining the VEGA from the analysis of its components and according to the processes of the entity, we can conclude that although the health care entity—object of a practical study—presents an Internal Control that is evaluated as High, as it allows detecting the main weaknesses in its management, there are reserves that must be exploited in the interest of increasing the efficiency of its services.
Peer review under the responsibility of Universidad Nacional Autónoma de México.