

The financial theory (Modigliani & Miller, 1958) presents risk management as a matter without importance in companies, given that the shareholders themselves managed their hedges, diversifying their portfolios. However, subsequent studies dispute said premise and present evidence that business financial hedging improves performance and increases the value of the same (Ahmed, Azevedo, & Guney, 2014; Allayannis & Weston, 2001; Kapitsinas, 2008). The efficient market risk management is supported in the financial derivatives, and demands strategic and efficient administrators in hedges that add value, especially in the face of clashes and macroeconomic and financial imbalances. The empirical evidence analyzes the behavior of the Q-Tobin as an indicator of the effect of the hedge strategies for the exchange rate associated to the market value. The aim of this work is to find evidence in Colombia on the effect of the use of derivatives in the market value of the company. Its added value lies in the analysis that is done by economic sectors, identified by ISIC codes and grouped into five (5) macro sectors (Agriculture and livestock, Commercial, Industrial or Manufacture, Services, and Construction). The methodology used includes the estimation of several regression models in data panels, using a Pooled regression model with fixed and random effect estimators through the maximum likelihood estimator. In general, a statistical and financially significant premium for hedges was found for companies exposed to exchange rate risks that use derivatives of a 6.3% average on the market value. Additionally, mixed results were found in relation to the variables analyzed in the model.
La teoría financiera (Modigliani y Miller, 1958) plantea la gestión del riesgo como un asunto sin importancia en las empresas debido a que los mismos accionistas hacían su gestión de cobertura diversificando sus portafolios; sin embargo, estudios posteriores entran en conflicto con dicha premisa y evidencian que la cobertura financiera empresarial mejora el desempeño e incrementa el valor de las mismas (Ahmed, Azevedo y Guney, 2014; Allayannis y Weston, 2001; Kapitsinas, 2008). La gestión eficiente de riesgos de mercado se apoya en los derivados financieros y exige administradores estratégicos y eficientes en cobertura que agregue valor, especialmente frente a choques y desequilibrios macroeconómicos y financieros. Evidencia empírica analiza el comportamiento de la Q-Tobin como indicador del efecto de las estrategias de cobertura de tipo de cambio asociado al valor de mercado. Este trabajo pretende encontrar evidencia en Colombia sobre el efecto del uso de derivados en el valor de mercado de la empresa. Su valor agregado radica en el análisis que se hace por sectores económicos, identificados por códigos CIIU y agrupados en cinco (5) sectores macro (Agropecuario, Comercial, Industrial o Manufactura, Servicios y Construcción). La metodología empleada incluye la estimación de varios modelos de regresión en panel de datos, utilizando una regresión Pooled con estimadores de efectos fijos y aleatorios mediante el estimador de máxima verosimilitud. En general, se encontró una prima por cobertura estadística y financieramente significativa para empresas expuestas a riesgos te tipo de cambio que usan derivados de un 6.3% promedio sobre el valor de mercado. Adicionalmente, se encontraron resultados mixtos en relación a las variables analizadas en el modelo.
The dynamics of the contemporary economy, of modern commerce, and of the development of financial markets bring along high volatilities that demand a greater speed of adaptation and administrative capacity by modern managers. Said managers, in their goal to maximize the value of the company and avoid bankruptcy, will have to think of strategies that will make it possible for them to acquire management and risk mitigation tools, in which the financial derivatives play a crucial role, as the companies appropriate these instruments with knowledge on the different products and hedging strategies that apply insofar as the derivative markets attain a greater development (Sierra González & Londoño Bedoya, 2010).
Colombia started its operations with financial derivatives in stock markets less than a decade ago, and though it lags in comparison to other countries,1 its acceptance in recent years—reflected on a growth of 57% of the volumes contracted from June 2015 to June 2016—is to be noted. This can be associated to foreign direct investment (FDI) both inward and outward, and to the increase of the hedging needs of companies in the real sector that are becoming more involved in the activities and operations of international commerce.
From the moment in which financial derivatives emerge and the doors of capital markets open for their use, concern arises regarding the real effectiveness of the same in corporate finances; both in the mitigation of risk and in the increase of the value of companies and the sustainability of the same, especially the emerging ones, as they are more susceptible to external clashes and domestic imbalances in terms of commercial exchanges associated with the volatilities of the exchange rates. Regarding the emerging countries, Caballero (2003) proposes the need to access assurance hedges and instruments that provide protection in case of disastrous events caused by volatilities in the flow of capitals. Therefore, hedges are vital for the economic sustainability and financial viability of an organization.
One of the relevant aspects in the study of derivatives is the relation with the level of indebtedness of companies, so that the influence of the hedge on the cost of the debts happens mainly due to the low probability of the risk of bankruptcy and the agency costs, as well as the reduction of information asymmetries (Chen & King, 2014). However, if the company has a high level of indebtedness, the effect could be the opposite. Thus, it is generally expected that if the country (investors, companies and Government) actively participates in the Capital Market with hedges for the mitigation of exchange rate risk, then economic stability will improve, mainly if the exposition is linked to debts in a foreign currency. For George Allayannis, Lel, and Miller (2012), who investigated the relation between the market value of the companies and hedging with derivatives, the results are varied and depend on the economic context and its characteristics, for example: the type of company, the characteristics of the financial market, and the level of development of the derivative instruments market (liquidity, depth, diversification). Thus, the research in this field has focused on Tobin's q ratio as an indicator of the market value of the companies, supported by different multivariate models seeking to find significant evidence in said relation in companies listed in Public Stock Markets.
This research work is immersed in a broader project that was constructed stage by stage, with the initial objective being the identification of the sectors and companies that mitigate their exchange rate risk through derivative instruments in Colombia, and the relation of hedging with the value of the company. In the same line as previous empirical researches (Ahmed, Azevedo, & Guney, 2014; Allayannis et al., 2012; González, León, & Leiton Rodríguez, 2009; Nelson, Moffitt, & Affleck Graves, 2005; Búa, Otero González, Fernández López, & Durán Santomil, 2015), Tobin's q ratio is defined as a variable of interest, investigating the relation of the effect of hedges in companies and the contribution of these to the decrease of the exchange exposure and the increase in the value of the company.
Theoretical frameworkModern financial administration has started to acknowledge the importance of financial risk management within its corporate strategies, and has included them within its hedging, understanding that good corporate results are associated with it. In Mexico, Munoz Martinez (2015) analyzes the importance of turning hedges into a governmental policy in order to maintain the public budgets and increase the foreign currency reserves. Géczy, Minton, and Schrand (1997) carried out a study with 372 industrial companies from the Fortune 500 list to examine currency hedging activities with derivatives, and to simultaneously contrast the existing hedging theories; they found that the companies that carry out these activities have a positive relation with growth opportunities. Working with multivariate models, it was found that companies with high growth and limited financing are more prone to carry out hedges with the derivatives of currencies, improving their costs related to financial restrictions, which allows presenting a cash flow that is better fitted to investment and growth opportunities. This mainly benefits companies with more volatility in their results, associated with greater assumed exchange rate risks. They also found that companies use currency derivatives to reduce underinvestment problems.
The implementation of risk hedging strategies promotes the reduction and control of the same, and in this way, it allows preventing future cases of bankruptcy since with the stabilization of the volatility of the flows the probability of having to face financial problems related to the payment of interests and debts decreases.
There are several elements as important for a company when carrying out hedging with derivatives: (i) financing costs, (ii) corporate taxes, (iii) agency costs, (iv) market imperfections, and even (v) response of the management as a risk administration strategy. Regarding risk management, Hammoudeh and McAleer (2013) mention that it is a fundamental matter for the optimal administration of portfolios, and highlight the expansion and growth that these instruments have had in recent years as an important area of finances. Jin and Jorion (2006) theorize two aspects, attempting to investigate and explain why administrators manage risk: (i) they consider that in line with the search for the maximization of the value of the shareholder, there is the intend for the mitigation of the variation of cash flows; and (ii) they propose that hedges can be of use as indicators of the management capacity of administrators, which is in line with the maximization of the benefits of the directives.
Other authors associate the imperfections of the capital market with the differences in the acquisition costs of external resources or with respect to transaction costs and the economies of scales (Froot, Scharfstein, & Stein, 1993; Géczy et al., 1997; Smith & Stulz, 1985); therefore, the corporate hedging strategy generates advantages that are associated with indebtedness and growth strategies. However, the motivation of the companies to carry out hedges also depends on elements such as the exposure to the exchange rate that the company has and the costs in risk management. In turn, Géczy et al. (1997) propose three key factors when deciding a hedging strategy with derivatives: existing incentives for their use, the level of exposure to the exchange rate (specially), and the implementation costs of the hedging strategies. For Froot et al. (1993), the imperfections of the capital markets and the asymmetrical information drive up financing.
Others assume that management implements hedges due to the existence of information asymmetries that must be controlled through the transmission of results and managerial skills that provide appraisal tools to the capital market (Bessembinder, 1991; Smith & Stulz, 1985), and identify corporate hedging as an instrument in the reduction of transaction costs. The hedging implementation strategy with derivatives create opportunities to reduce financial difficulties, and in companies with high debt and growth opportunities, there is a higher chance to establish hedging programs. Froot et al. (1993) emphasize that hedging contributes to the decrease of the capital variations necessary for expenses, investments, and external financing, and identify four reasons to carry out risk management in companies through financial hedging: management, taxes, debt capacity, and imperfection of the capital market.
Dufey and Srinivasulu (1983) stress that managers averse to risk and with economic participation in the companies that decide to carry out hedging with derivatives to mitigate risks such as the volatility of cash flows—and therefore, their personal wealth—find a benefit in this type of strategies. In managers, aversion to risk is reflected on the utility and, therefore, in the volatility of the expected risk (Smith & Stulz, 1985), with an existing positive relation between the use of the derivatives and corporate wealth. DeMarzo and Duffie (1995), in Bartram, Brown, and Conrad (2011), attempt to explain the direct proportional relation between incentives and corporate reputation, and identify that the shareholder benefits from risk hedging, given that the administrators and/or managers have private and non-observable information that comes into play in the flows of companies; contrary to what is proposed by Modigliani and Miller (1958).
In Colombia, Esteban and Correa (2011) analyze if the SMEs carry out hedges through Swaps (Medellín) and attempt to identify how and why they do it, as well as the benefits and prejudices for their use. Their findings are that this type of companies could be exposed to exchange rate risks, but they do not know the derivative products and those that do use another type of hedging. Other studies (Bartram et al., 2011) focus on a large sample of nonfinancial firms including energy producers, airlines, and industrial equipment manufacturers and attempt to study the effect of derivative use on firm risk and value. Contreras, Macías Villalba, and Luna González (2014) focus on the design of a derivative product with electricity as an underlying asset, analyzing the volatility of the price of the asset through time series. They propose the design of an exotic barrier-type option, demonstrating how to use this for risk hedging in the market.
Sierra González and Londoño Bedoya (2010) study hedges through derivative instruments in companies of the real sector (industry and commerce), focusing on their use since this market opened in the Colombia Stock Exchange. For this, they apply a logistic regression model and establish two hypothesis in the same vein as previous international studies, in which the use of derivatives is related to companies with financial sophistication and financial stress, as well as the combination thereof.
Froot et. al. (1993) develops a general framework for analyzing corporate risk management policies and observed that if external sources of finance are more costly to corporations than internally generated funds, there will typically be a benefit to hedging: hedging adds value.
Bartram et al. (2011) studied the use of derivatives as a measure of risk and value in 47 countries, with a sample of 6888 non-financial companies; they applied univariate tests and evidenced that the use of derivatives as hedges is more recurrent in companies with a greater exposure of commodities, foreign currency, and interest rates, taking into consideration that these companies have a lower degree of systemic risk. Simultaneously, they carry out a comparison between companies with operations with derivatives and those without them, taking into consideration that there is a substantial difference as the latter show high volatility in cash flows and synthetic risk. This suggests that the non-financial companies generally utilize derivatives with a primary reason: the reduction of risk.
Derivative instruments improve the development of financial markets, and contribute to the increase of depth and liquidity by broadening the base of participants and providing different investment and hedging instruments and options. In emerging countries, though this market is incipient, they begin to notably grow in traded volumes when broadening the OTC market to the Stock Exchange, with which companies from different economic sectors and investors generally find new hedging, investment, speculation and arbitration alternatives. The foregoing requires the synergy of different institutions that are in favor of the development and diversification of the derivative instruments market.
Methodology and description of the sampleThis study is influenced by Allayannis & Ofek y Allayannis & Weston (2001), in its methodological regard. It aims to analyze whether the companies exposed to foreign currency risk that use derivatives as a hedging strategy, obtain a benefit through Tobin's q. The study has an exploratory and descriptive nature. The research is empirical and non-experimental, supported by regression models.
For this, 39 companies were selected and used as the subject of statistical analysis. The process began with 195 companies listed in the BVC, and subsequently those companies from the real sector and which are involved in operations with financial derivatives were identified. Information from financial statements available in the Stock Market Integrated Information System (hereinafter SIMEV, for its acronym in Spanish)2 of the Financial Superintendence of Colombia was used. The companies from the financial sector, insurance companies, and autonomous estates were excluded as some of them are part of the intermediate derivative instruments market in Colombia, whereas others are market creators; therefore, in both cases, they make use of this type of instruments with purposes different from those of the companies of the real sector. The sample was comprised by companies with financial information available in the SIMEV since the last quarter of 2008 until the same quarter of 2014: the decision to work with quarterly information was made to provide some volume to the information and comprise the database with which the models work; it was decided to start in 2008, considering that the centralized derivative market in Colombia began its transactions in the third quarter of that year. Additionally, in some cases data were extracted from the same financial statements reported on the websites of the companies, and the notes of the same were consulted. Moreover, information validation controls were carried out, cross-referencing them with the Economatica database to make the data panel more reliable.
The plan was to work with 40 companies, however, one of them presented extreme atypical and strange values in its Tobin's q. The information was looked up once more but it was difficult to confirm the values, as it is a company with no marketability. It was decided to eliminate it completely from the sample to have a final number of 39 transversal cut units. A total of 975 observations were obtained. Unlike Allayannis et al. (2001), not all public companies such as Ecopetrol were excluded because, though they can be either strictly regulated or not as mentioned by the authors, they are companies that decide to carry out hedging with derivatives as part of their business strategy. In this sense, the research does not aim to identify the type of derivative instrument used as a hedge, but rather to identify whether the companies that carry out hedging with financial derivatives increase their value with respect to those that do not, as well as the behavior of other variables. All those companies that in one way or another were involved in foreign trade operations or that manifested that they had position in this type of instrument in financial reports and notes were considered “Companies that use derivatives”. In several cases it was found that the company reported the use of derivatives as a hedge but did not report the figures. Therefore, we work with a variable that allows measuring the exposure to the exchange rate risk of the company in its usual business operations, relating sales in foreign currency to the income of the overall activities.
Characterization of the dependent variablesThe structure of the database is the panel type and links the following as independent variables: company size, leverage, operational income, total sales, foreign sales, growth of the investment, geographical diversification, use of derivatives, and dividend payment. These variables were selected in a consequent manner with studies that pursue the same objective (Allayannis et. al. 2001, Bartram 2007, Bartram, Brown, & Fehle 2009; Jin & Jorion 2006). Table 1 presents a summary of the variables involved in the model.
Description of the independent variables.
| Name (Mnemonic) | Description | Unit of measure |
|---|---|---|
| Size | Generally, big companies are more prone to the use of derivatives than small companies, nevertheless, there is ambiguous evidence on the influence of size on the q, as a company with high growth expectations can present a greater q than those that have high maturity. | Natural logarithm of the total assets |
| Total leverage (Apalanca_Total). | Measures the relation between total liabilities and total assets. Previous literature indicates that the leverage relation can have either a positive or negative impact. | Relation between total liabilities and total assets |
| Long term leverage (Apalanca_LP). | Measures the relation between long-term debt and total assets. | Relation between the non-current liability and the total assets. |
| Growth of the investment through fixed assets (Crecim_Inver_Ac_Neto). | Measures the availability of resources that the total sales assign to the growth of the company through fixed assets, which is associated with future growth opportunities that contribute with a greater value to the company. | Relation between net fixed assets and total sales. |
| Growth of the investment through intangible assets (Crecim_Inver_Intang). | Measures the availability of resources that the total sales assign to the growth of the company through intangible assets, which is associated with investment activities in research and development, and in turn with growth opportunities in the future that contribute with a greater value to the company. | Relation between intangible assets and total sales |
| Market capitalization (Cap_Bur). | Measures the market value of the property through the price of the outstanding shares to the cut-off date of each period. | No. of outstanding shares by the closing price |
| Level of exposure (Nivel_Expo). | If a company increases its participation in foreign markets, then the probability of growth increases, but in turn, these international trade activities entail operations with foreign currency, which expose the financial stability of companies to market risks, hence the need for hedges. Therefore, it is expected that those companies, exposed to exchange rate risks and that use derivatives for hedging strategies, increase their market value. | Participation of exports with respect to the total sales of the company |
| Geographical diversification (Diversifica_Geografica). | Dummy variable that identifies whether the company is exposed to exchange rate risks or not. | Dummy variable that takes the value of one (1) if the company utilizes derivatives and zero (0) otherwise. |
| Use of derivatives (Uso_Derivados). | It is expected that companies that carry out operations with derivatives as a hedging strategy, create a greater value through the mitigation of the risks associated with the financial and operative processes and the decrease in volatility of the financial results. | Dummy variable that takes the value of one (1) if the company utilizes derivatives and zero (0) otherwise. |
| Use of dividends (Pago_Dividendos). | The use of dividends can generate adverse effects for the increase of value of the company. This is due to the fact that there is no re-investment for projects or future investments that contribute to corporate growth. | Dummy variable that takes the value of one (1) if the company pays dividends and zero (0) otherwise. |
| Net profitability (Rentab_Neta). | The most profitable companies will have a higher market value by having future cash flows that are more sustainable than those companies with low profitability. The hedging strategies carried out by a company could mitigate the risk of big losses, which would be reflected on profitability. | Relation between net utility and total assets. |
| Return on invested capital (ROIC). | Measures the return on assets over the net investment. It is expected that in companies that use derivatives, this variable is greater than in the companies that do not use hedges. Furthermore, the decrease of volatility is expected. | Relation between operational utility and the net PPE assets. |
| EBITDA and EBITDA margin (EBITDA y Mg_EBIDTA). | Measures the capacity of the company to generate gross operating profits. | Operating profit plus depreciations. Relation between operating profit plus depreciations with respect to the operational income. |
In order to know if hedges increase the value of the company, it is vital to analyze each of the variables that affect the value represented by Tobin's q (Q).3 The latter is a financial ratio that measures the relation between the market value of the company and its book value. In this manner, a value of this purpose that surpasses the unit indicates an increase in the value of the company and suggests a positive marginal benefit of new investments. This financial ratio reflects the value of the company given by the market based on the replacement cost.
Several authors have utilized Tobin's q as dependent in the calculation of the models in the hedging theory (Allayannis et al., 2001; Chen & King, 2014; Chen & Shao, 2010; Daske, Hail, Leuz, & Verdi, 2008; Lang & Stulz, 1993; Nelson et al., 2005). These relate the value of Tobin's q to the use of financial derivatives through regression models or the analysis of time series and panel data. Carter, Rogers, and Simkins (2006) observe the relation of the value of the company with fuel hedging in the aviation industry in the United States between 1994 and 2000, based on Tobin's q and using Generalized Least Squares. Meanwhile, Gómez-González, León Rincón, and Leiton Rodríguez (2012) evaluate the effect of risk management and hedges on the value of the firm (Tobin's q) in 81 companies in Colombia, finding that the greater the hedge, the higher the growth in value of the company.
This research is based on a simplified methodology referenced in Allayannis and Weston (2001), who work in the same line of research as several authors such as Lewellen and Badrinath (1997) and Ahmed et al. (2014), who based their work on other authors such as Chung and Pruitt (1994), in order to consider Tobin's q as the relation between the market value of the company with respect to its carrying value at the close of the fiscal year:
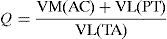
where,
VM (AC): market capitalization or market value of the property.
VL (TA): carrying value of the total assets of the company.
VL (PT): carrying value of the total liabilities.
Based on the foregoing, the following hypotheses are posed:H1 The use of the financial derivatives increases the value of the company with respect to those that do not use them. Larger companies with greater leverage, growth in investment, level of exposure, and profitability are compensated in their market value for the use of derivatives. The companies with geographical diversification that use financial derivatives as hedges increase their value in comparison to those that do not.
Table 2, panel A, presents the general statistical descriptions of the main variables for the entire sample. The results show that the average of the total assets (operational income) is of $3808578 ($1386729) million COP4; as in Allayannis et al. (2001), approximately 51% of the observations of the sample export and participate in sales and trade operations abroad and comprise 12% of the operational income that is exposed to risks. And unlike the previous ones, which obtain a 37%, the results of this study present evidence that 51% use some type of derivative instrument as a hedge. Regarding Tobin's q, the results showed an average of 1.16, close to the 1.18 found by Allayannis et al. (2001), and a median of 0.86, while in Allayannis et al. (2001) a median of 0.95 was found. The average EBITDA margin of the total sample is of 32%, the net average profitability is of 4%, and the total dividends paid in the sample is of 72%. The total and non-current leverage were of approximately 30% and 11.3%. On average, the growth of the net assets as property, plant, and equipment is of 1.89 pesos per each peso in total sales; and 18.6% of the sample represents growth through intangible assets.
General descriptive statistics of the sample.
| Panel A: full | |||||
|---|---|---|---|---|---|
| Variables | No | Mean | Std. dev. | Min | Max |
| Ac_Total | 975 | 3808578 | 13800000 | 12259 | 121000000 |
| IngOp | 975 | 1386729 | 6492551 | 95.18 | 69100000 |
| Sales_Abroad | 975 | 205648 | 1143975 | 0 | 19100000 |
| CapBur | 975 | 5062570 | 24800000 | 0 | 224000000 |
| Size | 975 | 1314457 | 196867 | 9414056 | 1860786 |
| Crecim_Inv_Ac_Neto | 975 | 1895101 | 5675408 | 0.0022 | 8178028 |
| Q_Tobin | 975 | 1160501 | 0.8276 | 0.1988 | 4754907 |
| Nivel_Expo | 975 | 0.1210 | 0.2293 | 0 | 1 |
| Uso_Derivados | 975 | 0.5128 | 0.5000 | 0.0000 | 1 |
| Apalanca_Total | 975 | 0.2924 | 0.2060 | 0.0028 | 1067062 |
| Apalanca_LP | 975 | 0.1127 | 0.1215 | −0.0480 | 0.7554 |
| Crecim_Inv_Intang | 975 | 0.1860 | 0.4411 | −0.0097 | 3776087 |
| Control: | |||||
| Rentab_Neta | 975 | 0.0396 | 0.1184 | −0.5342 | 1641481 |
| Pago_Dividendo | 975 | 0.7220 | 0.4482 | 0 | 1 |
| Diversification | 975 | 0.5087 | 0.5001 | 0 | 1 |
| ROIC | 975 | 2415289 | 1683968 | −6977517 | 3938046 |
| EBITDA | 975 | 389253 | 2254554 | −242407 | 32600000 |
| Mg_EBITDA | 975 | 0.3205 | 0.6471 | −6197799 | 7412946 |
| RSAN | 975 | 1569938 | 1094579 | −4535386 | 255973 |
| Panel B: Sales_Abroad>0 | Panel C: Sales_Abroad=0 | ||||||||
|---|---|---|---|---|---|---|---|---|---|
| Mean | Mean | Std. dev. | Min | Max | No | Mean | Std. dev. | Min | Max |
| 496 | 5990173 | 18800000 | 62804 | 121000000 | 479 | 1549557 | 3357173 | 12259 | 17100000 |
| 496 | 2322898 | 8920977 | 13896 | 69100000 | 479 | 417335 | 1276116 | 95.18 | 10100000 |
| 496 | 404247.9 | 1579434 | 9205915 | 19100000 | 479 | 0 | 0 | 0 | 0 |
| 496 | 8581988 | 34200000 | 0 | 224000000 | 479 | 1418245 | 3504364 | 4538349 | 15900000 |
| 496 | 1394698 | 1482492 | 1104779 | 1860786 | 479 | 1231369 | 2064316 | 9414056 | 1665676 |
| 496 | 0.6902 | 0.5412 | 0.0190 | 3239275 | 479 | 314267 | 7890761 | 0.0022 | 8178028 |
| 496 | 1162013 | 1003024 | 0.1988 | 4754907 | 479 | 1158936 | 0.5950 | 0.3063 | 3591698 |
| 496 | 0.2379 | 0.2749 | 0.0000 | 1 | 479 | 0 | 0 | 0 | 0 |
| 0.7560 | 0.4298 | 0 | 1 | 479 | 0.2609 | 0.4396 | 0 | 1 | |
| 496 | 0.3524 | 0.1555 | 0.0480 | 1067062 | 479 | 0.2301 | 0.2319 | 0.0028 | 0.9958 |
| 496 | 0.1410 | 0.1141 | 0.0000 | 0.5164 | 479 | 0.0834 | 0.1221 | −0.0480 | 0.7554 |
| 496 | 0.2160 | 0.4035 | 0.0000 | 3283868 | 479 | 0.1549 | 0.4754 | −0.0097 | 3776087 |
| 496 | 0.0571 | 0.1588 | −0.5343 | 1641481 | 479 | 0.0215 | 0.0427 | −0.3603 | 0.3241 |
| 496 | 0.6229 | 0.4851 | 0 | 1 | 479 | 0.8246 | 0.3806 | 0 | 1 |
| 496 | 1 | 0 | 1 | 1 | 479 | 0 | 0 | 0 | 0 |
| 496 | 0.6073 | 2603703 | −1573209 | 358808 | 479 | 4287425 | 2374665 | −6977517 | 3938046 |
| 496 | 717419.1 | 3125333 | −242407 | 32600000 | 479 | 49441.26 | 122012 | −53172 | 963543 |
| 496 | 0.2995 | 0.4783 | −0.4070 | 3318233 | 479 | 0.3423 | 0.7845 | −6197799 | 7412946 |
| 496 | 0.3947 | 1692407 | −1022586 | 2332252 | 479 | 2786827 | 1543533 | −4535386 | 255973 |
Panel B reflects average results with clear increments in the main variables, evidencing that they are larger companies, with greater operational income, greater market capitalization and slightly more leverage than the total of the sample, both in total and long-term liabilities; furthermore, they have a greater EBITDA, though not a greater EBITDA margin, a net profitability, and a growth through intangible assets of approximately two (2) percentage points above the average of the total sample. The rest of the variables decrease comparatively, though not in big proportions. As was to be expected, the percentage of companies that carry out hedges with derivatives increases by approximately 24%, and the exposure level to risk also increases, almost doubling, to 24%.
Panel C identifies the companies that do not sell abroad. Clearly, this group exhibits general characteristics of a smaller size in the majority of its main variables. It is worth noting the low participation in hedging operations with derivatives, being 25 percentage points below the total mean. However, it reflects better average indicators of financial performance, such as ROIC, EBITDA margin and RSAN, but not in Net Profitability. Finally, this group shows that there is a payment of dividends in approximately 82%.
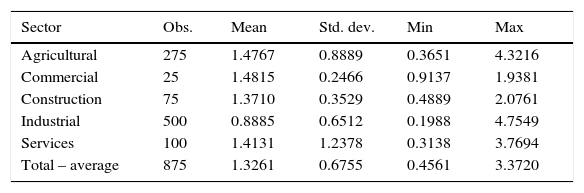
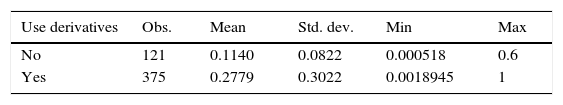
It is important to stress that there is no broad difference in the average behavior of Tobin's q among the three panels (A, B and C), preserving a close average value between each other (1.1605, 1.1620 and 1.1589, respectively), though inferior in companies with sales that are exclusively local. An alternative Tobin's q was constructed, including the value of the inventories declared on the Balance Sheet, with which average superior results were obtained: 10.21 for the entire panel, 1.23 for companies with sales abroad and 1.18 for those with local sales. This supports the concept that the companies with international sales are larger than those that do not sell abroad, and is backed by the results of the asset size and EBITDA variables. The results of the mean of the q of the entire panel are superior to the median of the q (0.86), indicating that there is bias in the distribution of Tobin's q,5 therefore, this is softened through a normalization process (Q_Tobinw: winsorized). Additionally, due to the fact that the sample is comprised by companies from different sectors, sectored Tobin's q averages are extracted in order to identify the behavior of the sample in each of them. Clearly, the industrial sector, which represents 51% of the sample with 500 observations out of 975, has the lowest value (Q_Tobin 0.88). Finally, as was to be expected, the percentage of companies that use derivatives with exposure due to sales abroad, is higher than those that do not use derivatives (27.7% against 11.4%, see Annex 1 and Annex 2 for more details).
Panel data modelsConstant coefficient regression modelAll observations are grouped in this model and they are analyzed in a consolidated manner. The model assumes that the coefficients are equal for all the subjects (analyzed companies), so the sample is given an equal treatment. Thus, the explicative variables are not stochastic and are strictly exogenous, that is, they do not depend on the actual values—past and future—of the error term (Gujarati & Porter, 2009). This regression is represented by the following equation:

where,
Yit=value of the ith company in the tth moment, natural logarithm of Tobin's q.
X2it=size of the ith company in the tth moment.
X3it=leverage of the ith company in the tth moment.
X4it=investment growth of the ith company in the tth moment.
X5it=geographical diversification of the ith company in the tth moment.
X6it=profitability of the ith company in the tth moment.
X7it=use of derivatives by the ith company in the tth moment.
X8it=payment of dividends by the ith company in the tth moment.
The heterogeneity of the transversal cut units is taken into consideration in this model, which assigns their own intercept to each of them, identifying the different characteristics of each company. The companies of the real sector are subject to their own aspects, such as administration, the strategic platform (mission, vision, philosophy, values and principles, among others), the financial platform, and the markets where it has a presence. For Gujarati and Porter (2009), the fixed effects term is reflected on the invariability that each concept has in time, despite the fact that each of these is discriminated for each cut and transversal unit. In this case, the equation of the regression model presents the same structure of formula (2) with Betas determined by:

where,
Each of the Dji with j=2, …, 40 is a Dummy variable for 39 of the 40 companies, given that the remaining company will be represented in the intercept.
Fixed effects estimator within the groupThe objective of this model is to eliminate the heterogeneity between the variables (in this case between the companies chosen as sample), based on the differentiation of the observations through the sample means, in this manner, each individual value is subtracted their respective sample mean, resulting in values that are corrected by the mean.
The equation is the following:
where each xkit with k=2, 3, …, 8 represents the kth variable in differences with respect to its mean. The same happens with the dependent variable. Something worth stressing in this last expression is that the coefficient of the intercept is eliminated, increasing the degrees of freedom of the goodness of fit.Results
The panel data regression models were adjusted through several specifications, fixed effects, random effects and random effects through the maximum likelihood estimator. In this regard, there was no statistical evidence between these two, which indicates that the coefficients are different, therefore, the random effects model was selected, which is adjusted by the software by default.6
The variables were subjected to a winsorization process at 1% to avoid measurement errors in the presence of atypical values.7
Three types of models were estimated. The first for the total number of companies, the second for the companies of the industrial sector, and the third for the companies of the other sectors (agricultural, commercial, construction, and services). This was done in this manner because the industrial sector represents 51.28% of the sample, thus, in order to guarantee a comparison between results and avoid bias in the same, the decision was made to add the other sectors different to the industrial, and adjust two sectorial models, one for the industrial sector and another for the rest of the sectors.
The results of the estimation of the random effects and fixed effects models8 for the entire sample of companies are shown in Table 3.
Model with all the companies (a), companies from the industrial sector (b), and companies from the agricultural, construction, and services sectors (c).
| Variables | All companies | Industrial sector companies | Agriculture, construction and services sectors | |||
|---|---|---|---|---|---|---|
| Random effects | Fixed effects | Random effects | Fixed effects | Random effects | Fixed effects | |
| Size_w | −0.456*** | −0.5495*** | −0.2034*** | −0.7195*** | −0.5535*** | −0.5711*** |
| −0.036 | −0.0386 | −0.0455 | −0.0775 | −0.0341 | −0.0345 | |
| Apalanca_Total_w | 1.222*** | 1.2135*** | 1.2582*** | 1.3827*** | 1.4627*** | 1.4582*** |
| −0.1363 | −0.1362 | −0.2099 | −0.2056 | −0.155 | −0.1563 | |
| Apalanca_LP_w | −0.4954*** | −0.5068*** | −0.3723 | −0.2963 | −0.5797*** | −0.5859*** |
| −0.1741 | −0.1719 | −0.2850 | −0.2677 | −0.1808 | −0.1803 | |
| Crecim_Inver_Ac_Neto_w | 0.0006 | 0.0008 | 0.0158 | −0.0061 | 0.0017 | 0.0018 |
| −0.0037 | −0.0036 | −0.0324 | −0.0303 | −0.0026 | −0.002 | |
| Crecim_Inver_Intang_w | 0.0107 | 0.0342 | −0.1979** | −0.1605* | 0.0561** | 0.0615** |
| −0.0333 | −0.0330 | −0.0957 | −0.0894 | −0.0291 | −0.0290 | |
| CapBur_w | 1.26E−08*** | 1.22E−08*** | 1.25E−08 | 0.000*** | 0.0000*** | 0.0000*** |
| −1.62E−09 | −1.65E−09 | −1.73E−09 | 0 | −8.95 | 0 | |
| Nivel_Expo_w | −0.1696 | −0.2438 | 0.0808 | −0.4298 | −0.5870 | −0.6152 |
| −0.2302 | −0.2414 | −0.2220 | −0.3086 | −0.3857 | −0.3844 | |
| Diversifica_Geografica_w | 0.0970 | 0.0605 | 0.0880 | 0.0675 | 1.4013** | (omitted) |
| −0.1085 | −0.1129 | −0.1231 | −0.1335 | −0.5967 | − | |
| Uso_Derivados_w | 0.6369788** | (omitted) | 0.1770 | (omitted) | 0.8458 | (omitted) |
| −0.2695 | − | −0.1925 | – | −0.5968 | – | |
| Pago_Dividendos_w | −0.0146 | −0.0248 | 0.1108 | 0.0452 | −0.0472 | −0.0483 |
| −0.0412 | −0.0408 | −0.0705 | −0.0688 | −0.0401 | −0.0399 | |
| Rentab_Neta_w | 0.4650*** | 0.4276*** | 0.4769** | 0.2751 | 1.6054*** | 1.5954*** |
| −0.1622 | −0.1599 | −0.2081 | −0.1974 | −0.3947 | −0.3928 | |
| ROIC_w | 0.0012 | 0.0008 | 0.0036* | 0.0007 | −0.0834*** | −0.0838*** |
| −0.0017 | −0.0016 | −0.0021 | −0.0020 | −0.0135 | −0.0134 | |
| Mg_EBITDA_w | 0.0606* | 0.0484 | 0.0962 | 0.0130 | 0.0568* | 0.0565* |
| −0.0319 | −0.0316 | −0.0622 | −0.0600 | −0.0299 | −0.0298 | |
| _cons | 6.3961*** | 8.0008*** | 2.9285*** | 10.5011*** | 7.2878*** | 7.97856*** |
| −0.4652 | −0.5152 | −0.6499 | −1.1174 | −0.4705 | −0.4165 | |
Significance at *1%; **5%; ***10%.
According to this, for the specification of the established model, the variables that have some significant incidence in the value of the company measured by Tobin's q are: size, total and long-term leverage, market capital, use of derivatives (only in the random effects model), net profitability, and EBITDA margin (only in the random effects model).9 The results allow confirming the first hypothesis that if a company utilizes derivatives, its value increases by 6% (random effects model) and by 8% (constant effects model) with respect to those that do not. There is also evidence that additional variables such as the total leverage, market capitalization, net profitability and the EBTIDA margin have a positive effect on the creation of value, whereas size and long-term leverage have a negative effect on the value of the company. The foregoing provides evidence in favor of some aspects of hypothesis number two. Concerning size, the results obtained by Allayannis et al. (2001) and others such as Lang et al. (1993) are confirmed, the sign of which is also negative, even if it is only for the group of companies with sales abroad. This is to be expected due to the fact that the growth of the company through assets does not guarantee that the market value of the same will increase. As mentioned before, the previous results with respect to the leverage vary; in our case, Bessembinder (1991) is confirmed, with regard to the fact that the companies that use derivatives have a greater leverage in comparison with those that do not (32% against 26%). It was not analyzed whether the leverage was in local or foreign currency, but we did confirm the implementation of risk hedging strategies decreases the probability of having to face financial problems related to the payment of interests and debts, since the negative effect on long-term leverage indicates that for every 0.49 pesos that it decreases, the company earns 1 peso in its market value.
Panel (b) of Table 3 presents the results for the sub-sample of companies from the industrial sector. On this occasion, the variables with a statistically significant impact on the value of the company are: size, total leverage, investment growth through intangible assets, market capitalization (only in the fixed effects model), and net profitability and the return on invested capital (both only in the random effects model). Regarding hypotheses one and three, it is not possible to infer anything due to the fact that the variables Use of derivatives and Geographical diversifications are not statistically significant in any of the models.
Finally, in panel (c) of Table 3, the random and fixed effects models are estimated for the sub-sample of companies of the agricultural, commercial, construction, and services sectors. In this model, the statistically significant variables are: size, total leverage, long-term leverage, investment growth through intangible assets, market capitalization, geographical diversification (only in the random effects model), net profitability, return on the invested capital, and the EBITDA margin. In general terms, the results of panel (c) are similar to the ones described in the previous models. The main differences are that the growth of the investment in intangible assets is significant, but with the opposite sign to that found in the model of the companies of the industrial sector, which indicates that in these companies, a good measure to increase the value is the investment in intangible assets when using hedges with derivatives. Another difference is that, in this model, the geographical diversification does have significant effects on the value of the company (or at least in the estimator of random effects, given that the fixed effects model omits it). There is evidence that if a company belongs to this group of sectors and carries out sales abroad and operations with financial derivatives, it will have a higher Tobin's q value, verifying with this the aforementioned hypothesis three. Finally, the coefficient of the variable return on invested capital presents a different sign to that found in the model of the industrial sector companies. In this case, the coefficient is negative, being opposite to what is expected, though its significance is very small (only 10%), which could indicate that this result could be different for a bigger data sample.
Discussion and conclusionsEconometric models are a useful tool for the contrast of hypotheses presented by the economic and, more specifically, the financial theory regarding the variables of the macroeconomic environment and of the company. The panel data models allow evaluating the economic phenomena in two dimensions, since they have transversal cut information and time series. In this work, we make use of this type of models given that there is a database comprised by 39 companies, with information of variables that were measured since the fourth quarter of 2008 until the fourth quarter of 2014.
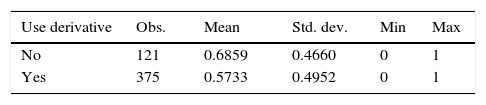
We carried out an estimation exercise to verify if the use of financial derivatives and other variables such as size, leverage, investment growth, level of exposure to international markets, profitability (net profitability, on the invested capital or on net assets) and geographical diversification have any effect on the generation of value in companies, measured through Tobin's q. For this exercise, the analysis is divided into three aspects: the first involves the total of companies in the sample, the second involves only those that belong to the industrial sector, and the third involves those that are in the agricultural, commercial, construction, and services sectors. We found significant evidence that the use of the derivatives is positively associated with the market value of the companies, and generates an approximate value of 6.4% (in the total sample). Similarly, it was possible to state that the total leverage, market capitalization, and net profitability have a positive effect on the generation of value in companies, regardless to the sector they belong. Additionally, it was confirmed that from the total of companies that carry out sales abroad and use derivatives, 75% (375 of 496 companies) have a leverage below the mean of the total (57% approx.). In other words, the companies that do not use derivatives but that carry out sales abroad, have a 68% leverage (11 percentage points above the former; see Annex 3).
It was found that for companies in the agricultural, commercial, construction and services sectors, a good strategy to increase the value of the company is to invest in intangible assets. Meanwhile, for the companies in the industrial sector, a good measure is to try to increase the return on invested capital, as there is evidence that there is a positive relation between this and the value of the company. Concerning geographical diversification, an expected result is observed when there is a positive relation with the market value of the analyzed companies. This is a competitive advantage in terms of knowledge, opportunity and diversification of objectives, but it increases exposure to risk, which should be mitigated with hedging strategies through the derivatives market. Lastly, the payment of dividends shows a positive relation with the market value in all models, which is an unexpected result as the future investments of the companies become limited with a greater payment of dividends. Two general situations are presented: the first is that the large companies that also carry out exports participate more in the derivatives market than the small ones, either because of the their size, experience or maturity, or because they are able to more easily access international markets unlike smaller companies; the second is that the participation in the derivatives market in Colombia is still not very high, and this could be due to the lack of knowledge of derivatives and the hedging strategies that could be used, or to the decisions of the company to use a natural hedge as strategy, because the transaction costs are high or simply because it is of interest to some sectors. Future works could seek to increase the size of the sample of the agricultural, commercial, construction, and services sectors in order to obtain an accurate estimation on the possible effects that the variables considered in this study could have on the market value of said sectors. It is recommended to use other size measurements, or adjust non-linear relations for this variable and thus establish if the negative sign is only due the average value of the same, or if the companies that are micro, small, medium or large have differentiated effects on the value of the company.
Peer Review under the responsibility of Universidad Nacional Autónoma de México.
https://www.bvc.com.co/pps/tibco/portalbvc/Home/Mercados/informesbursatiles?action=dummy – Monthly Market Report of the BVC, June 2016. (Colombia Stock Exchange. Hereinafter BVC, for its acronym in Spanish).
https://www.superfinanciera.gov.co/jsp/loader.jsf?lServicio=Publicaciones&lTipo=publicaciones&lFuncion=loadContenidoPublicacion&id=80102.
This indicator owes its name to James Tobin and William Brainard, who introduced it for the first time in 1968 in their work titled “Pitfalls in Financial Model Building” published in the American Economic Review journal.
At an exchange rate of $2900 they amount to $1313 million USD (USD $478) in Colombia; in Allayannis et al. (2001) the average of the sample is $7701 USD ($6592), respectively.
These results are consistent with those of Allayannis et al. (2001), which in turn are consistent with those of Lang and Stulz (1994) and Servaes (1996).
The estimation exercise was carried out with the help of the STATA13 MP software.
To differentiate the original variables from the winsorized ones, “_w” is written after the name of each variable.
(a) With all the companies, (b) companies in the industrial sector, and (c) companies in the agricultural, construction, and services sectors.
It is worth noting that the results of the estimators are not very different with regard to both magnitude and the sign of the coefficients in both models (random and fixed effects); however, the random effects model manages to capture other impacts like the ones related to the use of derivatives and the EBTIDA margin, therefore, the analysis will focus on its results.