


To create Cumulative Sum learning curves – CUSUM – for 6 anaesthesia procedures.
MethodologyWe assessed 764 orotracheal intubations, 251 spinal anaesthesia procedures, 189 epidural anaesthesia procedures, 143 subclavian vein catheterizations, 135 radial artery catheterizations, and 100 internal jugular catheterizations in 4 anaesthesia residents, and developed CUSUM learning curves.
ResultsIn endotracheal intubation we found the following: 75% of the learners achieved 95% success with 65±24 cases; in spinal anaesthesia, 50% of the learners attained the 85% success rate with 35 cases; in epidural anaesthesia, 100% of the learners attained 80% success with 13±5 cases; in subclavian vein catheterization, 100% of the learners reached 80% success with 21±6 cases; in radial artery catheterization, 25% of the learners achieved an 80% success rate with 39 cases. For internal jugular catheterization it was not possible to collect sufficient information to report statistically significant data.
ConclusionsCUSUM charts are tools that allow monitoring and early detection of changes in psychomotor learning in anaesthesia, providing meaningful information in relation to quality standards.
Crear curvas de aprendizaje de sumatoria acumulada (CUSUM) de 6 procedimientos en anestesiología.
MetodologíaEvaluamos 764 intubaciones orotraqueales, 251 anestesias espinales, 189 anestesias epidurales, 143 cateterizaciones venosas subclavias, 135 cateterizaciones arteriales radiales y 100 cateterizaciones yugulares internas en 4 estudiantes de anestesiología y realizamos curvas de aprendizaje CUSUM.
ResultadosEn intubación orotraqueal encontramos que el 75% de los estudiantes alcanzó el 95% de éxito con la realización de 65 ± 24 casos. En anestesia espinal encontramos que el 50% de los estudiantes alcanzó el 85% de éxito con 35 casos. En A.Epi. encontramos que el 100% de los estudiantes alcanzó el 80% de éxito con 13 ± 5 casos. En cateterización venosa subclavia encontramos que el 100% de los estudiantes alcanzó el 80% de éxito con 21 ± 6 casos. En cateterización arterial radial encontramos que el 25% de los estudiantes alcanzó el 80% de éxito con 39 casos. En cateterización yugular interna no se pudo recoger suficiente información para reportar una información estadísticamente significativa.
ConclusionesLos gráficos CUSUM son herramientas que permiten realizar seguimiento y detección temprana de las variaciones en el aprendizaje psicomotor en anestesia, suministrando información significativa y ajustada a los estándares de calidad.
Psychomotor learning in healthcare is a complex multidimensional function and involves several personal and environmental aspects.1 Moreover, it has a significant social impact and, consequently, objective assessment must be individualized.
The CUSUM graphic model (Cumulative Sum), used as a learning curve, has shown to be a great tool for assessing psychomotor education in healthcare.2–4
CUSUM charts are models that assess time, percentage of success performing a task, considering failure possibilities5 of the evaluation method (e.g. CUSUM) from the standpoint of type 1 and type 2 error, and the ability to be evaluated per se (e.g. endotracheal intubation) from the point of view of acceptable and unacceptable failure probability. In anaesthesiology, CUSUM charts have been used not only to evaluate psychomotor learning but also to describe how it evolves through time in trained and untrained staff.6 The procedures most frequently evaluated are orotracheal intubation,7,8 vascular catheterization,9 and regional anaesthesia.4 However, findings of these studies lead to the conclusion that there is high inter-individual variation when it comes to acquiring a skill in anaesthesia, even in learners analysed using very specific models.1,8 Also, variables such as the institution where the training is done and the number of cases to which the trainee is exposed are the main factors contributing to the acquisition of a skill.1 In view of the above, we asked the following question for this research work: How do learning curves of the CUSUM type work in trainees of our anaesthesia residence course?
ObjectiveTo prepare and analyse psychomotor learning curves in orotracheal intubation, central venous catheterization, radial artery catheterization, and spinal and peridural anaesthesia in anaesthesiology residents at Universidad de Caldas.
Materials and methodsProspective study of control charts of anaesthesiology residents at Universidad de Caldas who trained in the following hospitals: Santa Sofía (level IV), SES-Hospital de Caldas (Level IV) and Clínica Versalles (Level III).
Data were collected over a 23-month period between March 2009 and January 2011 for 4 first-year residents (2 students per year and 11 months of data collection for each student), regarding the following procedures: orotracheal intubation, spinal anaesthesia, epidural anaesthesia, subclavian vein catheterization, internal jugular vein catheterization, and radial artery catheterization. Overall, 1582 procedures were assessed.
All cases to which each of the first-year residents were exposed during their daily practice were included consecutively, excluding cases of paediatric surgery in children under 8 years of age, and cardiac surgery.
Before entering the study, each resident met with the principal investigators in order to be presented with the research proposal and the data collection form (Fig. 1), for an explanation of the anonymous nature of the recording, and the failure and success criteria for each procedure. Questions were also answered and examples were provided about common cases of success and failure in order to clarify the meaning of each of the criteria.

All the residents gave their informed consent in writing for their participation in the research. The study was approved by the Universidad de Caldas Ethics Committee and by the scientific committees of each of the Hospitals where the practices were done. The unit analysis was the resident for whom the procedure record was obtained.
Patients were not given an informed consent on the recommendation of the medical ethics committee, and because the study was conducted in academic organizations under the direct supervision of all the procedures by an attendant anaesthesiologist.
Faculty members (15 in total) who supervised the performance of the procedures in each of the practice hospitals were explained the project and the failure or error criteria for each procedure.
Methodological characteristics of each procedureOrotracheal intubationThe procedure was performed with the patient's head in sniffing position, using a # 3 blade Macintosh laryngoscope and # 7 to #8.5 orotracheal tubes. Correct tube placement was determined using capnography and auscultation. Initially, each learner was guided in the OTI technique by one of the principal investigators, and the first procedure was performed in a SimMan®-type simulation model. After that, each student began to fill the data collection form (Fig. 1) whenever they performed intubation attempts in real patients. Every successful attempt was given a “1” and every failed attempt was given a “0”, under instructor supervision.
The success criteria were the following (adapted from Konrad et al.)1:
- 1.
Total time taken to perform the procedure from the moment pre-oxygenation was over and the correct placement of the device was confirmed: less than 7min.
- 2.
No physical assistance from the instructor (verbal help was allowed).
- 3.
Oxygen saturation greater than 85% during the entire procedure (cases analysed in Manizales at an altitude of 2150m above seal level).
- 4.
Two or less attempts.
The failure criterion was failure to meet the success criteria.
Spinal anaesthesiaInitially, the technique was reviewed verbally with each trainee and then one of the principal investigators guided the student through the procedure in real patients before the trainee was allowed to perform the anaesthesia technique. The procedure required a lumbar puncture with the patient in lateral decubitus and was done using Quincke #25G and 27G spinal needles and local anaesthetics like hyperbaric bupivacaine. Confirmation of the subarachnoid space was made when cerebrospinal fluid return was observed.
Success criteria1:
- 1.
Time from initial puncture until needle removal: less than 10min.
- 2.
Adequate depth of anaesthesia where only conscious sedation was required.
- 3.
No physical assistance from the instructor (verbal assistance allowed).
- 4.
Three (3) or less attempts.
Failure criterion: Failure to meet the success criteria.
Epidural anaesthesiaThe process of explaining the procedure and the way to collect the information was similar to the one used for spinal anaesthesia. It was performed with a lumbar puncture with the patient in lateral decubitus, using the Dogliotti technique with 0.9% NSS, applying loss of resistance with the intermittent technique in order to identify the peridural space. Touhy #18G needles and #20G catheters were used. Catheter location was confirmed through negative aspiration for blood or cerebrospinal fluid and by giving the test dose with local anaesthetic plus epinephrine.
Success criteria1:
- 1.
Time elapsed between the initial puncture and the removal of the needle: Less than 10min.
- 2.
Adequate depth of anaesthesia where only conscious sedation was required.
- 3.
Number of attempts less than, or equal to, 3.
Failure criterion: Failure to meet success criteria.
Radial artery lineThe explanation on the recording and the procedure was similar to that used for spinal anaesthesia. It was performed with the patient in anatomic position and the forearm supported by intravenous bags to achieve hyperextension of the hand, using #18G and #20G venous catheters. Catheter placement was confirmed by direct observation of arterial blood flow through the catheter.
Success criteria1:
- 1.
Time from the initial puncture until the catheter was secured in place: less than 10min.
- 2.
Adequate signal transduction in the invasive pressure monitor.
- 3.
Five (5) punctures or less (adapted by researchers from the 3 proposed in the original work).
Failure criterion: Failure to meet success criteria.
Subclavian vein catheterizationThe procedure was performed with the patient supine in 30 degree Trendelemburg position, using an Aubaniac access and the Seldinger technique. An 18-gauge needle was used and a 20-gauge catheter was advanced. Placement confirmation was made through direct observation of blood flowing from the blood vessel. The explanation regarding the procedure and case recording was similar to that employed for spinal anaesthesia.
Success criteria – Adapted by the researchers from the work by Kestin et al.9:
- 1.
Time from skin puncture to catheter placement: less than 10min.
- 2.
Three (3) punctures or less.
- 3.
Venous return confirmation.
Failure criterion: Failure to meet success criteria.
Internal jugular vein catheterizationThe explanation regarding the procedure and case recording was the same as for spinal anaesthesia. The procedure was performed with the patient supine in 30-degree Trendelemburg position, using the Seldinger technique. The puncture was made with an 18G needle and a 20G catheter was advanced. Site confirmation was made through direct observation of blood flowing from the blood vessel.
Success criteria (adapted by the researchers from the work of Kestin et al.)9:
- 1.
Time from skin puncture to catheter placement: less than 10min.
- 2.
Three (3) punctures or less.
- 3.
Venous return confirmation.
Failure criterion: Failure to meet success criteria.
Procedure for data collection and processing for all the trainees analysedAfter each resident had completed the data collection form (Fig. 1), the records were sent on a monthly basis to one of the investigators, who assigned a number from 1 to 4 to each student. In order to confirm the validity of the information provided by the student, some records were checked randomly with the faculty assigned to the practice centres. The data were analysed (frequency distribution, proportions, chi square) using an Excel 2007 Worksheet, and CUSUM charts were prepared and analysed using the Minitab 15.
Variables analysedVariables by procedure:
- 1.
Institution where the procedure was performed.
- 2.
Time: Time of day when the procedure was completed.
- 3.
Patient age.
- 4.
Patient weight.
- 5.
ASA: Anaesthesia risk classification according to the American Society of Anaesthesiology (I to IV).
- 6.
U-E: Determination of Urgent or Elective intervention.
- 7.
Surgical procedure.
- 8.
Diagnosis: Condition that led to the surgical procedure.
- 9.
Incident: Abnormal event occurring during the procedure and associated with the procedure itself.
- 10.
Rating: 1 or 0 (rating based on the type of procedure).
- 11.
Faculty in charge of supervising the resident for each case.
- 12.
Clarification: Comment from the person completing the form for the specific procedure.
- 13.
Patient gender.
- 14.
Time since the last attempt: time elapsed in days since the last attempt during a procedure until the day of the procedure assessed.
Trainee variables:
- 1.
Gender: male or female.
- 2.
Brain dominance: Hand used for writing more often.
- 3.
Last position: Place of work as general practitioner during the past year before joining the anaesthesia residence program.
- 4.
Prior exposure: Exposure over the past year to the procedures assessed in this study.
- 5.
Manual activities: Any form of prior manual activity, for example, playing the guitar, painting, origami, etc.
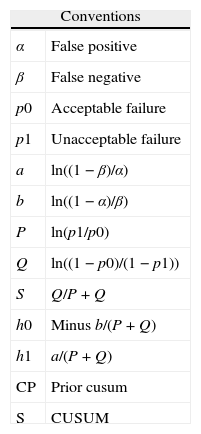
Four things have to be defined when building CUSUM charts: standard error type 1 (α), standard type 2 error (β), the percentage of acceptable failure and the percentage of unacceptable failure rate for every procedure in accordance with the usually accepted quality standard in the area. These values were adjusted according to the models shown in Tables 1 and 3 and the fundamental values obtained were: H0 decision boundary, H1 decision boundary, and the S number.
Conventions. Adjustments for type 1 and type 2 errors, and failure percentages for the calculation of decision boundaries H1, H0, and the S number.
| Conventions | |
| α | False positive |
| β | False negative |
| p0 | Acceptable failure |
| p1 | Unacceptable failure |
| a | ln((1−β)/α) |
| b | ln((1−α)/β) |
| P | ln(p1/p0) |
| Q | ln((1−p0)/(1−p1)) |
| S | Q/P+Q |
| h0 | Minus b/(P+Q) |
| h1 | a/(P+Q) |
| CP | Prior cusum |
| S | CUSUM |
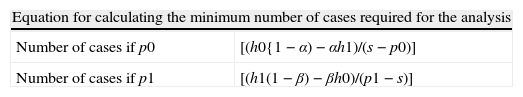
Table 2 shows the equations used to obtain the minimum number of cases needed to assess each procedure, to ensure that the conclusions derived from the charts allow to arrive at an α type 1 error and a β type 2 error. For this study, we used the p0 value (acceptable failure percentage) given that we were looking for the time when the learner achieved and maintained the quality standard for a procedure.
Equation for calculating the minimum number of cases per procedure.
| Equation for calculating the minimum number of cases required for the analysis | |
| Number of cases if p0 | [(h0{1−α)−αh1)/(s−p0)] |
| Number of cases if p1 | [(h1(1−β)−βh0)/(p1−s)] |
P0: acceptable failure; P1: unacceptable failure; H1 Upper decision boundary; H0: Lower decision boundary, and S: CUSUM number; alpha and beta type error.
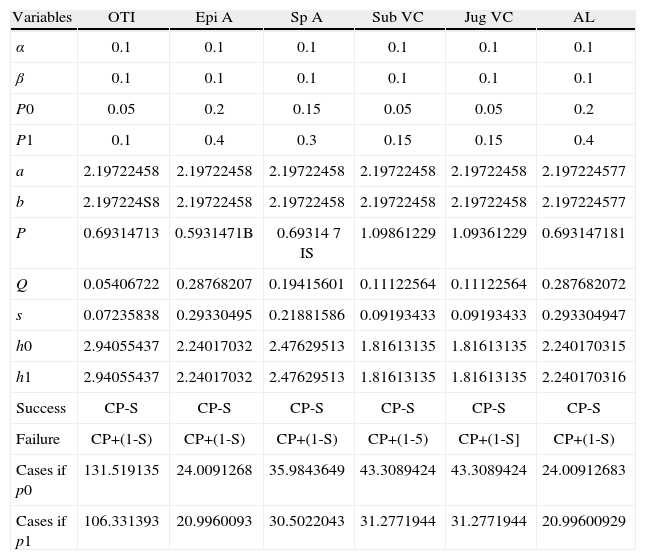
Table 3 shows the values used for type 1 error, type 2 error, failure percentages, and the calculations for H1, H0 and S values.3,7–11
Variables for each procedure analysed.
| Variables | OTI | Epi A | Sp A | Sub VC | Jug VC | AL |
| α | 0.1 | 0.1 | 0.1 | 0.1 | 0.1 | 0.1 |
| β | 0.1 | 0.1 | 0.1 | 0.1 | 0.1 | 0.1 |
| P0 | 0.05 | 0.2 | 0.15 | 0.05 | 0.05 | 0.2 |
| P1 | 0.1 | 0.4 | 0.3 | 0.15 | 0.15 | 0.4 |
| a | 2.19722458 | 2.19722458 | 2.19722458 | 2.19722458 | 2.19722458 | 2.197224577 |
| b | 2.197224S8 | 2.19722458 | 2.19722458 | 2.19722458 | 2.19722458 | 2.197224577 |
| P | 0.69314713 | 0.5931471B | 0.69314 7 IS | 1.09861229 | 1.09361229 | 0.693147181 |
| Q | 0.05406722 | 0.28768207 | 0.19415601 | 0.11122564 | 0.11122564 | 0.287682072 |
| s | 0.07235838 | 0.29330495 | 0.21881586 | 0.09193433 | 0.09193433 | 0.293304947 |
| h0 | 2.94055437 | 2.24017032 | 2.47629513 | 1.81613135 | 1.81613135 | 2.240170315 |
| h1 | 2.94055437 | 2.24017032 | 2.47629513 | 1.81613135 | 1.81613135 | 2.240170316 |
| Success | CP-S | CP-S | CP-S | CP-S | CP-S | CP-S |
| Failure | CP+(1-S) | CP+(1-S) | CP+(1-S) | CP+(1-5) | CP+(1-S] | CP+(1-S) |
| Cases if p0 | 131.519135 | 24.0091268 | 35.9843649 | 43.3089424 | 43.3089424 | 24.00912683 |
| Cases if p1 | 106.331393 | 20.9960093 | 30.5022043 | 31.2771944 | 31.2771944 | 20.99600929 |
Type 1 error values – alpha; Type 2 – beta; Acceptable failure rate: P0; Unacceptable failure rate: P1; H1 Upper decision boundary; H0: Lower decision boundary; and S: CUSUM number for IOT: orotracheal intubation; A. Epi: epidural anaesthesia; A. Esp: spinal anaesthesia; CV Sub; subclavian venous catheter; CV Yug: jugular venous catheter, and LA: arterial line.
Overall, 764 procedures were performed. Trainee 1 made 248 attempts; trainee 2 made 191; trainee 3 made 193; and trainee 4 made 132. All of them reached the minimum number of cases (131) to allow the analysis of a 95% success rate. Crossing the lower decision boundary (H0) from above means that the failure percentage assessed in the trainee does not differ from the expected failure percentage for the procedure. It was presented as follows: trainee 1 achieved it on attempt 41, trainee 2 on attempt 152, trainee 3 on attempt 55, and trainee 4 on attempt 83. In order to ensure that this conclusion has a type 1 and 2 error risk in accordance with the calculations (0.1 and 0.1, respectively) there was a need to wait until at least 131 attempts were made. This was achieved by trainees 1, 3 and 4 without their learning curves crossing decision boundary H0 from below again (see Fig. 2). Trainee 2 crossed the upper decision boundary H1 after attempts 13, 20, 35 and 69, meaning that the measured failure rate differed from the expected percentage. The following associations were found when the learning curves were analysed at that time: low performance during the first 20 attempts and change in patient characteristics (at around attempt 35 there were 4 consecutive patients weighing 120kg or more). With the help of the graph, the 4 low-performance instances were identified, something that would not have been possible had the values been analysed in isolation. Net failure percentages for this procedure were: Trainee 1: 0.5%; trainee 2: 4.2%; trainee 3: 0.5%; and trainee 4: 3%. Failure percentages before and after efficient performance differ significantly according to the test x2 in 75% of the students, with a p value of less than 0.005.
. Green lines: Lower decision boundary H0 (if the learning curve crosses H0 from above, it means that the measured percentage failure does not differ from the acceptable failure rate with a type 1 error equal to α and a type 2 error equal to β). When the student crosses the H0 boundary, it is considered that the proficiency level has been achieved for the procedure assessed.")
CUSUM curves in orotracheal intubation. E1: Trainee 1. E2: Trainee 2. E3: Trainee 3. E4: Trainee 4. Red lines: Upper decision boundary H1 (if the learning curve crosses H1 from below it means that the measured failure percentage is greater than expected and that the process is out of control, and associations must be found). Green lines: Lower decision boundary H0 (if the learning curve crosses H0 from above, it means that the measured percentage failure does not differ from the acceptable failure rate with a type 1 error equal to α and a type 2 error equal to β). When the student crosses the H0 boundary, it is considered that the proficiency level has been achieved for the procedure assessed.
Overall, 251 procedures were assessed. Trainee 1 made 54 attempts, trainee 2 made 62 attempts, trainee 3 made 81 attempts, and trainee 4 made 54 attempts. All of them reached the minimum number of cases (35) to allow the analysis of an 85% success rate. Crossing the lower decision boundary (H0) from above means that the failure rate assessed in the trainee does not differ from the expected failure percentage for the procedure. It was presented as follows: trainee 1 achieved it on attempt 35, trainee 2 did not achieve it, trainee 3 did so on attempt 35, and trainee 4 did not achieve it (Fig. 3). Since trainees 1 and 3 reached the decision boundary at the same time they reached the minimum number of required cases; the conclusion with a type 1 and 2 error risk of 0.1 is that the expected 85% proficiency is reached after performing 35 spinal anaesthesia procedures.
. Green lines: Lower decision boundary H0 (if the learning curve crosses H0 from above, it means that the measured percentage failure does not differ from the acceptable failure rate with a type 1 error equal to α and a type 2 error equal to β). When the student crosses the H0 boundary, it is considered that the proficiency level has been achieved for the procedure assessed.")
CUSUM curve for spinal anaesthesia. E1: trainee 1 blue line, E2: trainee 2 purple line, E3: trainee 3 grey line, and E4: trainee 4 pink line. Note the different behaviours of curves E1 and E3 or E2 and E4, despite the fact that final results are similar. Red lines: Upper decision boundary H1 (if the learning curve crosses H1 from below it means that the measured failure percentage is greater than expected and that the process is out of control, and associations must be found). Green lines: Lower decision boundary H0 (if the learning curve crosses H0 from above, it means that the measured percentage failure does not differ from the acceptable failure rate with a type 1 error equal to α and a type 2 error equal to β). When the student crosses the H0 boundary, it is considered that the proficiency level has been achieved for the procedure assessed.
Trainees 2 and 4 crossed the H1 decision boundary in the following way: Trainee 2 crossed the upper decision boundary after case 11, with a low-performance record in the first case and a long 11-day period of time since the last attempt. During 86% of the assessment period, the trainee remained above 86% and in case 62 the trainee again crossed the decision boundary from above. Trainee 4 crossed H1 from below on case 16 and after returning to the CUSUM chart assessment zone (between H1 in red and H0 in green) again crossed 4 times from below without evidence of a possible cause according to the variables analysed. The net failure percentage for this procedure was: Trainee 1, 9.2%; trainee 2, 25.8%; trainee 3, 8.3%, and trainee 4, 24%. Failure percentage before reaching proficiency for trainees 1 and 3 was 14.3%, consistent with the baseline acceptable failure percentage for this analysis (15%). Trainees 2 and 4 crossed the upper decision boundary, showing low-performance periods, although the behaviour of the two learning curves is completely different, and so is the analysis (Fig. 3).
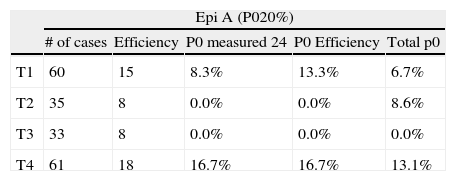
Epidural anaesthesiaOverall, 189 procedures were assessed. Trainee 1 made 60 attempts, trainee 2 made 35 attempts, trainee 3 made 33 attempts, and trainee 4 made 61 attempts. All of them reached the minimum number of cases (24) for the analysis to have an 80% success rate. Crossing the lower decision boundary (H0) from above means that the failure percentage assessed in the trainee does not differ from the expected failure percentage for the procedure. It was presented as follows: trainee 1 reached it on attempt 15; trainee 2 did so in attempt 8, the same as trainee 3. Trainee 4 crossed H0 from above on attempt 18, but again crossed H0 from below on attempt 28, apparently due to a long period of time without training (Fig. 4).
. E1: trainee 1 blue line, E2: trainee 2 purple line, E3: trainee 3 grey line, and E4: trainee 4 pink line. The 4 trainees cross the H0 decision boundary early on before attempt 20, but then begin to show repeated failures. Red lines: Upper decision boundary H1. Green lines: Lower decision boundary H0.")
CUSUM curves for A. Epi (epidural anaesthesia). E1: trainee 1 blue line, E2: trainee 2 purple line, E3: trainee 3 grey line, and E4: trainee 4 pink line. The 4 trainees cross the H0 decision boundary early on before attempt 20, but then begin to show repeated failures. Red lines: Upper decision boundary H1. Green lines: Lower decision boundary H0.
Table 4 shows failure rate measurements in epidural anaesthesia, adjusted for proficiency and the minimum number of cases.
Measured failure percentage (P0) adjusted to the minimum number of cases and the number of cases required to attain proficiency.
| Epi A (P020%) | |||||
| # of cases | Efficiency | P0 measured 24 | P0 Efficiency | Total p0 | |
| T1 | 60 | 15 | 8.3% | 13.3% | 6.7% |
| T2 | 35 | 8 | 0.0% | 0.0% | 8.6% |
| T3 | 33 | 8 | 0.0% | 0.0% | 0.0% |
| T4 | 61 | 18 | 16.7% | 16.7% | 13.1% |
Note the big difference between the calculated failure percentage (quality standard) and the measured percentage. A Epi: epidural anaesthesia. E1: trainee 1; E2: trainee 2; E3: trainee 3; E4: trainee 4.
Overall, 143 procedures were assessed: 54 in trainee 1, 24 in trainee 2, 34 in trainee 3, and 31 in trainee 4. For an expected 95% success rate according to the quality standards, only trainee 3 crossed decision boundary H0 in attempt 31, with a measured failure rate of 3%. Trainees 1 and 4 remained within the decision boundaries after 54 and 31 attempts, respectively, and no statistical inferences were possible for either of the two. Trainee 2 crossed the H1 decision boundary twice, showing low-performance periods associated with low prior performance and long periods without training (second time H1 is crossed from below) (Fig. 5).
. E1: trainee 1 blue line, E2: trainee 2 purple line, E3: trainee 3 grey line, and E4: trainee 4 pink line. Trainee 3 crosses H1, but does not reach the minimum number of cases required for the analysis. E1 and E4: Within decision boundaries, no inferences. E2: Crosses the lower decision boundary. Red lines: Upper decision boundary H1. Green lines: Lower decision boundary H0.")
CUSUM curves for subclavian vein catheter (CV Sub). E1: trainee 1 blue line, E2: trainee 2 purple line, E3: trainee 3 grey line, and E4: trainee 4 pink line. Trainee 3 crosses H1, but does not reach the minimum number of cases required for the analysis. E1 and E4: Within decision boundaries, no inferences. E2: Crosses the lower decision boundary. Red lines: Upper decision boundary H1. Green lines: Lower decision boundary H0.
In order to reach an 85% success rate, with an unacceptable 30% failure rate, trainee 1 required 26 cases. In order for trainees 2 and 4 to reach an 80% success rate with an unacceptable 40% failure percentage, they needed 22 and 16 cases, respectively.
Internal jugular vein catheterizationOverall, 100 cases were analysed. Of those, trainee 1 performed 58, trainee 2 performed 20, trainee 3 performed 13, and trainee 4 performed 9. Internal jugular vein catheterization is the procedure to which anaesthesia residents are least exposed at Universidad de Caldas. Of the total number of procedures, 58% were performed by trainee 1. The measured net failure percentage was 10% for trainee 1, 30% for trainee 2, 8% for trainee 3, and 23% for trainee 4, all of them above the expected 5% value. None of the students achieved the 95% success rate for this procedure over the study period. After 58 attempts, trainee 1 remained within the decision boundaries and it was not possible to make any statistical inference, as was the case also for trainee 3. Trainees 2 and 4 crossed the H1 decision boundary in case 9, and this was associated with low performance in previous observations (see Fig. 6).

CUSUM curves for CV Yug: internal jugular vein catheter. E1 and E3 remain within the decision boundaries. E2 and E4 cross the upper decision boundary H1 after the ninth attempt. Few cases for analysis. E1: trainee 1 blue line, E2: trainee 2 purple line, E3: trainee 3 grey line, and E4: trainee 4 pink line. Red lines: Upper decision boundary H1. Green lines: Lower decision boundary H0.
In order for trainee 1 to reach 85% success with an unacceptable 30% failure rate, 20 cases were needed. In order for trainee 2 to reach a 79% success rate with an unacceptable 55% failure rate, 25 cases of internal jugular vein catheterization were needed.
Radial artery lineOverall, 135 cases were analysed, as follows: trainee 1, 62; trainee 2, 40; trainee 3, 11; and trainee 4, 22. Trainee 1 was the only one who crossed the H0 boundary after case 39, with an 80% success rate. Trainees 2 and 3 remained within the H1 and H0 decision boundaries, but it was not possible to perform a statistical analysis for the acceptable 20% failure rate expected for this procedure. Trainee 4 crossed the upper decision boundary in cases 13 and 16, associated with a long time period without training (32 days) (see Fig. 7).

CUSUM curves of LA: radial arterial line. E1: Student 1 blue line, E2: 2 purple line student, E3: Student 3 gray line and E4: 4 pink line student. Student 1 decision line crosses H0. Student 2 remains within the limits of decision for a long time, with a pattern of learning zigzag. Red lines: Upper limit H1 decision. Green lines: Lower limit decision H0.
To achieve a success rate of 70% with an unacceptable 50% failure rate, trainee 2 needed 20 cases of the 40 that were assessed, while trainee 4 required 22 cases, showing statistically significant differences in failure rates before trainee 2 achieved proficiency.
Secondary resultsIncidents associated with the proceduresOrotracheal intubation: The total percentage of incidents in orotracheal intubation was 1.31%, and the most frequent were hypertension (2 cases) and laryngospasm (2 cases).
Epidural anaesthesia: The total percentage of incidents was 7.41%, and the most frequent incident was hypotension (6 cases). Accidental dura mater rupture occurred in 1.1% of the cases (2 cases).
Spinal anaesthesia: The total percentage of incidents was 8.37%, and the most frequent was hypotension (16 cases). Traumatic puncture occurred in 1.2% of the cases.
Subclavian vein catheterization: The total percentage of incidents was 0.7%.
Internal jugular vein catheterization: The total percentage of incidents was 1% (punctured carotid artery).
Radial artery line: The total percentage of incidents was 1.48%.
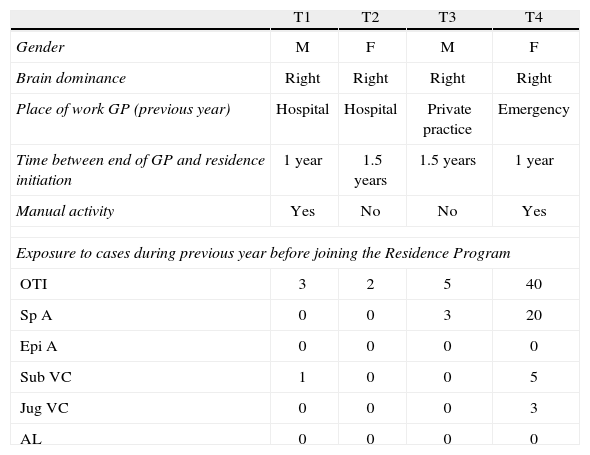
Individual variablesTable 5 shows the underlying characteristics of the learners analysed.
Personal variables of the residents analysed.
| T1 | T2 | T3 | T4 | |
| Gender | M | F | M | F |
| Brain dominance | Right | Right | Right | Right |
| Place of work GP (previous year) | Hospital | Hospital | Private practice | Emergency |
| Time between end of GP and residence initiation | 1 year | 1.5 years | 1.5 years | 1 year |
| Manual activity | Yes | No | No | Yes |
| Exposure to cases during previous year before joining the Residence Program | ||||
| OTI | 3 | 2 | 5 | 40 |
| Sp A | 0 | 0 | 3 | 20 |
| Epi A | 0 | 0 | 0 | 0 |
| Sub VC | 1 | 0 | 0 | 5 |
| Jug VC | 0 | 0 | 0 | 3 |
| AL | 0 | 0 | 0 | 0 |
E1: trainee 1; E2: trainee 2; E3: trainee 3; E4: trainee 4. MG: general practitioner. IOT: orotracheal intubation. A Esp: Spinal anaesthesia. A Epi: epidural anaesthesia. CV Sub: subclavian venous catheter. CV Yug: jugular venous catheter. LA: arterial line.
Statistical analyses of these personal variables revealed that the number of cases was insufficient to arrive at statistically significant conclusions.
Procedure-related variablesAge, weight and ASA risk were homogenously distributed among the cases analysed. Variables associated with the procedure and diagnosis were not analysed in detail, given that the overall analysis did not reveal an association and the published studies do not recommend particular analyses. Analysis by supervising faculty was not possible because failure values were very few when divided among the supervising faculty. The organization variable showed that Institution 1 was the place where students had most frequent failures (each institution was assigned a random number for the analysis). However, the failure rate in that institution was 30%, very similar to the time the residents remained in that institution during the assessment period (27%).
Discussion and conclusionsLearning of psychomotor components in anaesthesiology must be assessed and monitored12 using special tools that help determine skill acquisition and their adjustment in accordance with top quality standards.13
The CUSUM learning curve is a healthcare education tool that helps assess and conduct continuous follow-up of the acquisition and maintenance of psychomotor skills.14–17
In anaesthesiology, CUSUM learning curves vary widely among learners,4–6,8 reflecting the influence of individual variables. Moreover, the number of cases needed to achieve the success rate also varies among the different studies.1,4,7–9,18
In orotracheal intubation, Konrad et al.1 showed that 57 attempts are required to achieve a 90% success rate. Olivera et al.8 showed that 9–88 attempts are required to achieve an 80% success rate. Using a 90% success rate, Bouchacort et al.7 showed that 41 attempts were required to reach proficiency; however, they also showed that if the success rate increased to 95%, the range of attempts required to reach it varies between 41 and 128 attempts.
In our study we used 95% as the percentage of success for orotracheal intubation6 considering that this is the first research work conducted in our country using the CUSUM model, and considering that we wanted to determine the general learning behaviour for this skill. Of the students, 25% needed less than 41 attempts, consistent with the findings by Bouchacort; another 25% needed 55 attempts, consistent with the findings by Konrad. However, in order to give validity to these conclusions, each learner had to complete 131 attempts, the point at which 75% of the students analysed reached the 95% success rate with a type 1 and 2 error of 0.1. We did not delve deeper into the analysis of the relationship between the learning process and patient-related variables, because these variables are statistically incorporated in the acceptable and unacceptable failure rates in the calculations used.
We found evidence of a relationship between the institution variable and the possibility of failure. However, after subgroup analysis it was not possible to arrive at a conclusion regarding that relationship between the periods of time the trainees remained in each institution and the number of failed attempts before and after 20 cases.
We observed an apparent relationship between the lower number of cases required to reach proficiency and the following variables: degree of prior exposure to the procedures assessed, being of male gender, having worked in the emergency department over the previous year, and performing manual activities. However, considering that only 4 students were assessed, significance analyses were not possible.
In conductive anaesthesia we found similar values to those by Olivera;8 however, CUSUM charts (Fig. 4) enabled us to show the risk of arriving at proficiency conclusions before reaching the minimum number of cases needed.
In order to reach the 95% success rate in central venous catheterization as proposed by Kestin,9 there is a need to analyse 131 cases per learner, something that was not even possible in the original research. In our study, 12.5% of the trainees analysed reached the proficiency level but without performing the minimum number of cases required for arriving at a valid conclusion. Consequently, we analysed this performance in relation to an 80% success rate, showing that in subclavian vein catheterization, 100% of the learners reached the proficiency level after 20±4 cases with 1 and 2-type error of 0.1. Our results on radial artery catheterization differ significantly from those of Konrad and Kestin. In our study, 25% reached the expected proficiency of 80% after 39 cases.
The main boundary of this study was the small number of trainees analysed, only 2 residents per year. Although case recording was checked with the faculty and the researchers, it allowed some room for subjectivity.
We concluded that CUSUM charts are the best tools currently available for assessing psychomotor learning in anaesthesiology. They provide step-by-step data and comparisons with quality standards; they take into consideration learning evolution in time; provide immediate visual assessment of the behaviour; deliver specific performance values with complex statistical analyses; and they offer early identification of low-performance or proficiency instances, allowing for comparison with other variables.
We wish to express our appreciation to the anaesthesia residents and faculty at Universidad de Caldas.
FundingNone.
Conflicts of interestThe authors have no conflicts of interest to declare.
Please cite this article as: Ospina ODA, Medina ÁMR, Marulanda MC, Buitrago LMG. Curvas de Aprendizaje CUSUM en procedimientos básicos de anestesia. Rev Colomb Anestesiol. 2014;42:142–153.