


The analytical reports issued by the clinical laboratory are a vital tool for guiding clinicians as to which lipid profile values should be considered abnormal and therefore require intervention. Unfortunately, the lipid values that are reported as “normal, desirable, recommended or reference” vary greatly from laboratory to laboratory. This can hinder the clinical decision-making process and act as a barrier to achieving therapeutic goals in cardiovascular disease prevention. A recent international recommendation added a new heterogeneity factor to the interpretation of the lipid profile, namely the option of measuring lipids without previously fasting. All of the above underpins the need to compile a document that adapts our current knowledge to the clinical practice of the Spanish health system. In this regard, professionals from various scientific societies involved in the measurement and use of lipid profile data have drafted this document to propose a series of recommendations to facilitate their standardisation.
Los informes analíticos del laboratorio clínico son claves para orientar a los médicos clínicos sobre qué valores del perfil lipídico se han de considerar alterados y, por tanto, requieren intervención. Desafortunadamente, existe una gran heterogeneidad en los valores de lípidos que los laboratorios clínicos reportan como «normales, deseables, recomendables o de referencia». Ello puede dificultar la toma de decisiones clínicas y ser una barrera para la consecución de los objetivos terapéuticos en prevención cardiovascular. Una reciente recomendación internacional añade un nuevo factor de heterogeneidad en la interpretación del perfil lipídico, como es la posibilidad de medirlo sin ayuno previo. Todo ello justifica la necesidad de desarrollar un documento que adapte el conocimiento existente a la práctica clínica de nuestro sistema sanitario. En este sentido, profesionales de diferentes sociedades científicas implicadas en la medida y utilización de los datos del perfil lipídico han desarrollado el presente documento para establecer unas recomendaciones que faciliten la homogenización del mismo.
The concentration of lipid components reported as “normal, desirable, recommendable or reference” vary greatly from clinical laboratory to clinical laboratory, whether in secondary care or primary care, the public healthcare sector or the private. This heterogeneity may give rise to erroneous clinical decisions that could directly affect quality of healthcare. In this regard, professionals from various scientific societies involved in the obtaining and use of lipid profile data have drafted this document to propose a series of recommendations to facilitate their standardisation. The main objectives of the document were:
- 1.
To present the most recent epidemiological dyslipidaemia data in Spain.
- 2.
To highlight the importance of achieving lipid therapeutic targets and to describe the primary barriers to their attainment.
- 3.
To detail the preanalytical, analytical and post-analytical factors that influence the interpretation of the lipid profile.
- 4.
To recommend the components of the lipid profile and the reference values that should be included in the analytical reports.
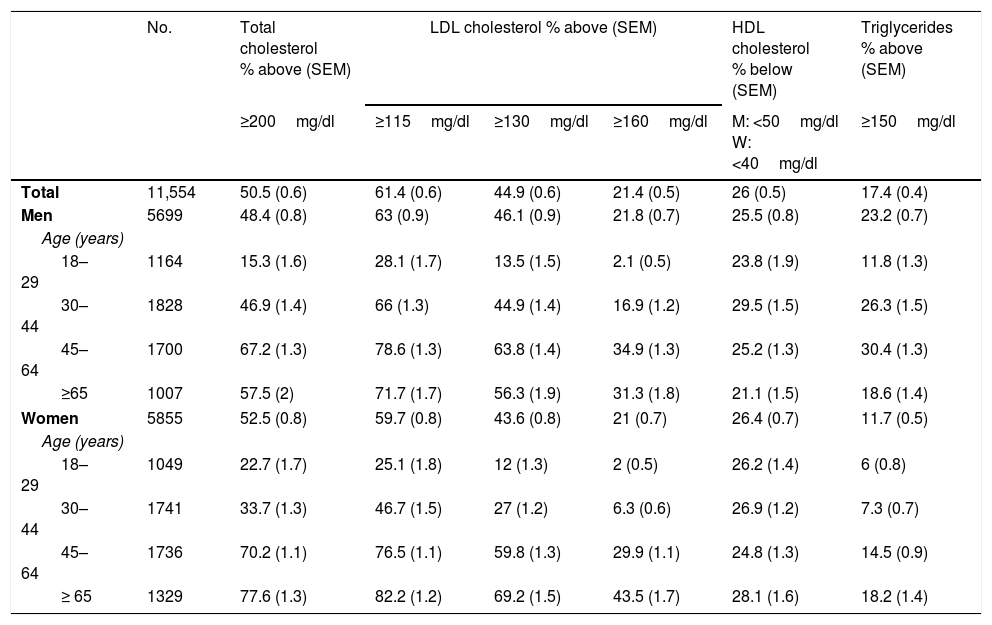
The most recent population study on cardiovascular risk factors to be conducted in Spain was the “Nutrition and Cardiovascular Risk Study in Spain” (ENRICA). Performed between June 2008 and October 2010, it enrolled 11,554 subjects ≥18 years, representative of the Spanish population.1 The blood samples for the lipid profile were obtained after fasting for 12h and were analysed in a central laboratory. Table 1 shows total cholesterol, low-density lipoprotein cholesterol (LDL-C), high-density lipoprotein cholesterol (HDL-C) and triglyceride concentrations stratified by age and gender.
Prevalence of dyslipidaemia in the Spanish population over the age of 18 years, stratified by age and gender in the ENRICA study.a Results expressed as % above or below the recommended limits of the various lipid variables or pharmacological treatment for their control.
| No. | Total cholesterol % above (SEM) | LDL cholesterol % above (SEM) | HDL cholesterol % below (SEM) | Triglycerides % above (SEM) | |||
|---|---|---|---|---|---|---|---|
| ≥200mg/dl | ≥115mg/dl | ≥130mg/dl | ≥160mg/dl | M: <50mg/dl W: <40mg/dl | ≥150mg/dl | ||
| Total | 11,554 | 50.5 (0.6) | 61.4 (0.6) | 44.9 (0.6) | 21.4 (0.5) | 26 (0.5) | 17.4 (0.4) |
| Men | 5699 | 48.4 (0.8) | 63 (0.9) | 46.1 (0.9) | 21.8 (0.7) | 25.5 (0.8) | 23.2 (0.7) |
| Age (years) | |||||||
| 18–29 | 1164 | 15.3 (1.6) | 28.1 (1.7) | 13.5 (1.5) | 2.1 (0.5) | 23.8 (1.9) | 11.8 (1.3) |
| 30–44 | 1828 | 46.9 (1.4) | 66 (1.3) | 44.9 (1.4) | 16.9 (1.2) | 29.5 (1.5) | 26.3 (1.5) |
| 45–64 | 1700 | 67.2 (1.3) | 78.6 (1.3) | 63.8 (1.4) | 34.9 (1.3) | 25.2 (1.3) | 30.4 (1.3) |
| ≥65 | 1007 | 57.5 (2) | 71.7 (1.7) | 56.3 (1.9) | 31.3 (1.8) | 21.1 (1.5) | 18.6 (1.4) |
| Women | 5855 | 52.5 (0.8) | 59.7 (0.8) | 43.6 (0.8) | 21 (0.7) | 26.4 (0.7) | 11.7 (0.5) |
| Age (years) | |||||||
| 18–29 | 1049 | 22.7 (1.7) | 25.1 (1.8) | 12 (1.3) | 2 (0.5) | 26.2 (1.4) | 6 (0.8) |
| 30–44 | 1741 | 33.7 (1.3) | 46.7 (1.5) | 27 (1.2) | 6.3 (0.6) | 26.9 (1.2) | 7.3 (0.7) |
| 45–64 | 1736 | 70.2 (1.1) | 76.5 (1.1) | 59.8 (1.3) | 29.9 (1.1) | 24.8 (1.3) | 14.5 (0.9) |
| ≥ 65 | 1329 | 77.6 (1.3) | 82.2 (1.2) | 69.2 (1.5) | 43.5 (1.7) | 28.1 (1.6) | 18.2 (1.4) |
SEM: standard error of the mean.
53.6% of subjects with elevated LDL-C were informed of the findings. 44.1% of this group (23.6% of all patients with high cholesterol) were treated with lipid-lowering drugs and, of these, 55.7% (13.2% of all patients with high cholesterol) achieved control target levels. The percentage of subjects with elevated LDL-C levels increased with age and with the number of specialist appointments but decreased in subjects with diabetes (risk ratio [RR] of 0.38, 95% confidence interval [CI], 0.28–0.53) or with cardiovascular disease (RR 0.55; 95% CI, 0.33–0.92). The degree of control of triglyceride and HDL-C concentrations is also low in Spain. A prospective study of patients with triglyceridaemia >2.25mmol/l (200mg/dl) treated at specialised lipid units found that after one year of treatment, triglyceride levels had fallen to below 2.25mmol/l in just 44% of patients.2 A similar study found that only 16% of patients with elevated triglycerides and low HDL-C met the therapeutic goals for both abnormalities at the last follow-up visit.3
Importance of achieving the control targetsMortality due to ischaemic heart disease is directly linked to LDL-C concentration. No lower LDL-C threshold seems to exist in this correlation below which cardiovascular risk does not decrease but rather increases (the so-called “J curve” that holds true for most biological variables). The lack of a lower threshold has led to ever-lower LDL-C target values being set.4 The meta-analysis of the Cholesterol Treatment Trialists’ Collaborators showed that for each mmol/l (38.7mg/dl) drop in LDL-C concentration, a 20–25% annual fall in fatal cardiovascular disease is observed after the first year of treatment. As such, with the drugs currently available that are capable of reducing LDL-C by 2mmol/l (77.4mg/dl), the risk of severe cardiovascular disease could be practically halved.5 In absolute terms, treating 10,000 patients with high cardiovascular risk for five years and reducing LDL-C levels by 2mmol/l (77.4mg/dl) could prevent severe cardiovascular disease in 1000 secondary prevention patients and in 500 patients in primary prevention. In the case of treatment with statins, the longer the treatment, the greater the absolute benefit, as these drugs continuously reduce cardiovascular events for each year of treatment.
A recent meta-regression study analysed the impact of treatment with statins and other lipid-lowering drugs in 312,175 participants presenting with 39,645 severe cardiovascular events from 49 studies. It was found that following a fall in LDL-C levels of 1mmol/l (38.7mg/dl), the RR of severe cardiovascular events after five years of treatment was 0.77 (95% CI, 0.71–0.84; p<0.001) for subjects treated with statins and 0.75 (95% CI, 0.66–0.86; p=0.002) for other strategies that reduced LDL-C (diet, bile acid sequestrants, ileal bypass and ezetimibe). As such, the use of statins and non-statin treatments that act by regulating LDL receptor expression are associated with a similar fall in cardiovascular risk due to reduced LDL-C levels.6
A Danish population study that included more than 600,000 inhabitants who had started treatment with statins found that treatment discontinuation was associated with an increased risk of myocardial infarction (RR 1.26; 95% CI, 1.21–1.30) and cardiovascular death (RR 1.18; 95% CI, 1.14–1.23).7 In the United Kingdom, the publication of findings that statins could cause side effects in 20% of patients led to an 11% increase in treatment discontinuation by patients in secondary prevention and a 12% increase in primary prevention patients. It is estimated that in the subsequent 10 years, the number of cardiovascular complications could increase by at least 2100 events.8
Studies that assess control targets in cardiovascular disease preventionThe EUROASPIRE IV study, which included 16,426 patients with coronary heart disease from 24 European countries, revealed that 80.5% of patients had LDL-C levels ≥1.81mmol/l (70mg/dl) despite the fact that 85.7% were taking statins.9
A comparison of two national registries (the TRECE registry in 2006 and the REPAR registry in 2014) found that the attainment of an LDL-C target of <1.81mmol/l (70mg/dl) increased from 9.5% in 2006 to 27.3% in 2014, coinciding with an increased use of statins from 69% to 96% and high-dose statin therapy from 10.5% to 42.8%.10
Finally, the EURIKA study, which included 7641 patients in primary prevention from 12 European countries,11 found that only 65.3% of high-risk patients (on lipid-lowering therapy or with a ≥5% risk according to the SCORE tables) were receiving lipid-lowering therapy and of these, 61.3% had LDL-C levels ≥2.58mmol/l (100mg/dl). For very high-risk patients (≥10% according to the SCORE tables and/or diabetes), only 49.5% were receiving lipid-lowering therapy and of these, 82.9% had LDL-C levels ≥1.81mmol/l (70mg/dl).
Lipid profile. Preanalytical variabilityPreanalytical variability could affect any clinical chemistry variable of a particular subject due to the influence of various conditions, which could in turn affect the results of the lab tests and lead to errors in their interpretation. To minimise this variability, standardising the conditions to which subjects are exposed prior to analysing the variable is recommended.
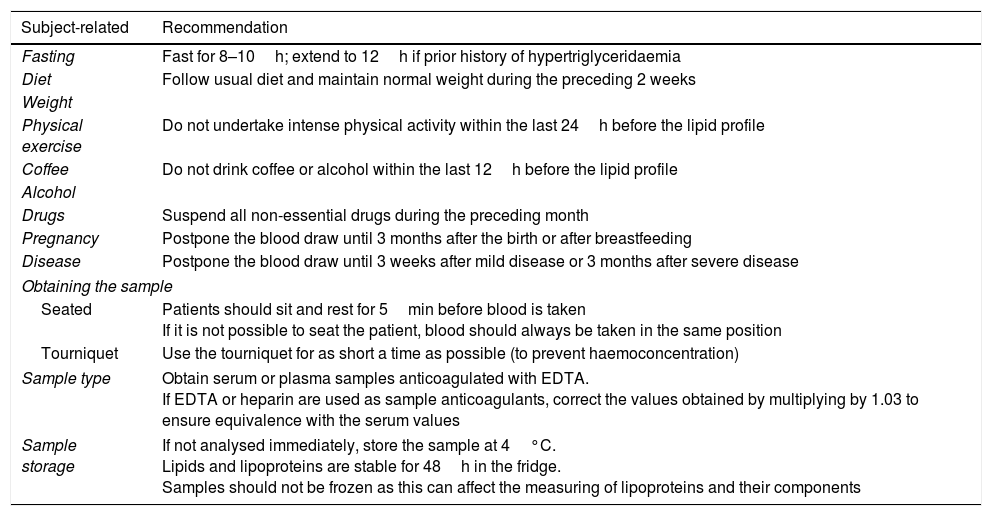
Multiple factors associated with the individual and with the blood sample itself and how it was obtained can give rise to preanalytical variability, thereby affecting the lipid profile. Table 2 details the conditions associated with the individual and the obtaining and storage of the sample that could influence lipid concentrations, as well as recommendations to minimise variability.
Preanalytical conditions that may affect the determination of components of the lipid profile.
| Subject-related | Recommendation |
|---|---|
| Fasting | Fast for 8–10h; extend to 12h if prior history of hypertriglyceridaemia |
| Diet | Follow usual diet and maintain normal weight during the preceding 2 weeks |
| Weight | |
| Physical exercise | Do not undertake intense physical activity within the last 24h before the lipid profile |
| Coffee | Do not drink coffee or alcohol within the last 12h before the lipid profile |
| Alcohol | |
| Drugs | Suspend all non-essential drugs during the preceding month |
| Pregnancy | Postpone the blood draw until 3 months after the birth or after breastfeeding |
| Disease | Postpone the blood draw until 3 weeks after mild disease or 3 months after severe disease |
| Obtaining the sample | |
| Seated | Patients should sit and rest for 5min before blood is taken If it is not possible to seat the patient, blood should always be taken in the same position |
| Tourniquet | Use the tourniquet for as short a time as possible (to prevent haemoconcentration) |
| Sample type | Obtain serum or plasma samples anticoagulated with EDTA. If EDTA or heparin are used as sample anticoagulants, correct the values obtained by multiplying by 1.03 to ensure equivalence with the serum values |
| Sample storage | If not analysed immediately, store the sample at 4°C. Lipids and lipoproteins are stable for 48h in the fridge. Samples should not be frozen as this can affect the measuring of lipoproteins and their components |
EDTA: ethylenediaminetetraacetic acid.
Fasting. Assessing the lipid profile is usually recommended after fasting for 8–10h if the patient has no known hypertriglyceridaemia. If the sample is not obtained after fasting, the total cholesterol and HDL-C results are still valid but the concentration of triglycerides and very low-density lipoprotein cholesterol (VLDL-C) could increase and chylomicronaemia could be identified. Population studies that have compared the lipid profiles of subjects who fasted to subjects who did not fast found increased triglyceride concentrations of 0.3mmol/l (26.6mg/dl) and a fall in total cholesterol, LDL-C and non-HDL cholesterol of 0.2mmol/l (7.74mg/dl) for each of them.
In hypertriglyceridaemia, true LDL-C concentrations appear reduced if they are calculated using the Friedewald formula (the reasons for this reduction are detailed below). This inaccuracy does not just affect postprandial hypertriglyceridaemia, but all hypertriglyceridaemias associated with diabetes, metabolic syndrome or chronic kidney disease, as well as familial hypertriglyceridaemia and mixed dyslipidaemia (combined) with increased triglycerides and cholesterol. LDL-C concentrations can only be accurately measured using complex methods such as ultracentrifugation, which is not available at all clinical laboratories.
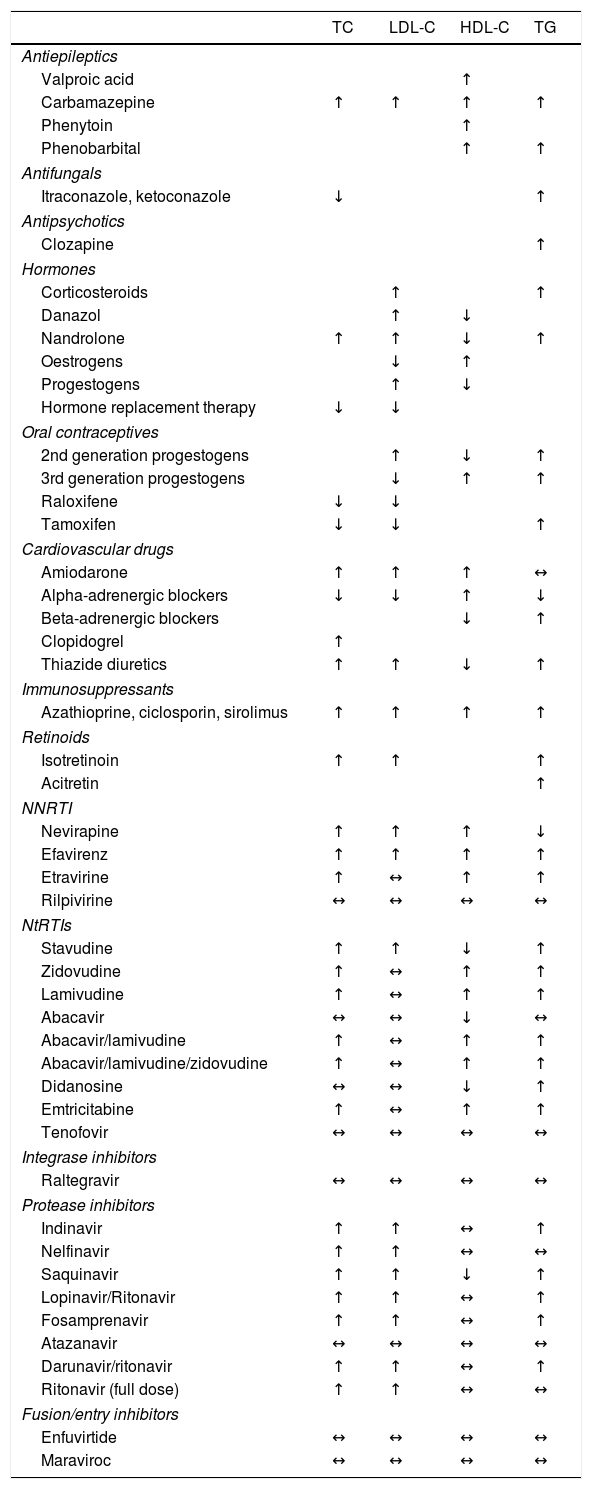
Recent guidelines issued by the European Atherosclerosis Society (EAS) and the European Federation of Clinical Chemistry and Laboratory Medicine (EFLM) recommended that fasting is not always required for determination of a lipid profile.12 Obtaining samples after fasting is only recommended if triglyceride levels are in excess of 5.0mmol/l (443mg/dl). However, the problem with following this recommendation is not knowing the subject's triglyceride concentrations in advance. Fasting should also be considered if glucose or other variables are to be determined from a single sample, which is often the case in subjects with diabetes. Levels of HDL-C, apolipoproteins (apo) A-I and B and lipoprotein(a)–Lp(a)–are not significantly affected by not fasting. It is standard practice for samples to be obtained after fasting in our setting. If this is not the case, this should be reflected in the analytical report. Drug use should also be recorded. Its effects on various lipid variables are detailed in Table 3.
Effect of different lipid-lowering drugs on the lipid profile.
| TC | LDL-C | HDL-C | TG | |
|---|---|---|---|---|
| Antiepileptics | ||||
| Valproic acid | ↑ | |||
| Carbamazepine | ↑ | ↑ | ↑ | ↑ |
| Phenytoin | ↑ | |||
| Phenobarbital | ↑ | ↑ | ||
| Antifungals | ||||
| Itraconazole, ketoconazole | ↓ | ↑ | ||
| Antipsychotics | ||||
| Clozapine | ↑ | |||
| Hormones | ||||
| Corticosteroids | ↑ | ↑ | ||
| Danazol | ↑ | ↓ | ||
| Nandrolone | ↑ | ↑ | ↓ | ↑ |
| Oestrogens | ↓ | ↑ | ||
| Progestogens | ↑ | ↓ | ||
| Hormone replacement therapy | ↓ | ↓ | ||
| Oral contraceptives | ||||
| 2nd generation progestogens | ↑ | ↓ | ↑ | |
| 3rd generation progestogens | ↓ | ↑ | ↑ | |
| Raloxifene | ↓ | ↓ | ||
| Tamoxifen | ↓ | ↓ | ↑ | |
| Cardiovascular drugs | ||||
| Amiodarone | ↑ | ↑ | ↑ | ↔ |
| Alpha-adrenergic blockers | ↓ | ↓ | ↑ | ↓ |
| Beta-adrenergic blockers | ↓ | ↑ | ||
| Clopidogrel | ↑ | |||
| Thiazide diuretics | ↑ | ↑ | ↓ | ↑ |
| Immunosuppressants | ||||
| Azathioprine, ciclosporin, sirolimus | ↑ | ↑ | ↑ | ↑ |
| Retinoids | ||||
| Isotretinoin | ↑ | ↑ | ↑ | |
| Acitretin | ↑ | |||
| NNRTI | ||||
| Nevirapine | ↑ | ↑ | ↑ | ↓ |
| Efavirenz | ↑ | ↑ | ↑ | ↑ |
| Etravirine | ↑ | ↔ | ↑ | ↑ |
| Rilpivirine | ↔ | ↔ | ↔ | ↔ |
| NtRTIs | ||||
| Stavudine | ↑ | ↑ | ↓ | ↑ |
| Zidovudine | ↑ | ↔ | ↑ | ↑ |
| Lamivudine | ↑ | ↔ | ↑ | ↑ |
| Abacavir | ↔ | ↔ | ↓ | ↔ |
| Abacavir/lamivudine | ↑ | ↔ | ↑ | ↑ |
| Abacavir/lamivudine/zidovudine | ↑ | ↔ | ↑ | ↑ |
| Didanosine | ↔ | ↔ | ↓ | ↑ |
| Emtricitabine | ↑ | ↔ | ↑ | ↑ |
| Tenofovir | ↔ | ↔ | ↔ | ↔ |
| Integrase inhibitors | ||||
| Raltegravir | ↔ | ↔ | ↔ | ↔ |
| Protease inhibitors | ||||
| Indinavir | ↑ | ↑ | ↔ | ↑ |
| Nelfinavir | ↑ | ↑ | ↔ | ↔ |
| Saquinavir | ↑ | ↑ | ↓ | ↑ |
| Lopinavir/Ritonavir | ↑ | ↑ | ↔ | ↑ |
| Fosamprenavir | ↑ | ↑ | ↔ | ↑ |
| Atazanavir | ↔ | ↔ | ↔ | ↔ |
| Darunavir/ritonavir | ↑ | ↑ | ↔ | ↑ |
| Ritonavir (full dose) | ↑ | ↑ | ↔ | ↔ |
| Fusion/entry inhibitors | ||||
| Enfuvirtide | ↔ | ↔ | ↔ | ↔ |
| Maraviroc | ↔ | ↔ | ↔ | ↔ |
HDL-C: high-density lipoprotein cholesterol; LDL-C: low-density lipoprotein cholesterol; NNRTI: non-nucleoside reverse-transcriptase inhibitors; NtRTIs: nucleotide analogue reverse-transcriptase inhibitors; TC: total cholesterol; TG: triglycerides.
Which components should be measured? The lipid profile for an initial dyslipidaemia assessment should include total cholesterol, triglycerides and HDL-C. These findings can then be used to calculate LDL-C assuming the absence of hypertriglyceridaemia, as well as non-HDL cholesterol (total cholesterol – HDL-C). Non-HDL cholesterol includes intermediate-density lipoprotein cholesterol (IDL-C), LDL cholesterol, VLDL cholesterol and Lp(a) cholesterol, i.e. all atherogenic cholesterol.
In subjects with hypertriglyceridaemia in whom the LDL-C determination could be inaccurate due to the methodology used, determining non-HDL cholesterol and apoB, which is equivalent to non-HDL cholesterol but more expensive, are the other valid alternatives. The European Society of Cardiology (ESC) and the European Atherosclerosis Society (EAS) recommend calculating non-HDL cholesterol in these clinical scenarios.13
Other components, such as an Lp(a), apoB, apoA-I or other enzymes or proteins associated with lipid metabolism may be considered in particular clinical scenarios.
The lipid profile should be determined in which individuals? Dyslipidaemia screening in subjects without clinical cardiovascular disease should begin at age 40 for men and at age 50 for women (or after the menopause), especially if there are other cardiovascular risk factors. The relatives of patients with severe dyslipidaemia or premature cardiovascular disease should also be screened.13
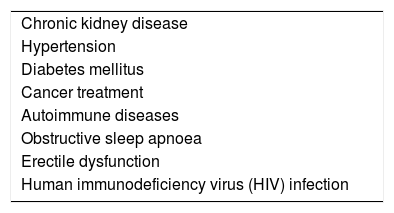
The analytical determination of potential dyslipidaemia is always indicated in patients with established cardiovascular disease or when screening is deemed necessary owing to cardiovascular risk factors. It should also be considered in clinical scenarios where dyslipidaemia may lead to increased cardiovascular risk13 (Table 4).
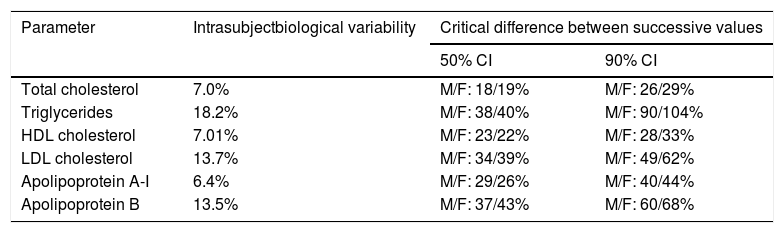
How often should the lipid profile be determined? Although no definitive guideline exists, the repetition of analytical tests should depend on the subject's cardiovascular risk, their clinical situation and the values obtained in the initial assessment. Given that the components of the lipid profile vary within subjects (intrasubject variability), the initial assessment should comprise two lipid profiles, the second at least one week after the first. In clinically-stable patients with low cardiovascular risk and a normal lipid profile, it would seem reasonable to repeat the test every 3–5 years.
Table 5 details the intrasubject variability (biological) of the main components of the lipid profile in healthy subjects and the analytical variability of the assessment methods.14 These data, obtained from a Spanish population, show the critical minimum difference between two successive lipid profiles in men and women that must exist for it to be considered to be due to changes in lipid metabolism and not to biological variability.
Intrasubject biological variability of the lipid profile and critical difference between successive measurements to be considered significanta
| Parameter | Intrasubjectbiological variability | Critical difference between successive values | |
|---|---|---|---|
| 50% CI | 90% CI | ||
| Total cholesterol | 7.0% | M/F: 18/19% | M/F: 26/29% |
| Triglycerides | 18.2% | M/F: 38/40% | M/F: 90/104% |
| HDL cholesterol | 7.01% | M/F: 23/22% | M/F: 28/33% |
| LDL cholesterol | 13.7% | M/F: 34/39% | M/F: 49/62% |
| Apolipoprotein A-I | 6.4% | M/F: 29/26% | M/F: 40/44% |
| Apolipoprotein B | 13.5% | M/F: 37/43% | M/F: 60/68% |
CI: 50% and 90% confidence interval; F: female; HDL: high-density lipoprotein; LDL: low-density lipoprotein; M: male.
All analytical methods involve analytical variability, which is also known as measurement error. Analytical variability arises from the components of the test method used (calibration material, reagents and instrumentation) and from two types of error: random error and systematic error.
Random error or analytical imprecision evaluates the reproducibility of the results of a measurement method in any condition in which it is used. Analytical imprecision is evaluated and controlled by repeatedly assessing the test materials with concentrations close to the clinical decision thresholds. This is then used to estimate the variability of the results obtained in clinical samples. It is usually expressed as a percentage of the coefficient of variation (CV), which is calculated by dividing the standard deviation (SD) of the results obtained in control samples by their mean (x) (%CV=SD/x). Analytical imprecision is inherent in the variability of the components of the analytical method (sample volume, type of reagent, variability of the calibrators or instrument used, etc.).
Systematic error or analytical inaccuracy evaluates the extent to which the result obtained differs from the true value. This is assessed using reference materials that contain exact quantities of the component to be measured and is calculated as the difference between the true value and that obtained by determining an analytical variable.
The aim of any analytical method is to produce results with the minimal possible analytical imprecision or inaccuracy to ensure their correct clinical interpretation. This is achieved by standardising measurement methods, thereby guaranteeing that the results obtained from different laboratories using different testing methods are mutually comparable over time.
Several international organisations have defined standardisation or reference methods and materials for each component measured. In vitro diagnostic companies develop their methods by adapting them to these standard methods, while clinical laboratories manage the analytical quality of their results using methods adapted to the standards and by participating in quality control programmes that certify the imprecision and inaccuracy of their methods. Standardisation of the components of the lipid profile has improved analytical quality, the comparability of results between different laboratories and the traceability of the results obtained from any clinical laboratory with those obtained in international studies analysing the role of these markers in cardiovascular disease.
Quality of the measurement methodsAs mentioned above, a conventional lipid profile should include total cholesterol and triglycerides, as well as LDL-C and HDL-C.13
Total cholesterol and triglycerides and HDL-C are measured directly in serum and plasma samples with no sample preparation required. In addition, point-of-care testing can be used to measure these components in capillary or venous whole blood. However, LDL-C must be measured indirectly after separating the different lipoproteins by ultracentrifugation (complex method) or calculated using a formula (simple but inaccurate).
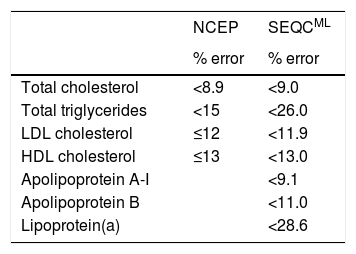
International bodies like the National Cholesterol Education Program (NCEP)15 and Spanish scientific societies like the Spanish Society of Laboratory Medicine (SEQCML)16 have published recommendations pertaining to analytical quality standards that the methods used to measure the components of the lipid profile should meet. The NCEP recommendations are based on expert consensus, whereas the SEQCML recommendations are based on the biological variability of the lipid components (Table 6). The recommendations based on the biological variability of the lipid components are clearly extremely useful in clinical practice. According to the SEQCML, imprecision in an analytical method equal to or less than 50% of the biological variability of the component being measured is acceptable.14
Analytical quality recommendations (maximum permissible error %) for lipid profile determination methods according to the NCEP (15) or the SEQCML (16).
| NCEP | SEQCML | |
|---|---|---|
| % error | % error | |
| Total cholesterol | <8.9 | <9.0 |
| Total triglycerides | <15 | <26.0 |
| LDL cholesterol | ≤12 | <11.9 |
| HDL cholesterol | ≤13 | <13.0 |
| Apolipoprotein A-I | <9.1 | |
| Apolipoprotein B | <11.0 | |
| Lipoprotein(a) | <28.6 |
HDL: high-density lipoprotein; LDL: low-density lipoprotein; NCEP: National Cholesterol Education Panel; SEQCML: Spanish Society of Laboratory Medicine.
Total cholesterol and triglycerides. Enzymatic-colourimetric methods based on the same reactions that occur in the body's lipid metabolism (cholesterol esterase+cholesterol oxidase; triglyceride lipase+glycerol detection) are recommended for the determination of these components. These standardised methods are compared to the reference methods and international control materials are used to ensure transferability between different methods.
Analytical imprecision as assessed by the Quality Assurance programme of the SEQCML is very low for the cholesterol (1.7–3.6%) and triglycerides (<5%) methods. The inter-method differences are acceptable for cholesterol (<2.1%) in 98% of the participating laboratories, while 98% of the participating laboratories also meet the recommended quality specifications for the determination of triglycerides.
HDL cholesterol. There are a number of comparable methods that can determine HDL-C without having to separate HDL cholesterol from the other cholesterol-rich lipoproteins. The methods use selective enzymes, detergents and/or anti-apoB antibodies to block the reactivity of non-HDL lipoproteins and are standardised against the reference method. In the quality control programmes, method imprecision is acceptable (4–10%) in 86% of the participating laboratories, while the differences between the different methods are greater than desired (5.6%).
LDL cholesterol. LDL-C determination is the most problematic of all the components of the lipid profile. The reference method calls for the different lipoproteins to be separated by centrifugation at more than 100,000 times gravity (ultracentrifugation). This method tends to only be available at specialised laboratories.
LDL-C can be calculated using the Friedewald formula. Due to its simplicity and ease-of-use, this has been used by most significant clinical trials and population studies upon which recommendations concerning targets and desirable values of the components of the lipid profile have been based.
The Friedewald formula, which was published in 1972, assumes that most (>99%) circulating triglycerides are associated with very low-density lipoproteins (VLDL) and that the ratio of triglycerides to cholesterol in VLDL is constant.17 By applying these assumptions, LDL-C can be calculated as follows: LDL-C=total cholesterol−HDL-C−VLDL-C. While measuring total cholesterol and HDL is uncomplicated, VLDL-C should be measured after separating the lipoproteins by ultracentrifugation. However, VLDL-C can also be determined using the following calculations: triglyceride concentration/5 (in mg/dl) or triglycerides/2.21 (in mmol/l). The inaccuracy of this formula is acceptable when triglyceridaemia is below 2.25mmol/l (200mg/dl) but cannot be used if triglyceridaemia exceeds 4.50mmol/l (400mg/dl) as this leads to LDL-C being underestimated, or in the event of dysbetalipoproteinaemia as this leads to LDL-C being overestimated. As a result, the Friedewald formula is not recommended with triglyceridaemia in excess of 2.25mmol/l (200mg/dl). Finally, the accuracy of the LDL-C calculation also decreases when LDL-C concentrations are very low (e.g. <1.81mmol/l [70mg/dl]). Nevertheless, with the exception of hypertriglyceridaemia or dysbetalipoproteinaemia, this inaccuracy has little impact on the clinical and therapeutic decision-making process.
As with HDL-C, comparable methods that require no lipoprotein separation are also used to measure LDL-C. The methods use selective detergents and/or modified enzymes. Although some of these methods are certified by the Centers for Disease Control and Prevention, some errors have been reported, particularly in patients with hypertriglyceridaemia and/or abnormal lipoprotein levels.
Finally, although quality control programmes have found imprecision to be acceptable (4.85–10% in 80% of laboratories), inter-method differences of up to 35% have been identified owing to the wide range of methods used to measure/calculate LDL-C.
Non-HDL cholesterol. This is an estimate of total atherogenic lipoprotein cholesterol in plasma: VLDL, LDL, IDL and Lp(a). It is calculated by subtracting HDL-C from total cholesterol. Its primary advantages are that it is not affected by any of the limitations associated with measuring LDL-C, its correlation with cardiovascular risk is similar to LDL-C and there are established therapeutic targets. Its use is recommended when triglyceride concentrations are in excess of 2.25mmol/l (200mg/dl).
Apolipoprotein B. Although there are no reference methods, measuring apoB can be standardised using control materials from the International Federation of Clinical Chemistry (IFCC). Most methods used in clinical laboratories at completely automatable and are based on immunonephelometry or immunoturbidimetry. The Quality Programmes suggest that just 70–80% of laboratories meet the quality standards for these assays.
Lipoprotein(a) Methods to measure Lp(a) based on immunonephelometry or immunoturbidimetry are not standardised. Because of this, the results and the recommended values depend on the method used by each laboratory. There are very few quality assurance programmes for Lp(a) and none in Spain.18
Lipid profile. Post-analytical variabilityPost-analytical variation refers to the variety of interpretations of a single result by different professionals. Attempts are being made to reduce this variability through clinical practice recommendations or guidelines. In this regard, this article makes reference to the 2016 ESC/EAS Guidelines for the management of dyslipidaemias,13 complemented by other clinical practice recommendations where necessary. Although the ESC/EAS guidelines are considered the gold standard, other international guidelines have been developed, such as the North American and Canadian guidelines, with some discrepancies in the recommendations proposed.19
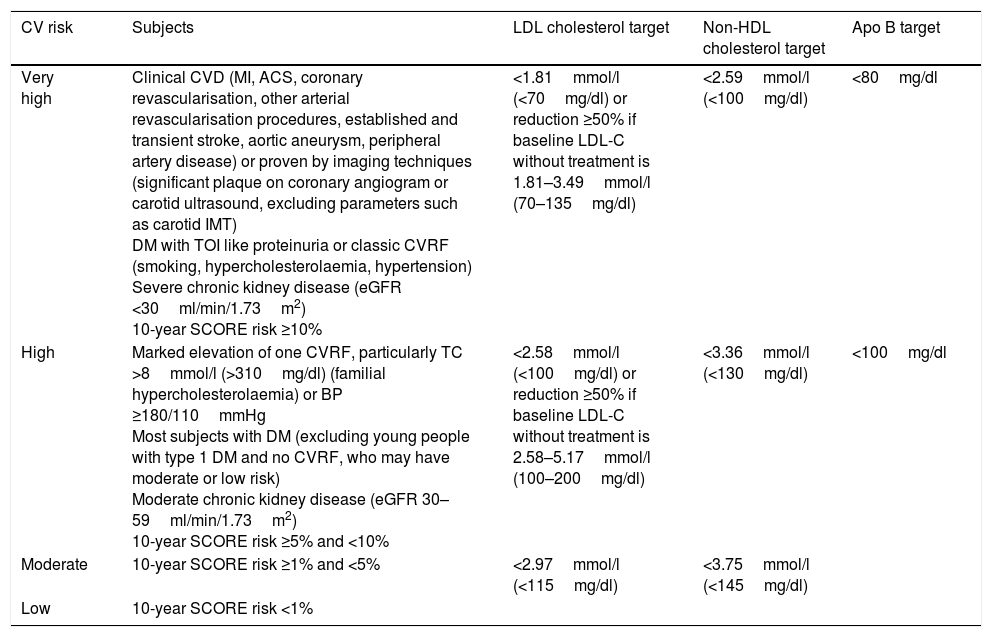
Overall cardiovascular risk stratification and lipid control targetsThe latest update of the Spanish Society of Family and Community Medicine's (semFYC) Programme of Preventive Activities and Promotion of Health recommends cardiovascular risk stratification and a number of therapeutic targets aligned to risk level.20 Along similar lines, the ESC/EAS guidelines establish several categories and therapeutic targets for LDL-C according to subjects’ individual cardiovascular risk (Table 7).
Overall cardiovascular risk categories and therapeutic targets for LDL cholesterol, non-HDL cholesterol and apolipoprotein B (apoB).
| CV risk | Subjects | LDL cholesterol target | Non-HDL cholesterol target | Apo B target |
|---|---|---|---|---|
| Very high | Clinical CVD (MI, ACS, coronary revascularisation, other arterial revascularisation procedures, established and transient stroke, aortic aneurysm, peripheral artery disease) or proven by imaging techniques (significant plaque on coronary angiogram or carotid ultrasound, excluding parameters such as carotid IMT) DM with TOI like proteinuria or classic CVRF (smoking, hypercholesterolaemia, hypertension) Severe chronic kidney disease (eGFR <30ml/min/1.73m2) 10-year SCORE risk ≥10% | <1.81mmol/l (<70mg/dl) or reduction ≥50% if baseline LDL-C without treatment is 1.81–3.49mmol/l (70–135mg/dl) | <2.59mmol/l (<100mg/dl) | <80mg/dl |
| High | Marked elevation of one CVRF, particularly TC >8mmol/l (>310mg/dl) (familial hypercholesterolaemia) or BP ≥180/110mmHg Most subjects with DM (excluding young people with type 1 DM and no CVRF, who may have moderate or low risk) Moderate chronic kidney disease (eGFR 30–59ml/min/1.73m2) 10-year SCORE risk ≥5% and <10% | <2.58mmol/l (<100mg/dl) or reduction ≥50% if baseline LDL-C without treatment is 2.58–5.17mmol/l (100–200mg/dl) | <3.36mmol/l (<130mg/dl) | <100mg/dl |
| Moderate | 10-year SCORE risk ≥1% and <5% | <2.97mmol/l (<115mg/dl) | <3.75mmol/l (<145mg/dl) | |
| Low | 10-year SCORE risk <1% |
ACS: acute coronary syndrome; BP: blood pressure; CVD: cardiovascular disease; CVRF: cardiovascular risk factor; DM: diabetes mellitus; eGFR: estimated glomerular filtration rate; IMT: intima-media thickness; MI: myocardial infarction; TOI: target organ injury.
In terms of triglycerides and HDL-C, the ESC/EAS guidelines acknowledge their role as cardiovascular risk factors but does not consider them to be therapeutic targets. Nevertheless, HDL-C concentrations >1.03mmol/l (40mg/dl) in men and >1.24mmol/l (48mg/dl) in women and triglyceridaemia <1.7mmol/l (150mg/dl) are defined as desirable. It is recommended to assess treatment with fibrates or omega-3 fatty acids, in addition to statins, in patients with very high cardiovascular risk when triglyceridaemia is >2.25mmol/l (200mg/dl).13
Once LDL-C therapeutic targets have been met in very high-risk patients, non-HDL cholesterol or apoB can be considered as secondary goals. Specific targets for non-HDL cholesterol are 0.78mmol/l (30mg/dl) higher than the corresponding LDL-C targets: <2.58mmol/l (100mg/dl) for very high-risk patients and <3.36mmol/l (130mg/dl) for patients with high cardiovascular risk. When triglyceride concentrations are >2.25mmol/l (200mg/dl), it is recommended to use the non-HDL cholesterol targets rather than LDL-C calculated by the Friedewald formula due to its inaccuracy. In terms of apoB, the recommended targets are <80mg/dl for very high-risk subjects and <100mg/dl for patients with high cardiovascular risk.13
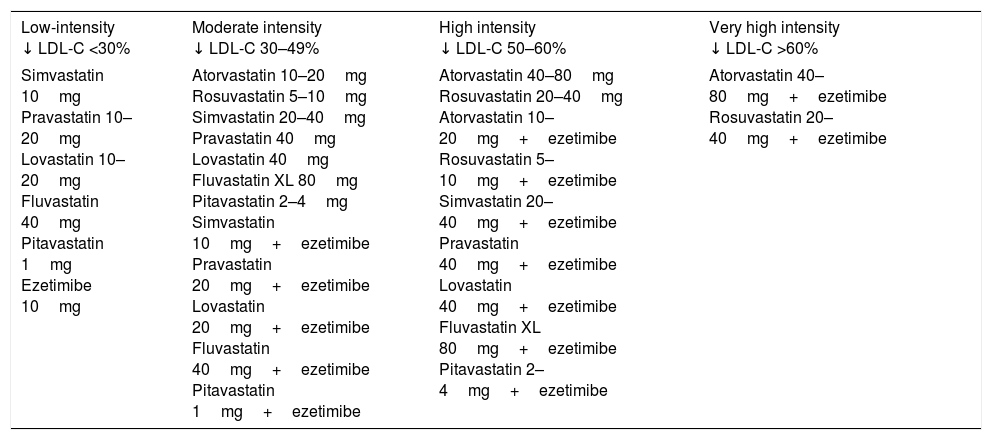
In addition to diet and lifestyle change, the key to achieving these therapeutic targets, especially for patients with high/very high cardiovascular risk, is lipid-lowering drugs. High intensity statins (atorvastatin, rosuvastatin) administered at the maximum tolerated dose to achieve the recommended target represent the fundamental treatment for this group of patients. In the event of intolerance to statins, ezetimibe and/or bile acid sequestrants should be considered. If the therapeutic targets are not attained with statins in monotherapy, their combination with ezetimibe should be considered. Table 8 classifies cholesterol-lowering therapy by LDL-C reduction intensity.21 In very high-risk patients in whom the above strategies fail to achieve the therapeutic target, the addition of a third drug such as a proprotein convertase subtilisin/kexin type 9 inhibitor (PCSK9) could be considered.
Classification of cholesterol-lowering therapy by LDL cholesterol (LDL-C) concentration reduction effectiveness.
| Low-intensity ↓ LDL-C <30% | Moderate intensity ↓ LDL-C 30–49% | High intensity ↓ LDL-C 50–60% | Very high intensity ↓ LDL-C >60% |
|---|---|---|---|
| Simvastatin 10mg Pravastatin 10–20mg Lovastatin 10–20mg Fluvastatin 40mg Pitavastatin 1mg Ezetimibe 10mg | Atorvastatin 10–20mg Rosuvastatin 5–10mg Simvastatin 20–40mg Pravastatin 40mg Lovastatin 40mg Fluvastatin XL 80mg Pitavastatin 2–4mg Simvastatin 10mg+ezetimibe Pravastatin 20mg+ezetimibe Lovastatin 20mg+ezetimibe Fluvastatin 40mg+ezetimibe Pitavastatin 1mg+ezetimibe | Atorvastatin 40–80mg Rosuvastatin 20–40mg Atorvastatin 10–20mg+ezetimibe Rosuvastatin 5–10mg+ezetimibe Simvastatin 20–40mg+ezetimibe Pravastatin 40mg+ezetimibe Lovastatin 40mg+ezetimibe Fluvastatin XL 80mg+ezetimibe Pitavastatin 2–4mg+ezetimibe | Atorvastatin 40–80mg+ezetimibe Rosuvastatin 20–40mg+ezetimibe |
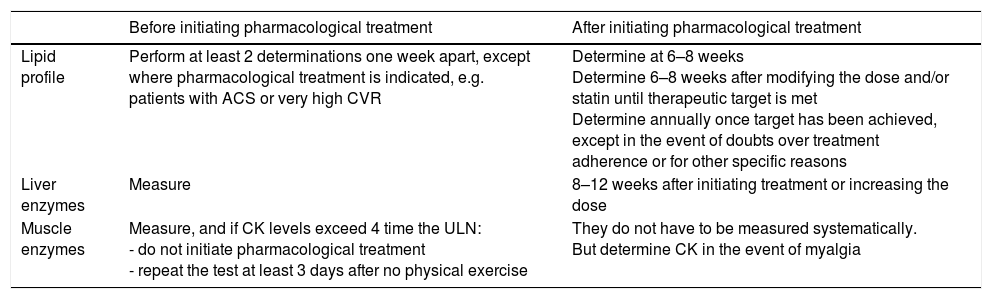
Table 9 summarises the recommended blood tests for subjects on lipid-lowering therapy, specifying which tests should be requested and when.
Recommendations for the analytical control of lipid-lowering therapy.
| Before initiating pharmacological treatment | After initiating pharmacological treatment | |
|---|---|---|
| Lipid profile | Perform at least 2 determinations one week apart, except where pharmacological treatment is indicated, e.g. patients with ACS or very high CVR | Determine at 6–8 weeks Determine 6–8 weeks after modifying the dose and/or statin until therapeutic target is met Determine annually once target has been achieved, except in the event of doubts over treatment adherence or for other specific reasons |
| Liver enzymes | Measure | 8–12 weeks after initiating treatment or increasing the dose |
| Muscle enzymes | Measure, and if CK levels exceed 4 time the ULN: - do not initiate pharmacological treatment - repeat the test at least 3 days after no physical exercise | They do not have to be measured systematically. But determine CK in the event of myalgia |
ACS: acute coronary syndrome; CK: creatine kinase; CVR: cardiovascular risk; ULN: upper limit of normal.
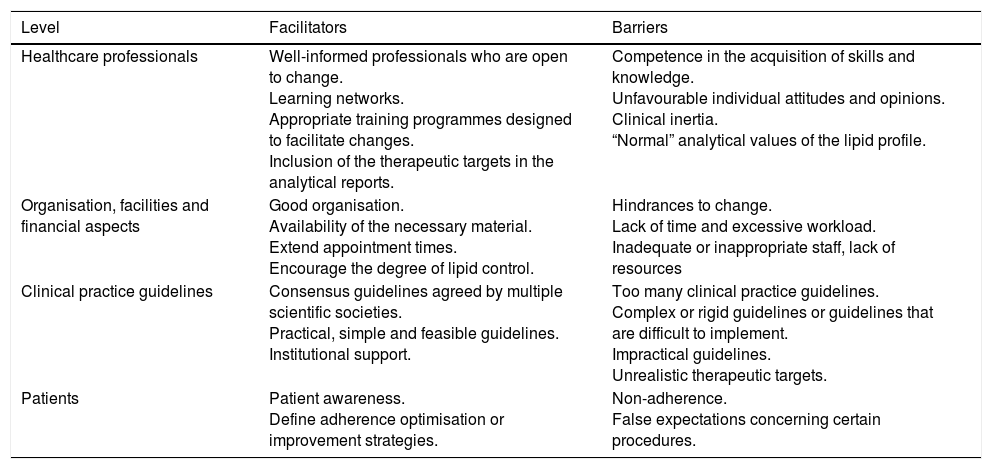
Certain circumstances can facilitate or hinder the attainment of the therapeutic targets. Table 10 summarises the primary facilitators and most common barriers to meeting the therapeutic targets, grouped by the area in which they arise.22,23
Barriers and facilitators to meeting the therapeutic targets.
| Level | Facilitators | Barriers |
|---|---|---|
| Healthcare professionals | Well-informed professionals who are open to change. Learning networks. Appropriate training programmes designed to facilitate changes. Inclusion of the therapeutic targets in the analytical reports. | Competence in the acquisition of skills and knowledge. Unfavourable individual attitudes and opinions. Clinical inertia. “Normal” analytical values of the lipid profile. |
| Organisation, facilities and financial aspects | Good organisation. Availability of the necessary material. Extend appointment times. Encourage the degree of lipid control. | Hindrances to change. Lack of time and excessive workload. Inadequate or inappropriate staff, lack of resources |
| Clinical practice guidelines | Consensus guidelines agreed by multiple scientific societies. Practical, simple and feasible guidelines. Institutional support. | Too many clinical practice guidelines. Complex or rigid guidelines or guidelines that are difficult to implement. Impractical guidelines. Unrealistic therapeutic targets. |
| Patients | Patient awareness. Define adherence optimisation or improvement strategies. | Non-adherence. False expectations concerning certain procedures. |
A very important barrier to therapeutic targets being met is clinical inertia. Clinical inertia is defined as not starting or intensifying a particular treatment/medication despite not achieving the therapeutic targets. A study conducted in primary care in diabetic patients found that clinical inertia was primarily associated with LDL-C control (86.4%). This inertia was particularly prevalent in patients who, despite not meeting the therapeutic target, were not administered pharmacological treatment, and it was also observed in patients in whom treatment was not intensified.24
There are also other barriers to achieving the therapeutic objectives. In a survey of 1390 general practitioners in Spain, 81% cited lack of time during appointments as the most important barrier to evaluating cardiovascular risk.25 Furthermore, and somewhat paradoxically, 71% of doctors considered the excessive number of clinical practice guidelines and lack of consensus between different recommendations to be the primary barrier to their implementation. Finally, 50% of those surveyed felt that the therapeutic targets were not realistic.
Consensus statement conclusions(Recommendations for the laboratory report)Doctors should base their therapeutic targets on the most recent dyslipidaemia control guidelines.13 However, in clinical practice it is not always easy to recall all the recommendations set out in the guidelines for the various categories of cardiovascular risk and the lipid concentrations that constitute the therapeutic targets.
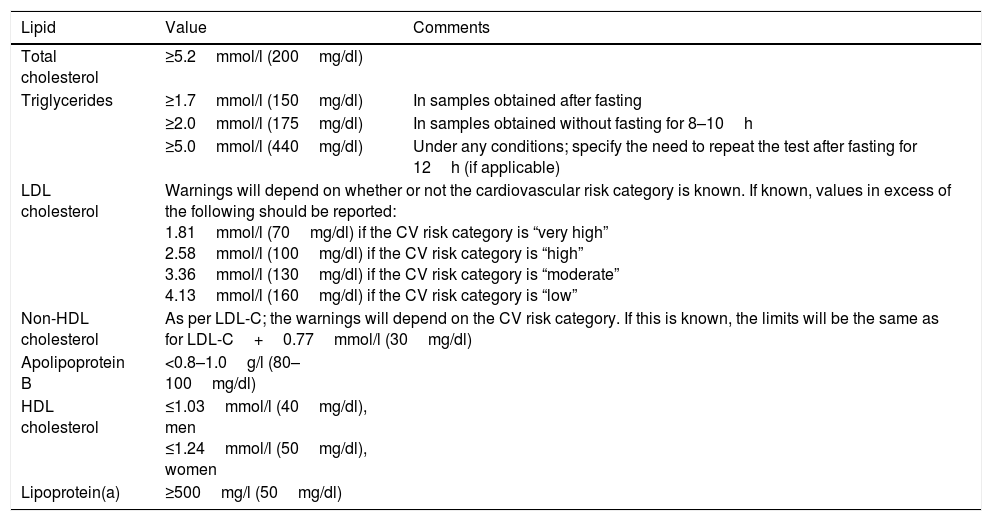
Clinical laboratories play a key role in warning and informing both doctors and patients of any results that are abnormal or that do not met the lipid profile targets. The most recent guidelines from the EAS and the European Federation of Clinical Chemistry and Laboratory Medicine12 suggest adopting common values that are standardised across all laboratories in order to better warn doctors and patients. It is the duty of the clinical laboratory to highlight the values listed in Table 11 in its analytical report.
Values to be highlighted in the analytical report by the clinical laboratory.
| Lipid | Value | Comments |
|---|---|---|
| Total cholesterol | ≥5.2mmol/l (200mg/dl) | |
| Triglycerides | ≥1.7mmol/l (150mg/dl) | In samples obtained after fasting |
| ≥2.0mmol/l (175mg/dl) | In samples obtained without fasting for 8–10h | |
| ≥5.0mmol/l (440mg/dl) | Under any conditions; specify the need to repeat the test after fasting for 12h (if applicable) | |
| LDL cholesterol | Warnings will depend on whether or not the cardiovascular risk category is known. If known, values in excess of the following should be reported: 1.81mmol/l (70mg/dl) if the CV risk category is “very high” 2.58mmol/l (100mg/dl) if the CV risk category is “high” 3.36mmol/l (130mg/dl) if the CV risk category is “moderate” 4.13mmol/l (160mg/dl) if the CV risk category is “low” | |
| Non-HDL cholesterol | As per LDL-C; the warnings will depend on the CV risk category. If this is known, the limits will be the same as for LDL-C+0.77mmol/l (30mg/dl) | |
| Apolipoprotein B | <0.8–1.0g/l (80–100mg/dl) | |
| HDL cholesterol | ≤1.03mmol/l (40mg/dl), men ≤1.24mmol/l (50mg/dl), women | |
| Lipoprotein(a) | ≥500mg/l (50mg/dl) | |
For samples obtained under any conditions, the laboratory must warn doctors as quickly as possible if triglyceride levels ≥10.0mmol/l (880mg/dl) are detected due to the risk of pancreatitis.
The authors declare that they have no conflicts of interest.
Please cite this article as: Pedro-Botet J, Rodríguez-Padial L, Brotons C, Esteban-Salán M, García-Lerín A, Pintó X, et al. Homogeneización de los valores del perfil lipídico. Clin Invest Arterioscler. 2018;30:36–48.