


In insulin-resistance, VLDL presents alterations that increase its atherogenic potential. The mechanism by which insulin-resistance promotes the production of altered VLDL is still not completely understood. The aim of this study was to evaluate the relationship between the expression of sterol regulatory element binding protein 1c (SREBP-1c) and of peroxisome proliferator-activated receptor-α (PPAR-α), with the features of composition and size of VLDL in an insulin-resistance rat model induced by a sucrose rich diet (SRD).
MethodsThe study was conducted on 12 male Wistar rats (180g) receiving SRD (12 weeks) and 12 controls. Lipid profile, free fatty acids, glucose, and insulin were measured. Lipid content in liver and visceral fat were assessed. Isolated VLDL (d<1.006g/ml) was characterized by its chemical composition and size by HPLC. The respective hepatic expression of SREBP-1c and PPAR-α was determined (Western blot).
ResultsAs expected, SRD had elevated triglycerides (TG), free fatty acids and insulin levels, and decreased HDL-cholesterol (p<0.05), together with augmented hepatic and visceral fat (p<0.05). SRD showed higher VLDL total mass – with increased TG content – and predominance of large VLDL (p<0.05). SRD showed an increase in SREBP-1c (precursor and mature forms) and decreased PPAR-α expression (p<0.045). SREBP-1c forms were positively associated with VLDL total mass (p<0.04), VLDL-TG% (p<0.019), and large VLDL% (p<0.002). On the other hand, PPAR-α correlated negatively with VLDL total mass (p=0.05), VLDL-TG% (p=0.005), and large VLDL% (p=0.002).
ConclusionsInsulin-resistance, by coordinated activation of SREBP-1c and reduction of PPAR-α, could promote the secretion of larger and TG over-enriched VLDL particles, with greater atherogenic capacity.
En la insulinorresistencia, la VLDL presenta alteraciones que aumentan su potencial aterogénico. El mecanismo por el cual la insulinorresistencia promueve la producción de VLDL alteradas aún no se comprende completamente. Objetivo: evaluar la relación entre la expresión de la proteína ligadora de elementos reguladores de esteroles-1c (SREBP-1c) y de los receptores activados por factores de proliferación peroxisomal-α (PPAR-α) con las características de composición y tamaño de VLDL en un modelo animal de insulinorresistencia inducida por dieta rica en sacarosa (DRS).
MétodosEstudiamos 12 ratas macho Wistar (180g) que recibieron DRS (12 semanas) y 12 controles. Se midieron el perfil lipídico, los ácidos grasos libres, la glucosa y la insulina. Se cuantificaron el contenido lipídico hapático y la grasa visceral. Se caracterizó la VLDL aislada (d<1,006g/ml) en composición química y tamaño (HPLC). Se determinó la expresión hepática de SREBP-1c y PPAR-α (Western-blot).
ResultadosEsperadamente, el grupo DRS presentó elevación de triglicéridos (TG), ácidos grasos libres e insulina y disminución de colesterol-HDL (p<0,05), junto con incremento de grasa hepática y visceral (p<0,05). La DRS mostró una mayor masa total de VLDL —con mayor contenido de TG— y predominio de VLDL grandes (p<0,05). DRS presentó expresión incrementada de SREBP-1c (precursor y maduro) y disminuida de PPAR-α (p<0,045). Ambas formas de SREBP-1c se correlacionaron positivamente con masa total de VLDL (p<0,04), TG%-VLDL (p<0,019) y VLDL-grande % (p<0,002). Mientras que PPAR-α se correlacionó negativamente con masa total de VLDL (p=0,05), TG %-VLDL (p=0,005) y VLDL-grande % (p=0,002).
ConclusionesLa insulinorresistencia, mediante una coordinada activación de SREBP-1c y reducción de PPAR-α, promovería la secreción de partículas de VLDL grandes y sobreenriquecidas en TG, con mayor capacidad aterogénica.
Nowadays, insulin-resistant syndromes present a growing prevalence in the world, leading to an important increase in risk of type 2 diabetes and cardiovascular disease. Atherogenic dyslipidemia, characterized by high triglycerides, low HDL cholesterol, and predominance of small dense LDL particles, is one of the alterations of insulin-resistant syndromes directly associated to coronary disease development.1
Very low density lipoproteins (VLDL) constitute a heterogeneous family of particles varying in size and/or composition and atherogenic potential. In a previous report, we have observed in insulin-resistant rats an increased secretion of VLDL particles over-enriched in triglycerides, in spite of the concomitant presence of triglyceride deposits in the liver.2 More recently, we studied VLDL features in humans with metabolic syndrome and observed a predominance of larger VLDL sub-fractions, implementing size exclusion HPLC.3 The production of this type of VLDL can be due, in part, to an increased free fatty acid flux from adipose tissue to the liver, although the full mechanisms by which insulin-resistance influences VLDL features secreted from the liver still remain not completely understood.
Hepatic fatty acid homeostasis is principally regulated by factors as sterol regulatory element binding protein 1c (SREBP-1c) and peroximal proliferator-related receptor-α (PPAR-α) that control the hepatic fatty acid synthesis and oxidation respectively.4,5
The SREBP-1c constitutes a key regulator in the transcription of lipogenic enzymes, such as fatty acid synthase and acetyl CoA carboxylase, which are involved in the de novo synthesis of fatty acids.4 SREBP-1c is inserted in the endoplasmic reticulum as a precursor form (125kDa). By its proteolytic cleavage, the N-terminal active and mature form (68kDa) is translocated to the nucleus and thus directly activates fatty acids synthesis increasing fatty acid availability that favors triglyceride over-production.6 Recent published data demonstrate an augmentation in the expression and activation of SREBP-1c in different animal models of insulin-resistance and/or fatty liver.7–9 If SREBP-1c affects plasma VLDL is not entirely studied yet.
The PPARs constitute a nuclear receptor superfamily having a central role in the modulation of nutrient metabolism. In particular, PPAR-α has been identified as an important regulator of genes related with the peroxisomal, mitochondrial and microsomal fatty acid oxidation in the liver, tending to maintain plasma triglycerides within normal range.5 Previous reports have already demonstrated that sucrose induced insulin-resistance in rats is associated with decreased levels of PPAR-α, associated to hypertrigliceridemia.7,10 However there are no references about the relation between variations in PPAR-α levels and the type of circulating VLDL in insulin-resistance.
It would be important to determine whether alteration in SREBP-1c and/or PPAR-α levels impact on the characteristics of the secreted VLDL considering that altered VLDL are potentially more atherogenic. Our aim was to evaluate the relation between SREBP-1c and PPAR-α, important hepatic regulators of fatty acid homeostasis, and the features of composition and size of circulating VLDL in an insulin-resistance rat model, induced by a sucrose rich diet.
Materials and methodsAnimalsMale Wistar rats (n=24) were obtained from the animal laboratory of the Department of Biochemistry, Faculty of Dentistry, University of Buenos Aires, Argentina. Animals were housed in galvanized cages with meshed floors in order to maintain hygienic conditions and to avoid coprophagia, under controlled temperature (20–22°C), humidity (50–60%) and airflow conditions, with a fixed 12h light–dark cycle (lights on from 8.00 to 20.00h). Until the moment of the beginning of the experiment, all animals were fed with standard non-purified rat laboratory chow diet and had unrestricted access to food and water in order to standardize the nutritional status. The diet provided approximately 12.1kJ/g chow.
When rats weighted 175–190g, they were randomly divided into two groups (n=12 each), control or experimental. Both groups of rats continued receiving “ad libitum” pre-weighed standard laboratory diet, but the experimental group also received 30% (w/v) sucrose in drinking water throughout 12 weeks, designated as sucrose rich diet (SRD) group. Along the period of the experiment (12 weeks) rats evolve to an early insulin-resistant state.11 Animals were accurately monitored for food and water consumption, and also body weight and food intake were weekly controlled. As was previously reported, despite supplementation with sucrose, no difference in caloric intake was observed (p=0.221) between groups along the period of the study.2
All procedures were carried out according to the National Institute of Health Guide for the Care and Use of Laboratory Animals12 and the protocol was approved by the local Committee of the Faculty of Pharmacy and Biochemistry, University of Buenos Aires.
SamplesAfter 12 weeks of treatment, and after 5h fasting, animals were anesthetized with an intraperitoneal injection of pentobarbital (60mg/kg body weight). Animals were sacrificed and blood was obtained by cardiac puncture. Serum was separated and samples were stored at 4°C for metabolic determinations assessment within 48h, and at −70°C for further insulin measurement and VLDL isolation.
Liver was immediately removed, weighed and preserved for further analysis. It was separated into two portions; one of them was kept in liquid nitrogen for the determination of liver fat content and the other one was homogenized, and two aliquots of the homogenate were kept in liquid nitrogen for the subsequent determination of the protein mass of SREBP-1c and PPAR-α by Western blot. Adipose tissue was also removed and the sum of epididymal, perirenal and intestinal fat weight was considered as visceral adiposity.
Biochemical determinationsGlucose, total cholesterol, HDL-cholesterol and triglycerides were measured by standardized enzymatic methods (Roche Diagnostics GmbH, Germany). Free fatty acids were determined by a spectrophotometric method (Randox, UK), and insulin was measured by a sandwich ELISA kit using a monoclonal antibody against rat insulin and a polyclonal antibody linked to enzyme (Rat/Mouse ELISA kit, Linco Research, USA). All measurements were under good quality control.
VLDL isolation and analysisVLDL was isolated by preparative ultracentrifugation at density d<1.006g/ml in a Beckman XL-90 using a fixed-angle rotor type 90 Ti. Each run was performed at 105,000×g for 18h at 14°C.13 Purity of lipoprotein fraction was tested by agarose gel electrophoresis. Furthermore, the possible contamination with serum albumin was also investigated by SDS-polyacrylamide gel electrophoresis followed by silver staining14 finding that only a tiny band corresponding to albumin was present. Quantification assay using Albumin Tina-Quant (Roche Diagnostics GmbH, Germany) in a Hitachi 917 yielded only traces of albumin (<1mg/dl). Isolated VLDL was then characterized by the following parameters: cholesterol and triglycerides using the methods previously described, phospholipids,15 and proteins by the Lowry method.16 Data were expressed as the percentage of each component, and their sum as circulating VLDL total mass per plasma decilitre.
As previously described, VLDL fraction was then subjected to size exclusion chromatography by HPLC3. In brief, size exclusion chromatography was carried out using TSK-Gel Lipopropack XL, 7.8mm ID×30cm (Tosoh, Japan) column and runs were performed using: Tris acetate buffer 0.05mol/L (pH 8) containing 0.3mol/L sodium acetate, 0.05% sodium azide and 0.005% Brij-35, as mobile phase. Flow rate was 0.5ml/min and column eluate was monitored at 280nm. For the conversion of elution time in particle diameter, a standard curve was constructed with the logarithm of retention time vs. the logarithm of the diameter of size standard latex particles of 100nm (Fluka, Sigma–Aldrich, USA), 39 and 27nm in diameter (Magsphere Inc., USA). From chromatograms we could recognize a peak at 10.03±0.24min with a diameter of 94.71±3.01nm, which was identified as fraction 1 A, another peak at 12.09±0.45min with an average diameter of 66.70±5.38nm, fraction 1 B, a majority peak at 22.32±0.04min and a diameter of 37.16±0.10nm identified as fraction 2 and finally smaller peaks were detected at longer retention times (from 24 to 32min) and sizes about 35–30nm. Results were expressed as the percentage of each peak area in respect to total chromatogram area, using the ChromQuest 4.1 integration program.
Liver fat content determinationHepatic lipid content was determined by a Folch extraction and evaporation to dryness followed by gravimetric measurements.17 Briefly, pieces of liver were weighed and homogenized with 30vol of chloroform:methanol (2:1). After standing overnight at room temperature, the homogenate was filtrated and partition was performed in a separatory funnel by adding 0.2 volume of a 0.05N aqueous NaCl solution. When the two phases were well separated, the lower containing the lipids dissolved in it, was collected. Anhydrite CaCl2 was added in order to remove water vestiges and once again filtrated to eliminate the salt. The filtrated organic phase was taken to dryness in a rotavapor at 45°C. The residue was weighed and the lipid content was expressed as weight/weight.
Western blot analysisA fraction of liver tissue was thoroughly homogenized in lysis buffer, containing Tris 20mM, NaCl 150mM, Triton X-100 1% (v/v), in the presence of protease inhibitor (Sigma Aldrich, USA), pH 7.4 and incubated for 120min at 4°C. Homogenates were centrifuged at 10,000rpm for 10min in order to separate insoluble material. The supernatants were used for protein quantification by Lowry method,16 and subsequent Western blot analysis under denaturizing conditions.
SREBP-1c expression analysisAn aliquot of liver homogenate containing 60μg of protein was separated by (10%) SDS-PAGE. Proteins were transferred to polyvinyldiflouride membranes for immunoblotting, and incubated with anti-SREBP-1c antibody (Santa Cruz, CA, USA). The blots were then incubated with horseradish peroxidase conjugated secondary antibody and band immunoreactivity was detected by chemiluminescence. Band intensity was quantified using Fluorchem specific software (Alpha Innotech Corp, USA). β-Actin was used as a loading control, and each band reactivity was expressed as densitometric arbitrary units in relation to the control, after being normalized to each corresponding β-actin signal. As primary antibody recognizes precursor and mature SREBP-1c forms (125kDa and 68kDa, respectively), liver SREBP-1c showed one electrophoretic band approximately at 125kDa and another one at 68kDa, that represent precursor and mature SREBP-1c forms respectively.9
PPAR-α expression analysisFor PPAR-α (55kDa), another homogenate aliquot containing 50μg of protein was separated by (12%) SDS-PAGE. After transferring proteins to polyvinyldiflouride membranes, they were incubated with anti-PPAR-α antibody (Santa Cruz, CA, USA). As above described, blots were incubated with secondary antibody and band intensity was quantified using Fluorchem specific software (Alpha Innotech Corp, USA). β-Actin was used as a loading control. Band reactivity was expressed as densitometric arbitrary units in relation to the control after being normalized to β-actin signal.
Statistical analysisBiochemical data are shown as mean±SD or median and range, depending on data distribution. Differences between groups were tested using the unpaired Student's t-test for normally distributed data and Mann–Whitney U-test for skewed data. Correlations between variables were assessed using Pearson or Spearman test according to data distribution. p-Values below 0.05 were considered statistically significant.
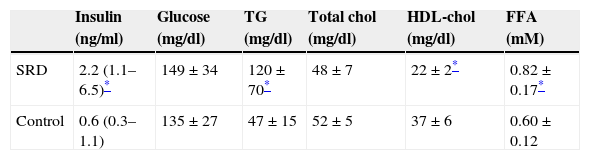
ResultsTable 1 shows serum biochemical and metabolic parameters in both animal groups. As expected, those which received SRD presented higher insulin levels (p=0.03) with no change in serum fasting glucose (p=0.93), compatible with an early insulin-resistant state. In addition, SRD animals showed higher triglycerides and lower HDL-cholesterol levels (p=0.031 and p=0.021, respectively). Moreover, free fatty acids levels were increased in SRD group (p=0.043).
Metabolic and lipid parameters in SRD (n=12) and control rats (n=12).
| Insulin (ng/ml) | Glucose (mg/dl) | TG (mg/dl) | Total chol (mg/dl) | HDL-chol (mg/dl) | FFA (mM) | |
|---|---|---|---|---|---|---|
| SRD | 2.2 (1.1–6.5)* | 149±34 | 120±70* | 48±7 | 22±2* | 0.82±0.17* |
| Control | 0.6 (0.3–1.1) | 135±27 | 47±15 | 52±5 | 37±6 | 0.60±0.12 |
Results are expressed as means±SD and medians (range). TG: triglycerides; chol: cholesterol; FFA: free fatty acids.
Despite no total body weight differences were observed between groups through the time of the experiment (SRD: 442±50g and controls: 422±28g, p=0.173); total visceral fat mass was greater in SRD animals (17.1±4.3 vs. 11.9±2.8g; p=0.001). Also, liver weight was augmented in SRD rats in comparison to controls (25.4±2.3 vs. 15.2±1.2g; p=0.045), as well as the quantification of liver fat content: 236±23 vs. 123±14mg/g; p=0.034. Notably, hepatic fat content was associated positively with total visceral fat weight (r=0.60; p=0.02) and liver weight (r=0.53; p=0.03). Moreover, the latter correlated with total visceral fat weight (r=0.74; p=0.01).
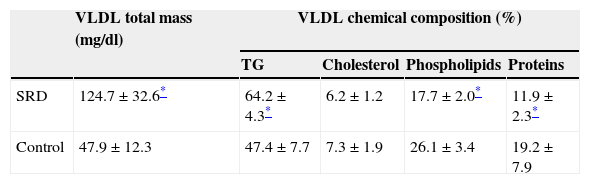
Isolated VLDL characteristics can be observed in Table 2. Plasma VLDL total mass was increased in SRD animals (p=0.001). In addition, as observed in previous studies, VLDL from SRD presented triglyceride over-enrichment (p=0.0001).
VLDL in SRD (n=12) and control rats (n=12): total mass and chemical composition.
| VLDL total mass (mg/dl) | VLDL chemical composition (%) | ||||
|---|---|---|---|---|---|
| TG | Cholesterol | Phospholipids | Proteins | ||
| SRD | 124.7±32.6* | 64.2±4.3* | 6.2±1.2 | 17.7±2.0* | 11.9±2.3* |
| Control | 47.9±12.3 | 47.4±7.7 | 7.3±1.9 | 26.1±3.4 | 19.2±7.9 |
Results are expressed as means±SD. TG: triglycerides.
VLDL sub-fraction analysis by size exclusion HPLC (Fig. 1) revealed an increase in the proportion of fraction 1B – large VLDL sub-fraction – in SRD group in comparison to controls [median (range), 65.2% (41.3–73.1) vs. 20.2% (15.0–40.4); p=0.041], while the proportion of fraction 1A – very large VLDL and chylomicron remnants – presented a tendency to increase in SRD group [median (range), 21.7% (13.5–42.1) vs. 7.9% (5.7–18.2); p=0.07]. Subsequently, proportion of fraction 2 – typical VLDL – was decreased in SRD group [median (range), 15.1% (13.0–39.8) vs. 56.3% (46.2–64.9); p=0.014]; and no difference in the proportion of fraction 3 – VLDL remnants – was observed between groups [median (range), 4.9% (2.6–5.5) vs. 5.5% (1.9–9.4); p=0.65]. The increase in the proportion of large VLDL showed a strong tendency to correlate with the raise in free fatty acid levels (r=0.40; p=0.06).
 and from a control rat (panel 2). From left to right: fraction 1 A (94.71±3.01nm), fraction 1 B (66.70±5.38nm), fraction 2 (37.16±0.10nm) and finally fraction 3 (35–30nm).")
Fig. 2 shows the protein expression of the regulators SREBP-1c and PPAR-α in SRD and control rats. The expression of the precursor and mature forms of SREBP-1c were increased in the liver of SRD animals (p=0.045 and p=0.03, respectively), while PPAR-α expression was decreased in SRD in comparison to controls (p=0.014).
 and mature (2) SREBP-1c and PPAR-α (3) in SRD and control rats. Immunoblot quantification by densitometry. Results are represented as mean±SE and are expressed as arbitrary units in relation to the control group. Bottom: representative immunoblot bands of SREBP-1c (precursor and mature forms), PPAR-α, and its corresponding β-actin band. *p=0.045; **p=0.032 and ***p=0.014.")
Hepatic expression of precursor (1) and mature (2) SREBP-1c and PPAR-α (3) in SRD and control rats. Immunoblot quantification by densitometry. Results are represented as mean±SE and are expressed as arbitrary units in relation to the control group. Bottom: representative immunoblot bands of SREBP-1c (precursor and mature forms), PPAR-α, and its corresponding β-actin band. *p=0.045; **p=0.032 and ***p=0.014.
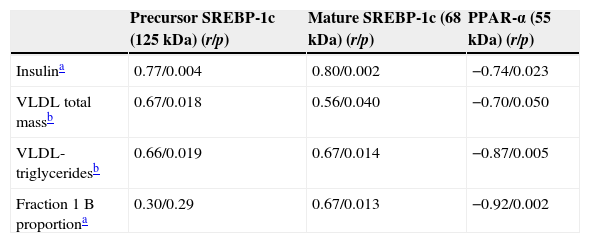
Table 3 summarizes simple regression analysis with SREBP-1c and PPAR-α protein mass. The precursor and mature forms of SREBP-1c showed a significant association with insulin levels (p=0.004 and p=0.002 respectively). Interestingly, both SREBP-1c forms directly correlated with VLDL total mass (p=0.018 and p=0.04) and VLDL triglyceride content (p=0.019 and p=0.014) respectively for precursor and mature form in both cases. Otherwise, only the mature form of SREBP-1c was significantly associated with fraction 1 B proportion (obtained by HPLC) (p=0.013). On the other hand, PPAR-α presented a negative association with insulin (p=0.023), VLDL total mass (p=0.050), VLDL triglyceride content (p=0.005) and the proportion of large VLDL (p=0.002). These correlations suggest that increase in SREBP-1c as well as the decrease in PPAR-α would induce the secretion of larger VLDL sub-fractions. On the other hand, no association was found between these transcriptional factor levels and free fatty acids [precursor SREBP-1c: (r=0.35; p=0.23), mature SREBP-1c: (r=0.14; p=0.73) and PPAR-α: (r=−0.37; p=0.318)].
Correlations of hepatic SREBP-1c and PPAR-α with insulin and with VLDL characteristics: VLDL total mass, VLDL triglyceride content and fraction 1 B (large VLDL) proportion.
| Precursor SREBP-1c (125kDa) (r/p) | Mature SREBP-1c (68kDa) (r/p) | PPAR-α (55kDa) (r/p) | |
|---|---|---|---|
| Insulina | 0.77/0.004 | 0.80/0.002 | −0.74/0.023 |
| VLDL total massb | 0.67/0.018 | 0.56/0.040 | −0.70/0.050 |
| VLDL-triglyceridesb | 0.66/0.019 | 0.67/0.014 | −0.87/0.005 |
| Fraction 1 B proportiona | 0.30/0.29 | 0.67/0.013 | −0.92/0.002 |
Data represent “r” coefficient factor/p value.
In the present study we have mainly observed that in an insulin-resistant state the secretion of large VLDL – with higher triglyceride proportion – was associated with increased protein expression of SREBP-1c and decreased expression of PPAR-α, both regulators of hepatic fatty acid availability.
In a previous report we have described the greater production of triglyceride over-enriched VLDL, implementing this insulin-resistant rat model induced by a sucrose rich diet.2 In the present study, to fully characterize VLDL features under insulin-resistance conditions, we analyzed circulating VLDL sub-fractions by means of size exclusion HPLC. In order to advance our previous research and to find some possible underlying mechanisms affecting VLDL characteristics in insulin-resistance, we evaluated hepatic expression of SREBP-1c – a key regulator of lipogenic enzymes – and PPAR-α – an important modulator of fatty acid oxidation.4,18
After 12 weeks of treatment, animals receiving sucrose in drinking water evolved to an early insulin-resistant state since SRD showed an augmented insulin maintaining glycaemia within normal range, constituting a pre-diabetic animal model.19 Plasma lipid profile in SRD rats was the one expected for the development of insulin-resistance, consisting in reduced HDL-cholesterol, increased triglycerides and free fatty acids levels. In addition, SRD animals showed an increase in visceral fat accumulation being the main source of free fatty acids flux to the liver favoring the formation of large VLDL.2,20 Liver weight and hepatic fat content were also increased in SRD rats; both were positively associated with the increase in visceral adiposity. A general consensus exists about the existence of a close association between insulin-resistance, visceral obesity and fatty liver.21,22
Increased hepatic lipid deposits could have an opposite role on VLDL over-secretion. However, when isolated VLDL was analyzed, we observed an increase in the VLDL total mass in SRD rats, evidencing hepatic VLDL over-production. Indeed, we have previously demonstrated higher VLDL secretion rate measured by an in vivo assay in insulin-resistance concomitant with fatty liver.2 It must be taken into account that VLDL in circulation is not only a resultant of its hepatic production, but also of its catabolic rate. With regard to this last point, there are still controversies about lipolytic efficiency and lipoprotein lipase activity, probably due to variations in the degree of insulin-resistance.23,24 Therefore, VLDL characteristics would mainly reflect the type of lipoprotein secreted by the liver. Then, it can be inferred that in insulin-resistant states, hyperinsulinemia enhances hepatic triglyceride and apo B synthesis with their subsequent assembly and secretion of VLDL particles, evidenced in a plasma triglyceride increase.25 It is important to highlight that the over-secretion of VLDL-triglycerides occurs even when fat is concomitantly deposited in the liver, as a response of the hepatic over-production of triglycerides.2,26
The VLDL sub-fraction analysis by size exclusion HPLC revealed the predominance of larger VLDL types in insulin-resistant rats – evidenced by the increased proportion of fraction 1 B –, in agreement with what we observed in a former study carried out in humans with metabolic syndrome.3 Furthermore, other authors verified the over-production of large triglyceride-enriched VLDL particles – so-called VLDL1 – in type 2 diabetic men, performing an in vivo lipoprotein kinetic study using the infusion of stable isotopes.27 Authors suggest that in insulin-resistant states, such as metabolic syndrome and type 2 diabetes, there would be a hepatic VLDL production switch, from smaller and poor in triglyceride particles (VLDL2) to larger and triglyceride over-enriched VLDL (VLDL1). It is important to note that this type of lipoprotein, unlike typical VLDL, induces endothelial dysfunction, as one of the first steps of the atherosclerotic process.28
An important issue of the present study was the determination of hepatic protein mass of the transcriptional factor SREBP-1c and the nuclear receptor PPAR-α. After 12 weeks of treatment, the protein expression levels of the precursor (125kDa) and mature (68kDa) forms of SREBP-1c were increased in insulin-resistant rats, suggesting an activation of hepatic de novo lipogenesis, though we have not measured the expressions and/or activities of lipogenic enzymes, which is assumed as a limitation of the present study. In a similar model of rats receiving sucrose rich diet during 20 weeks, other authors also found an increased expression of the mature form SREBP-1c since the third week. Besides, the authors confirmed the elevation of hepatic lipogenic enzyme activities in insulin-resistant animals; however they do not make any reference about the influence of SREBP-1c on VLDL characteristics.7
Karasawa et al., using specifically genetic modified mice that over-expressed SREBP-1c, demonstrated that VLDL produced by the liver of these animals was triglyceride over-enriched and was larger in size, determined by size exclusion HPLC.29 Herein we arrived to similar results by implementing a development model of insulin-resistance nutritionally induced, which is the specific contribution of the present study.
As regards PPAR-α, as expected, its expression was decreased in insulin-resistant rats after the term of the assay. Rossi et al. reported that PPAR-α already declined since the third week of treatment with sucrose rich diet, when animals achieved a state of incipient insulin-resistance.7 As was previously stated, the reduction in PPAR-α leads to a decrease in oxidation of fatty acids and their intra-hepatic accumulation; this would be associated to a decrease in carnitine palmitoyltransferase-1, responsible of the transfer of acyl groups into mitochondria for their oxidation.7,10 The present study provides information regarding the relation between expression of PPAR-α and VLDL characterization in insulin-resistance.
Additionally, another PPAR family member that showed to be involved in liver fat accumulation in insulin-resistance, and perhaps also linked to the over-production of altered VLDL particles, is the hepatic PPAR-γ that is expressed at very low levels in the liver.30 Herein, we were not able to determine PPAR-γ, however it would have been interesting since hepatic PPAR-γ could have an opposite behavior to PPAR-α.31
The protein expression levels of both forms of SREBP-1c were found positively associated with the increase of VLDL total mass, its triglyceride content and size. Results suggest that the coordinated process of activation of SREBP-1c and reduction of PPAR-α, which occur by different pathways in insulin-resistant states, would promote the secretion of larger and triglyceride over-enriched VLDL particles, as a consequence of the accumulation of fatty acids in the hepatocytes that are directed to triglyceride biosynthesis since their catabolism is decreased.
ConclusionOur results contribute to confirm the relation between the development of insulin-resistance with the over-expression of SREBP-1c, the reduction of PPAR-α expression and the predominance of large and triglyceride over-enriched VLDL circulating particles, known to present greater atherogenic capacity.
Ethical disclosuresProtection of human and animal subjectsThe authors declare that the procedures followed were in accordance with the regulations of the responsible Clinical Research Ethics Committee and in accordance with those of the World Medical Association and the Helsinki Declaration.
Confidentiality of dataThe authors declare that no patient data appears in this article.
Right to privacy and informed consentThe authors declare that no patient data appears in this article.
FundingThis study was supported by a grant from University of Buenos Aires (B036).
Conflict of interestThe authors declare no conflict of interest.
No acknowledgements to declare.