


Pain in the right iliac fossa (RIF) continues to pose diagnostic challenges. The objective of this study is the development of a RIF pain diagnosis model based on classification trees of type CHAID (Chi-Square Automatic Interaction Detection) and on an artificial neural network (ANN).
MethodsProspective study of 252 patients who visited the hospital due to RIF pain. Demographic, clinical, physical examination and analytical data were registered. Patients were classified into 4 groups: NsP (nonspecific RIFP group), AA (acute appendicitis), NIRIF (RIF pain with no inflammation) and IRIF (RIF pain with inflammation). A CHAID-type classification tree model and an ANN were constructed. The classic models (Alvarado [ALS], Appendicitis Inflammatory Response [AIR] and Fenyö-Lindberg [FLS]) were also evaluated. Discrimination was assessed using ROC curves (AUC [95% CI]) and the correct classification rate (CCR).
Results53% were men. Mean age 33.3±16 years. The largest group was the NsP (45%), AA (37%), NRIF (12%) and IRIF (6%). The analytical model results were: ALS (0.82 [0.76–0.87]), AIR (0.83 [0.77–0.88]) and FLS (0.88 [0.84–0.92]). CHAID determined 10 decision groups: 3 with high probability for NsP, 3 high for AA and 4 special groups with no predominant diagnosis. CCR of ANN and CHAID were 75% and 74.2%, respectively.
ConclusionsThe methodology based on CHAID-type classification trees establishes a diagnostic model based on four pain groups in RIF and generates decision rules that can help us in the diagnosis of processes with RIF pain.
El dolor en fosa ilíaca derecha (FID) sigue planteando problemas diagnósticos. El objetivo de este estudio es la elaboración de un modelo diagnóstico de dolor en FID basado en árboles de clasificación (CHAID) y en una red neuronal artificial (RNA).
MétodosEstudio prospectivo de 252 pacientes que acudieron al hospital por presentar dolor en FID. Se recogieron datos demográficos, clínicos, exploración física y analíticos. Se clasificaron en 4 grupos: dolor simple en FID (dFID), apendicitis aguda (AA), dolor abdominal sin proceso inflamatorio (DASPI) y dolor abdominal con proceso inflamatorio (DACPI). Se construyó un modelo de árbol de clasificación tipo Chi-Square Automatic Interaction Detection (CHAID) y un modelo de RNA. Se evaluaron también los modelos clásicos (Alvarado [ALS], Appendicitis Inflammatory Response [AIR] y Fenyö-Lindberg FLS]). Se evaluó la discriminación mediante curvas ROC (ABC [IC 95%]) y porcentaje de correcta clasificación (PCC).
ResultadosEl 53% eran varones. Edad media 33,3±16 años. El grupo más numeroso fue el de dFID (45%), AA (37%), DASPI (12%) y DACPI (6%). Discriminación de ALS (0,82 [0,76-0,87]), AIR (0,83 [0,77-0,88]) y FLS (0,88 [0,84-0,92]). El CHAID determina 10 grupos de decisión: 3 con probabilidad altas para dFID, 3 altas para AA y 4 especiales sin diagnóstico predominante. PCC de RNA y CHAID con el 75 y 74,2%, respectivamente.
ConclusionesLa metodología basada en árboles de clasificación tipo CHAID permite establecer un modelo diagnóstico basado en cuatro grupos de dolor en FID y genera reglas de decisión que pueden ayudarnos en el diagnóstico de procesos con dolor en FID.
Abdominal pain is a common problem of consultation in hospitals, and right iliac fossa (RIF) pain is one of the most frequent conditions treated in the Emergency Room and by the General Surgery Service.1
Studies published about the diagnosis of RIF pain have focused on the main diagnosis of acute appendicitis (AA) and in subgroups of patients with differential characteristics.2 In this manner, several studies have tried to develop new diagnostic models for this condition (but almost always differentiating between AA and other problems) or they have sought to validate the traditional systems.3
Classic algorithms, such as the Alvarado,4 Fenyö-Lindbert5 or Appendicitis Inflammatory Response (AIR),6 have a high discriminating capacity for AA. However, as they focus on AA, they are not usually useful for other diagnoses of RIF pain. New models are necessary for the integral classification of RIF conditions from the viewpoint of the professionals who treat these patients (ER specialists and surgeons).7
The objective of our study is to use emergency department data to develop a differential diagnosis for RIF pain based on classification tree methodology. We will also compare this model with classic scores and the score generated by an artificial neural network (ANN) to assist in the diagnosis of AA and other abdominal processes.
MethodProspective observational study of an 18-month period (between July 1, 2015 and December 31, 2016) performed in the emergency room (ER) of a second-level hospital with 450 hospital beds and 93,000 annual ER visits.
The patients gave their signed informed consent, and the study was approved by the Clinical Research Ethics Committee (CEIC) at the hospital.
We included patients over the age of 14 with more than 6h of pain evolution in the RIF. Patients with previous appendectomies and those who were lost to follow-up were excluded.
Once the diagnosis of pain in the RIF was established, the following variables were collected: age, sex, previous abdominal surgery, body mass index (BMI), symptom evolution time in hours, previous taking of analgesia and body temperature.
The clinical variables included in the classic models were collected: similar previous pain, Blumberg sign (positive or not), migration of pain, increased pain with cough, increased pain with mobilization, nausea/vomiting, anorexia, diarrhea and constipation. Analytical data included: number of leukocytes (number of cells×109), percentage of neutrophils (%) and serum CRP levels (mg/dL). The analytical method used was the hospital laboratory standard method. During follow-up, the data registered included whether the patient was hospitalized, whether surgery was performed and the diagnosis at the end of the episode. Four diagnostic groups were established: non-specific RIF pain (NsP) when the symptoms remitted and the patient was discharged to home; AA when the patient was operated on and the pathological anatomy was concordant; abdominal pain in the RIF with no inflammation (NIRIF) and pain abdominal in the RIF with inflammation (IRIF). Inflammation was defined as the existence of 2 or more clinical symptoms of the following, in addition to pain in RIF: temperature >38°C or <36°C, heart rate >90bpm, respiratory rate greater than 20 breaths per minute or pCO2 <32mmHg, blood leukocytes >12000/mL or <4000/ml. We also recorded whether the patient underwent abdominal ultrasound, even though it was not included in the study protocol and was left to the discretion of the attending physician.
The values for the Alvarado,4 AIR6 and Fenyö-Lindberg5 algorithms were calculated.
Statistical AnalysisThe variables are expressed as mean and standard deviation or as percentage. For the comparison between groups (4 categories) the Chi-squared test was used for qualitative variables and the nonparametric Kruskal–Wallis test for continuous variables. A P value <.05 was considered statistically significant.
The classification tree model was created using the AnswerTree module of the SPSS® program (version 20.0). The Chi-Square Automatic Interaction Detection (CHAID) option was used with a stopping criterion limited to a minimum number of 15 patients per terminal node.8
The ANN model was implemented using the Alyuda® (Neurointelligence) program that incorporates the multilayer Perceptron methodology with backpropagation.9
The strategy for incorporating variables in the models was the ‘full model’ type (inclusion of all the candidate variables); both models have automatic variable selection capability according to significance or hierarchy. The internal validation of the two models was carried out through cross validation (10 partitions). The discriminatory capacity of the models was determined by calculating the area under the ROC curve and percentages of correct classification (PCC).10
Results295 patients presented with pain in the RIF, and 43 were excluded: 15 with previous appendectomy, 5 with less than 6h of progressing symptoms, and 23 for lack of follow-up. The final study group consisted of 252 patients (Fig. 1).

From this total, 121 patients were admitted to the hospital, 107 of whom were treated surgically. Cases were defined by diagnostic groups: 114 cases of NsP, 93 AA, 30 NIRIF and 15 IRIF. The diagnoses included in the NIRIF classification were: 11 cases of urinary tract infections, 7 renal colic, 5 acute gastroenteritis, 2 partial bowel obstruction, one ovarian cyst and 4 ‘other diagnoses’. The diagnoses included in IRIF group were: 5 cases of pelvic inflammatory disease, 4 acute pyelonephritis, 2 tubo-ovarian abscess, 2 acute diverticulitis, one acute cholecystitis, and one inflammatory bowel disease.
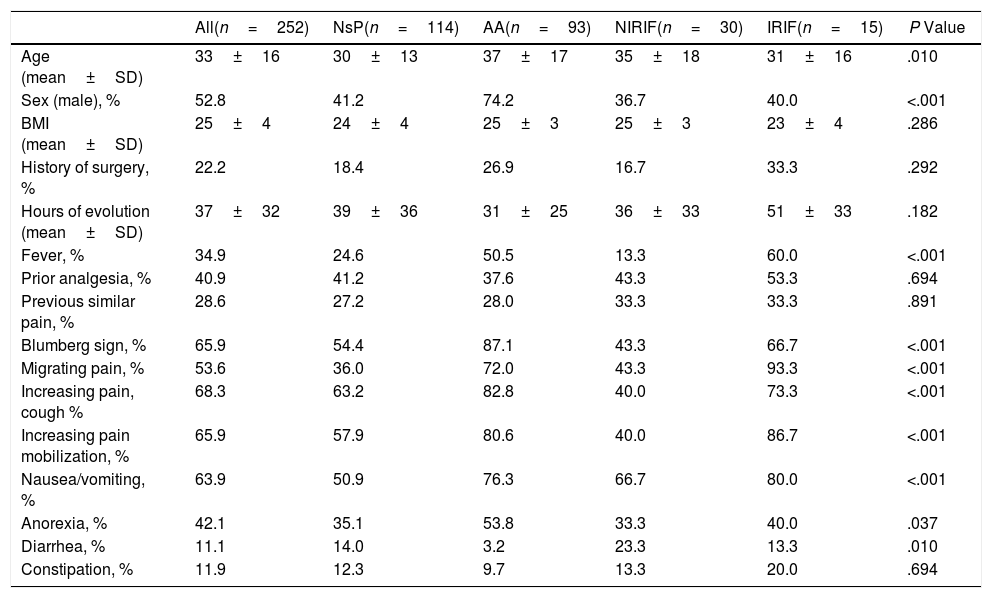
Table 1 shows the clinical characteristics of the patients included in the 4 diagnostic groups. In general, the patients are young, and there are no differences according to sex.
Demographic and Clinical Characteristics According to Diagnostic Groups (n=252).
| All(n=252) | NsP(n=114) | AA(n=93) | NIRIF(n=30) | IRIF(n=15) | P Value | |
|---|---|---|---|---|---|---|
| Age (mean±SD) | 33±16 | 30±13 | 37±17 | 35±18 | 31±16 | .010 |
| Sex (male), % | 52.8 | 41.2 | 74.2 | 36.7 | 40.0 | <.001 |
| BMI (mean±SD) | 25±4 | 24±4 | 25±3 | 25±3 | 23±4 | .286 |
| History of surgery, % | 22.2 | 18.4 | 26.9 | 16.7 | 33.3 | .292 |
| Hours of evolution (mean±SD) | 37±32 | 39±36 | 31±25 | 36±33 | 51±33 | .182 |
| Fever, % | 34.9 | 24.6 | 50.5 | 13.3 | 60.0 | <.001 |
| Prior analgesia, % | 40.9 | 41.2 | 37.6 | 43.3 | 53.3 | .694 |
| Previous similar pain, % | 28.6 | 27.2 | 28.0 | 33.3 | 33.3 | .891 |
| Blumberg sign, % | 65.9 | 54.4 | 87.1 | 43.3 | 66.7 | <.001 |
| Migrating pain, % | 53.6 | 36.0 | 72.0 | 43.3 | 93.3 | <.001 |
| Increasing pain, cough % | 68.3 | 63.2 | 82.8 | 40.0 | 73.3 | <.001 |
| Increasing pain mobilization, % | 65.9 | 57.9 | 80.6 | 40.0 | 86.7 | <.001 |
| Nausea/vomiting, % | 63.9 | 50.9 | 76.3 | 66.7 | 80.0 | <.001 |
| Anorexia, % | 42.1 | 35.1 | 53.8 | 33.3 | 40.0 | .037 |
| Diarrhea, % | 11.1 | 14.0 | 3.2 | 23.3 | 13.3 | .010 |
| Constipation, % | 11.9 | 12.3 | 9.7 | 13.3 | 20.0 | .694 |
AA: acute appendicitis; IRIF: RIF pain with inflammation; NIRIF: RIF pain with no inflammation; NsP: nonspecific RIF pain; BMI: body mass index.
Comparison between groups with the Chi-squared test; comparison of continuous variables with the Kruskal–Wallis test.
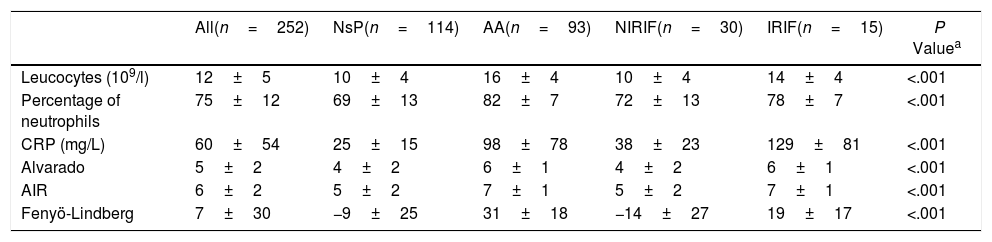
Table 2 shows the analytical variables and the scores of the classic models studied. If we calculate the ROC curves (AUC) of the scores for the single diagnosis of AA compared to the 3 remaining diagnoses, we obtain 0.82 (0.76–0.87) for the Alvarado score, 0.83 (0.77–0.88) for AIR and 0.88 (0.84–0.92) for Fenyö-Lindberg.
Analytical Characteristics and Alvarado, AIR and Fenyö-Lindberg Scores by Diagnostic Groups (n=252).
| All(n=252) | NsP(n=114) | AA(n=93) | NIRIF(n=30) | IRIF(n=15) | P Valuea | |
|---|---|---|---|---|---|---|
| Leucocytes (109/l) | 12±5 | 10±4 | 16±4 | 10±4 | 14±4 | <.001 |
| Percentage of neutrophils | 75±12 | 69±13 | 82±7 | 72±13 | 78±7 | <.001 |
| CRP (mg/L) | 60±54 | 25±15 | 98±78 | 38±23 | 129±81 | <.001 |
| Alvarado | 5±2 | 4±2 | 6±1 | 4±2 | 6±1 | <.001 |
| AIR | 6±2 | 5±2 | 7±1 | 5±2 | 7±1 | <.001 |
| Fenyö-Lindberg | 7±30 | −9±25 | 31±18 | −14±27 | 19±17 | <.001 |
AA: acute appendicitis; AIR: Appendicitis Inflammatory Response; IRIF: RIF pain with inflammation; NIRIF: RIF pain with no inflammation; NsP: nonspecific RIF pain; CRP: C-reactive protein.
Values as mean±SD.
The CHAID model selected 6 variables: number of leukocytes, CRP, painful cough, Blumberg sign, sex and evolution time.
The hierarchy of variables, selected automatically, is shown in Fig. 2. The first is the number of leukocytes and, according to the cut-off point (also determined automatically), the following variables are incorporated. The model determines 10 decision-making rules that are the final nodes.

The final nodes (Fig. 2) can be classified into 3 categories. Nodes 10, 11 and 13 show a clear classification for the NsP diagnostic group, nodes 7, 14 and 17 for AA diagnosis, and nodes 5, 12, 15 and 16 with a classification that is less clear (includes NIRIF and IRIF diagnoses), which can be considered special. For instance, these special groups required more ultrasounds compared to the groups with clearer classification (41.6 vs. 21.1; P<.01).
Artificial Neural Network ModelThe generated ANN model that is generated automatically selects 10 variables: Blumberg sign, pain migration, increased pain, increased pain with movement, pain when coughing, anorexia, temperature, number of leukocytes, hours of evolution and CRP levels. The architecture that is created automatically is comprised of an input layer (with the 10 selected variables), a hidden layer with 12 nodes and an output layer with the possibility of the 4 diagnostic groups. The model assigns for each patient (registry) a diagnostic group out of the 4 possible diagnostic probabilities. The ANN model also determines that the variable with the most weight is the number of leukocytes.
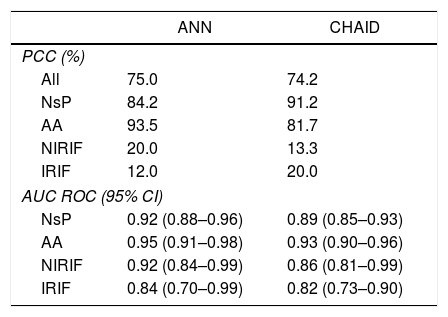
Table 3 compares the ANN model and the CHAID classification tree. No significant differences are observed between the PCC percentages or in the calculated ROC curves.
Comparison of the ANN Model and CHAID Classification Tree.
| ANN | CHAID | |
|---|---|---|
| PCC (%) | ||
| All | 75.0 | 74.2 |
| NsP | 84.2 | 91.2 |
| AA | 93.5 | 81.7 |
| NIRIF | 20.0 | 13.3 |
| IRIF | 12.0 | 20.0 |
| AUC ROC (95% CI) | ||
| NsP | 0.92 (0.88–0.96) | 0.89 (0.85–0.93) |
| AA | 0.95 (0.91–0.98) | 0.93 (0.90–0.96) |
| NIRIF | 0.92 (0.84–0.99) | 0.86 (0.81–0.99) |
| IRIF | 0.84 (0.70–0.99) | 0.82 (0.73–0.90) |
AA: acute appendicitis; AUC: area under the curve; IRIF: RIF pain with inflammation; NIRIF: RIF pain with no inflammation; NsP: nonspecific RIF pain; PCC: percent correctly classified; ANN: artificial neural network.
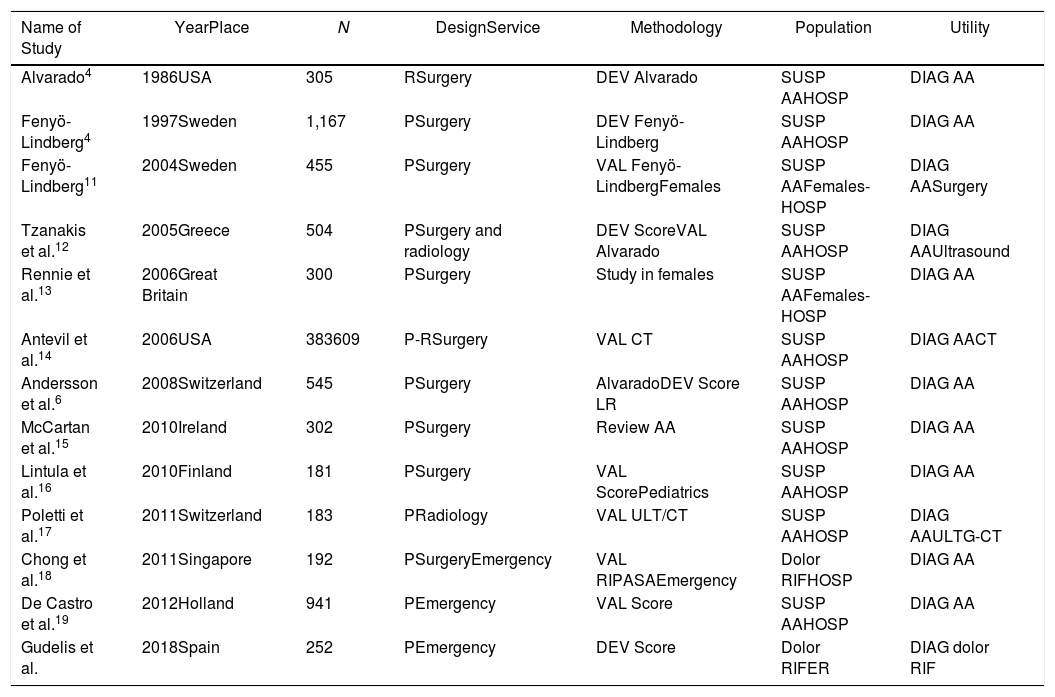
This study was compared with other studies published in the literature about pain in the RIF (Table 4). The sample sizes were reviewed and showed notable variability (the majority ranged between 139 and 545 patients, the largest being 941 patients).19
Descriptive Comparison of Our Study With Other Published Articles About RIF Pain.
| Name of Study | YearPlace | N | DesignService | Methodology | Population | Utility |
|---|---|---|---|---|---|---|
| Alvarado4 | 1986USA | 305 | RSurgery | DEV Alvarado | SUSP AAHOSP | DIAG AA |
| Fenyö-Lindberg4 | 1997Sweden | 1,167 | PSurgery | DEV Fenyö-Lindberg | SUSP AAHOSP | DIAG AA |
| Fenyö-Lindberg11 | 2004Sweden | 455 | PSurgery | VAL Fenyö-LindbergFemales | SUSP AAFemales-HOSP | DIAG AASurgery |
| Tzanakis et al.12 | 2005Greece | 504 | PSurgery and radiology | DEV ScoreVAL Alvarado | SUSP AAHOSP | DIAG AAUltrasound |
| Rennie et al.13 | 2006Great Britain | 300 | PSurgery | Study in females | SUSP AAFemales-HOSP | DIAG AA |
| Antevil et al.14 | 2006USA | 383609 | P-RSurgery | VAL CT | SUSP AAHOSP | DIAG AACT |
| Andersson et al.6 | 2008Switzerland | 545 | PSurgery | AlvaradoDEV Score LR | SUSP AAHOSP | DIAG AA |
| McCartan et al.15 | 2010Ireland | 302 | PSurgery | Review AA | SUSP AAHOSP | DIAG AA |
| Lintula et al.16 | 2010Finland | 181 | PSurgery | VAL ScorePediatrics | SUSP AAHOSP | DIAG AA |
| Poletti et al.17 | 2011Switzerland | 183 | PRadiology | VAL ULT/CT | SUSP AAHOSP | DIAG AAULTG-CT |
| Chong et al.18 | 2011Singapore | 192 | PSurgeryEmergency | VAL RIPASAEmergency | Dolor RIFHOSP | DIAG AA |
| De Castro et al.19 | 2012Holland | 941 | PEmergency | VAL Score | SUSP AAHOSP | DIAG AA |
| Gudelis et al. | 2018Spain | 252 | PEmergency | DEV Score | Dolor RIFER | DIAG dolor RIF |
AA: acute appendicitis; DEV: development; DIAG: diagnosis; ULT: ultrasound; RIF: right iliac fossa; HOSP: hospitalized patients; P: prospective; R: retrospective; LR: logistic regression model; SUSP AA: suspected AA; CT: computed tomography; ER: emergency room; VAL: validation.
One of the contributions of our study is the use of 4 classification groups. In our series, the largest group of patients was the NsP group. In the studies that were carried out with more select patients (after having passed through an initial ‘filter’ in the ER), this group was more reduced.13,14
The AA group included all the patients who were admitted to the surgery department and treated surgically for suspected AA, whose diagnosis was confirmed by anatomic pathology. The percentage of these patients varied according to the inclusion criteria of the different studies published.17
In our study, the AA diagnosis was determined by the anatomic pathology. If we considered patients with suspected AA who underwent surgery, we found that only 6 (5.7%) patients did not present an anatomic pathology diagnosis of AA (3 with final diagnosis of NsP and 3 IRIF). This percentage (5.7%) of negative appendectomies is lower than reports from other series ranging between 10% and 23%.7,11,15
We believe that the use of two other NIRIF and IRIF diagnostic categories provides a broader view of the problem and a classification that behaves differently for determining a diagnosis (more imaging tests will be needed) as well as treatment and prognosis.
The main advantage of the model based on classification trees, which in our case is the CHAID type, is that the model is easy to interpret. The classification rules that are generated include all possible patients and aspects of different subgroups, such as age and sex.20,21
The CHAID model has detected that the most important variable is the number of leukocytes (coinciding with the ANN model). The CHAID also includes the CRP level in the second line. It is also interesting to note that the clinical variable included is pain when coughing. During the clinical examination, this pain does not depend on the explorer but on a maneuver far from direct abdominal examination. The 10 classification rules generated have been grouped according to the main diagnostic possibility. Clearer rules can be found for the diagnosis of NsP and AA (which we call ‘special’) where the differential diagnosis reaches a greater prominence since the NIRIF and IRIF groups are more present.
Other series have been published using different classification tree methodologies, such as CART, but they only differentiated between AA and non-AA. Models have also been made with clinical and analytical variables,22 using the combination with Alvarado23 and adding imaging tests.24
The ANN model used achieves acceptable values of discriminating capacity. The disadvantage of this model is that it works like a ‘black box’ and cannot be interpreted in a simple manner for clinical use, since it consists of 480 parameters (10×12×4) that include all the interactions between the input variables, those of the hidden layer and those of the output nodes. A computer is necessary for its use, and it functions as a comparative model. The ANN uses all the interconnections of the variables used and is not more accurate than CHAID-based model. Other studies have used ANN for the diagnosis of AA (focusing only on AA and non-AA).25
This study also has several limitations. The main one is the assignment of the groups used. These are groups that have not been validated by the literature, and AA is considered to be an inflammatory process. It would be interesting to have a larger sample size, especially in the NIRIF and IRIF diagnostic groups. In defense of the study, we believe that the models that only compare AA versus other conditions have less capacity to be used in real patient management.
In conclusion, we believe that professionals who treat patients with RIF pain can benefit from models that are easy to interpret and provide a classification with more than two possibilities (AA vs. non-AA). The generated CHAID model has achieved this objective, although it should be validated in other larger series.
FundingNo funding was received to conduct this study.
Conflict of InterestsWe have no conflict of interests to declare.
Please cite this article as: Gudelis M, Lacasta Garcia JD, Trujillano Cabello JJ. Dolor agudo en fosa ilíaca derecha. Un nuevo algoritmo de diagnóstico basado en árboles de clasificación y red neuronal artificial. Cir Esp. 2019;97:329–335.
