


Adverse event (AE) rates in general surgery vary, according to different authors and recording methods, between 2% and 30%. Six years ago we designed a prospective AE recording system to change patient safety culture in our department. We present the results of this work after a 6-year follow-up.
Material and methodThe AE, sequelae and health care errors in a University Hospital surgery department were recorded. An analysis of each incident recorded was performed by a reviewer. The data were entered into database for rapid access and consultation. The results were routinely presented in departmental morbidity–mortality sessions.
ResultsA total of 13950 patients had suffered 11254 AE, which affected 5142 of them (36.9% of admissions). A total of 920 patients were subjected to at least one health care error (6.6% of admissions). This meant that 6.6% of our patients suffered an avoidable AE. The overall mortality at 5 years in our department was 2.72% (380 deaths). An adverse event was implicated in the death of the patient in 180 cases (1.29% of admissions). In 49 cases (0.35% of admissions), mortality could be attributed to an avoidable AE. After 6 years there tends to be an increasingly lower incidence of errors.
ConclusionsThe exhaustive and prospective recording of AE leads to changes in patient safety culture in a surgery department and helps decrease the incidence of health care errors.
Las cifras de efectos adversos (EA) en cirugía general varían según diferentes autores y metodologías de recogida entre un 2 y un 30%. Diseñamos hace 6 años un sistema prospectivo de recogida de EA para cambiar la cultura de seguridad del paciente en nuestro servicio. Presentamos los resultados de este trabajo tras 6 años de seguimiento.
Material y métodoRecogida prospectiva de los EA, secuelas y errores asistenciales en un servicio de cirugía de un hospital universitario. Análisis mediante revisor de cada incidente recogido. Los datos se recogen en una base de datos de acceso y consulta inmediata. Los resultados se exponen rutinariamente en sesiones de morbi-mortalidad del servicio.
ResultadosUn total de 13.950 pacientes han sufrido 11.254 EA que han afectado a 5.142 de ellos (36,9% de los ingresos). Un total de 920 pacientes han presentado al menos un error asistencial (6,6% de los ingresos). Esto significa que 6,6% de nuestros pacientes sufren EA evitables. La mortalidad global de nuestro servicio en estos 5 años es de 2,72% (380 exitus). En 180 casos un EA ha estado implicado en la mortalidad del paciente (1,29% de los ingresos). En 49 casos, esta mortalidad puede atribuirse a un EA evitable (0,35% de los ingresos). Tras 6 años se tiende a cada vez menor presentación de errores.
ConclusionesLa recogida exhaustiva y prospectiva de EA cambia la cultura de seguridad del paciente en un servicio de cirugía y permite disminuir la incidencia de errores asistenciales.
Since the Brennan et al. study1 in 1991, there have been numerous articles on adverse effects in general surgery. Using different methodologies, adverse effect figures ranging between 2% and 30% have been published in our field. The wide range can be explained by the study design, the thoroughness of data collection and the different definitions of adverse effects. In Spain, the national survey on adverse effects associated with hospitalisation (ENEAS)2,3 marked a major turning point in the description of adverse effects. The surgery department at the Hospital Universitario Parc Taulí4 published the results of a prospective follow-up of adverse effects in 2008 (30% incidence). This can be explained by the methodology used which collected all episodes and used evaluation by pairs for each episode that could be an adverse effect (AE).
Five years after this systematic collection, we believe that we are able to provide figures for adverse effects, as well as care and errors and errors in the classification of the severity of adverse effects. They may serve as a foundation upon which all other surgical departments can be compared. The aim of this study was to provide these data as well as, more importantly, to demonstrate a way of working that is capable of leading health care providers to undertake changes regarding patient safety culture.
Material and MethodsScopeThe study took place in a hospital with a reference population of 427219 inhabitants. In 2009, it had 808 beds and admitted 28821 patients. In the same year, it performed 32654 interventions, including 8996 conventional surgery procedures, 10077 major outpatient surgery procedures and 13581 minor surgery procedures. Some 3232 were admitted to general surgery, including 799 to outpatient surgery, and 5314 interventions were performed, including 2159 conventional procedures and 799 outpatient procedures.
PatientsAll consecutive patients admitted for surgery between 1 January 2005 and 1 December 2010 were included, with no exceptions. Those admitted to, then discharged from, the emergency department, as well as those who underwent minor surgery or major outpatient surgery were not included.
DefinitionsAn adverse effect (AE)5 is the unintended consequence or injury to the patient due to treatment, and not due to the underlying disease. A preventable adverse effect is an adverse event or effect attributable to error6; a health care error is one produced by failures in the planning or diagnosing or therapeutic or care procedures.
The probability that a given event was an AE was measured on a 6-point scale by the Harvard Medical Practice Study group.1 The scale runs from 0: little or no evidence that care management caused the AE; 1 point: little evidence; 2 points: unlikely; 3 points: quite likely; 4 points: very likely; and 5 points: the AE was definitely caused by poor health care. The sequelae are ranked on a 7-point scale7: none, minimal, moderate, permanent, and death. The error is classified on a 4-point preventability scale8 ranging from no error to fatal error.
MethodA protected Access database was prepared in compliance with the Spanish organic law 15/1999, of 13 December, on the protection of personal data. Each clinical event that may have been an AE was entered by the person identifying it. A member of the surgery department, not directly involved in handling the patient, reviewed it and assessed whether the event was an AE, sequelae or error.
It was considered an AE when the average score of 2 reviewers was ≥3, as established in the reference studies.1 Those between little or not evidence and unlikely AE (scores 0, 1 and 2) were not included in the AE study. If there was a significant discrepancy between the 2 reviewers (by 2 or more points), it went to a 3rd reviewer. This person was a surgeon outside our hospital who was consulted once a week. His decision was final.
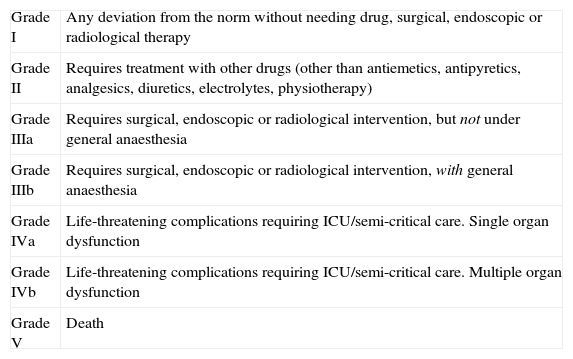
Assessment of the associated damage and the degree of disability caused was reviewed in the same way as the AE using the Brennan et al. scale.1 The Clavien classification9 was introduced in January 2009. This classifies adverse effects in different degrees (Table 1). The error is evaluated with an analysis methodology similar to that for AE and sequelae.
Clavien Classification of Adverse Effects.
| Grade I | Any deviation from the norm without needing drug, surgical, endoscopic or radiological therapy |
| Grade II | Requires treatment with other drugs (other than antiemetics, antipyretics, analgesics, diuretics, electrolytes, physiotherapy) |
| Grade IIIa | Requires surgical, endoscopic or radiological intervention, but not under general anaesthesia |
| Grade IIIb | Requires surgical, endoscopic or radiological intervention, with general anaesthesia |
| Grade IVa | Life-threatening complications requiring ICU/semi-critical care. Single organ dysfunction |
| Grade IVb | Life-threatening complications requiring ICU/semi-critical care. Multiple organ dysfunction |
| Grade V | Death |
The monthly and quarterly results for the department and each unit were reported at the morbidity and mortality session, allowing for continuous feedback. The database was accessible to any member of the surgery department, who was able to access reports containing the most important results.
Some clinical units introduced a risk stratification system for surgical patients supported by the medical literature, specifically, POSSUM,10 P-POSSUM, O-POSSUM and CR-POSSUM. For this purpose, AE was classified as valid for POSSUM or not using the original definitions in the Tekkis et al. article.10
StatisticsThe results are presented as raw numbers. No analytical studies were performed, only descriptive ones. Agreement was calculated using the weighted kappa test (quadratic weighting).
ResultsA total of 13950 patients were analysed, with at least 5142 experiencing an adverse effect (36.9% of patients admitted to our hospital). Out of a total of 11998 possible adverse effects reported, 11254 were finally classified as an adverse effect. In 3090 cases, the adverse effect was one of those described in POSSUM. A total of 22.2% of our patients had an adverse effect included in POSSUM. There were at least 920 patients with preventable adverse effects or health care errors (6.6% of admissions). The overall mortality in these 5 years was 2.72% (380 deaths). An AE was involved in mortality in 180 cases (1.29% of admissions). The mortality was attributable to preventable AE in 49 cases (0.35% of admissions).
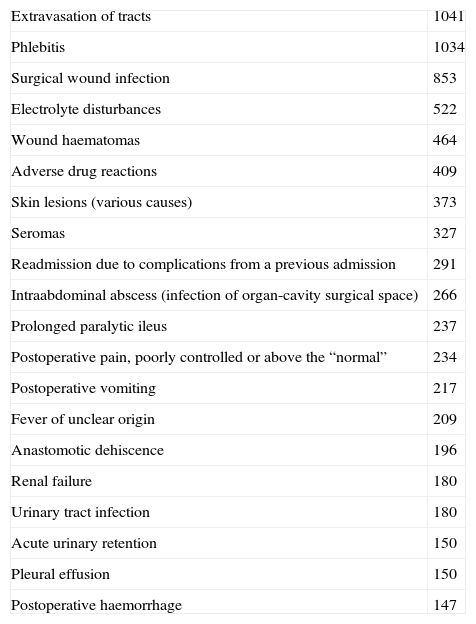
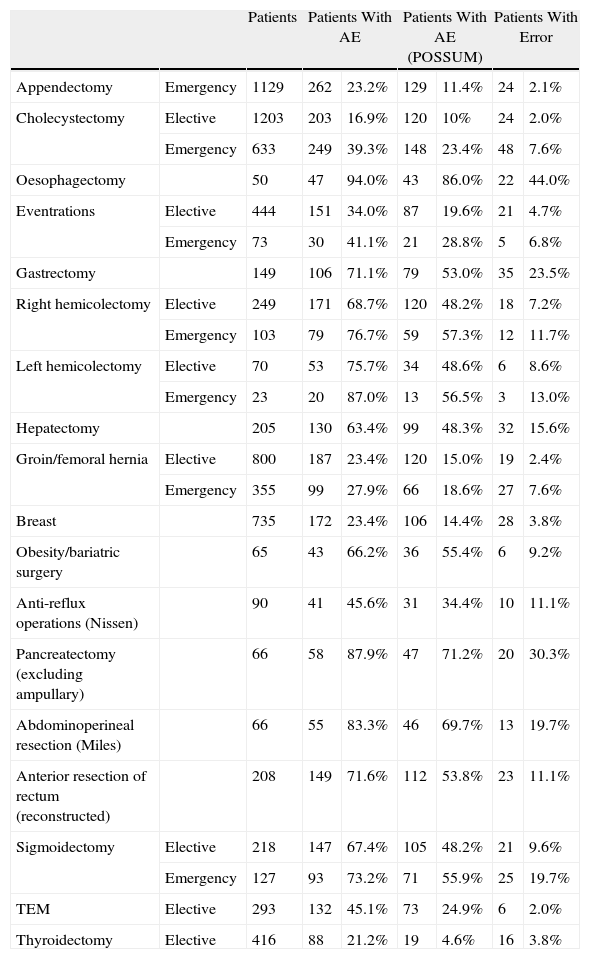
Table 2 shows the 20 most common adverse effects. Table 3 shows complex patients according to the surgical procedure they underwent.
Most Frequent Adverse Effects.
| Extravasation of tracts | 1041 |
| Phlebitis | 1034 |
| Surgical wound infection | 853 |
| Electrolyte disturbances | 522 |
| Wound haematomas | 464 |
| Adverse drug reactions | 409 |
| Skin lesions (various causes) | 373 |
| Seromas | 327 |
| Readmission due to complications from a previous admission | 291 |
| Intraabdominal abscess (infection of organ-cavity surgical space) | 266 |
| Prolonged paralytic ileus | 237 |
| Postoperative pain, poorly controlled or above the “normal” | 234 |
| Postoperative vomiting | 217 |
| Fever of unclear origin | 209 |
| Anastomotic dehiscence | 196 |
| Renal failure | 180 |
| Urinary tract infection | 180 |
| Acute urinary retention | 150 |
| Pleural effusion | 150 |
| Postoperative haemorrhage | 147 |
Adverse Effects by Most Relevant Procedures.
| Patients | Patients With AE | Patients With AE (POSSUM) | Patients With Error | |||||
| Appendectomy | Emergency | 1129 | 262 | 23.2% | 129 | 11.4% | 24 | 2.1% |
| Cholecystectomy | Elective | 1203 | 203 | 16.9% | 120 | 10% | 24 | 2.0% |
| Emergency | 633 | 249 | 39.3% | 148 | 23.4% | 48 | 7.6% | |
| Oesophagectomy | 50 | 47 | 94.0% | 43 | 86.0% | 22 | 44.0% | |
| Eventrations | Elective | 444 | 151 | 34.0% | 87 | 19.6% | 21 | 4.7% |
| Emergency | 73 | 30 | 41.1% | 21 | 28.8% | 5 | 6.8% | |
| Gastrectomy | 149 | 106 | 71.1% | 79 | 53.0% | 35 | 23.5% | |
| Right hemicolectomy | Elective | 249 | 171 | 68.7% | 120 | 48.2% | 18 | 7.2% |
| Emergency | 103 | 79 | 76.7% | 59 | 57.3% | 12 | 11.7% | |
| Left hemicolectomy | Elective | 70 | 53 | 75.7% | 34 | 48.6% | 6 | 8.6% |
| Emergency | 23 | 20 | 87.0% | 13 | 56.5% | 3 | 13.0% | |
| Hepatectomy | 205 | 130 | 63.4% | 99 | 48.3% | 32 | 15.6% | |
| Groin/femoral hernia | Elective | 800 | 187 | 23.4% | 120 | 15.0% | 19 | 2.4% |
| Emergency | 355 | 99 | 27.9% | 66 | 18.6% | 27 | 7.6% | |
| Breast | 735 | 172 | 23.4% | 106 | 14.4% | 28 | 3.8% | |
| Obesity/bariatric surgery | 65 | 43 | 66.2% | 36 | 55.4% | 6 | 9.2% | |
| Anti-reflux operations (Nissen) | 90 | 41 | 45.6% | 31 | 34.4% | 10 | 11.1% | |
| Pancreatectomy (excluding ampullary) | 66 | 58 | 87.9% | 47 | 71.2% | 20 | 30.3% | |
| Abdominoperineal resection (Miles) | 66 | 55 | 83.3% | 46 | 69.7% | 13 | 19.7% | |
| Anterior resection of rectum (reconstructed) | 208 | 149 | 71.6% | 112 | 53.8% | 23 | 11.1% | |
| Sigmoidectomy | Elective | 218 | 147 | 67.4% | 105 | 48.2% | 21 | 9.6% |
| Emergency | 127 | 93 | 73.2% | 71 | 55.9% | 25 | 19.7% | |
| TEM | Elective | 293 | 132 | 45.1% | 73 | 24.9% | 6 | 2.0% |
| Thyroidectomy | Elective | 416 | 88 | 21.2% | 19 | 4.6% | 16 | 3.8% |
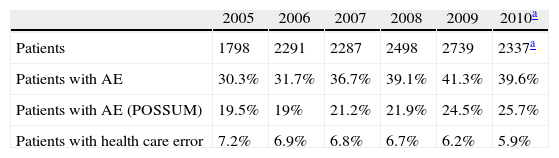
Table 4 shows the development of AE and health care errors over these 6 years.
The vast majority of AE had minimal or moderate sequelae, as shown in Table 5.
Classification of the Severity of Adverse Effects According to Brennan.
| Elective Surgery | Emergency Surgery | |||
| Without sequelae | 6 | 0.1% | 0 | 0.0% |
| Minimum sequelae | 6206 | 82.1% | 2842 | 77.0% |
| Moderate, recovery period: 1–6 months | 987 | 13.1% | 572 | 15.5% |
| Moderate, recovery period: >6 months | 149 | 2.0% | 104 | 2.8% |
| Permanent (<50% disability) | 89 | 1.2% | 47 | 1.3% |
| Permanent (≥50% disability) | 17 | 0.2% | 11 | 0.3% |
| Death | 77 | 1.0% | 104 | 2.8% |
| Insufficient data | 30 | 0.4% | 13 | 0.4% |
| Total | 7561 | 100.0% | 3693 | 100.0% |
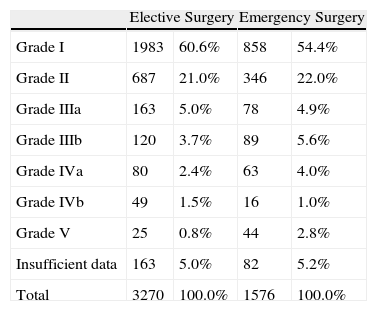
Table 6 summarises the severity of complications according to Clavien, which only began to be used in 2009, so not all are evaluated against this scale.
Severity of Complications According to Clavien.
| Elective Surgery | Emergency Surgery | |||
| Grade I | 1983 | 60.6% | 858 | 54.4% |
| Grade II | 687 | 21.0% | 346 | 22.0% |
| Grade IIIa | 163 | 5.0% | 78 | 4.9% |
| Grade IIIb | 120 | 3.7% | 89 | 5.6% |
| Grade IVa | 80 | 2.4% | 63 | 4.0% |
| Grade IVb | 49 | 1.5% | 16 | 1.0% |
| Grade V | 25 | 0.8% | 44 | 2.8% |
| Insufficient data | 163 | 5.0% | 82 | 5.2% |
| Total | 3270 | 100.0% | 1576 | 100.0% |
Agreement between both reviewers for the definition of AE had a kappa value of 0.37. The agreement for sequelae had a kappa value of 0.82; for the presence or absence of care error and its severity, it was 0.78; and, finally, for the classification of AE according to severity (Clavien scale), it was 0.93.
DiscussionThis was the largest continuous prospective study that we know in the medical literature to determine the presence of adverse effects and errors during the health care process for our patients. It is also by far the largest study in general surgery, and can be compared with the great classical retrospective studies, UTCOS11 and QAHCS,12 which retrospectively included 14000 patients. In Spain, the reference study is the excellent ENEAS study by Aranaz et al.,3 which retrospectively analysed 5624 patients from several medical and surgical specialties. In addition, the same group recently published a study in the surgical field that showed that 17.8% of surgery patients experienced an AE,13 after a review of 989 medical histories.
Our incidence of adverse effects is higher than in the aforementioned studies. Our percentage of 36.9% compares unfavourably with any of these cited studies. The Utah and Colorado Study (UTCOS),11 for example, including 28 hospitals and 14565 patients, gave an incidence of 2.9%. The Quality in Australian Health Care Study (QAHCS)12 including 28 hospitals and 14179 patients reported a 16.6% incidence. The aforementioned study by Aranaz et al.2 including 24 hospitals and 5624 patients noted a 9.3% incidence, whilst Aranaz again in the surgery field13 found 17.8%. However, our data collection methodology was prospective, it did not depend on clinical history and it allowed any physician attending the patient to enter the episode as a possible AE. Using this data collection format, the probability of missing any AE is very low.4,14,15 Our explanation for our figure is that we have underdiagnosed very little, unlike other studies using different methodologies. An excellent prospective study along the same lines in 8 French hospitals16 suggests that the percentage of patients affected by errors is 9.3% when data are prospectively collected. This figure is higher than ours, which confirms that we are not far from reality when we say that 6.6% of our patients suffered an error. In trauma, Ivatury et al.17 states that 9.9% of deaths involve an AE, and in 16 cases the AE is responsible for the death.
From the very beginning, our approach was that data should be collected as a check on the quality of care and to support the establishment of a culture of patient safety. These objectives are not achieved quickly. Our experience shows that surgeons are initially reluctant to enter all incidents experienced by the patient onto a database. Only a continuous and systematic data collection throughout these 6 years has allowed us to establish ground rules that now make a few of us fear entering health care errors onto a database. Although it is not within the remit of this study to explain all the processes that we have developed to establish this safety culture in our department, it is suffice to say that they are slow, and must be done with extreme care.
The quality of the data entered is another point of discussion. There are no external reviewers or quality controls. Therefore, if someone enters incorrect or poorly defined diagnostic data from the International Classification of Diseases (ICD9), such data will remain forever on the database. This is a common problem for any hospital that enters their data as ICD9 and analyses them on the basis of the minimum set of hospital discharge data. Their disadvantages have been extensively analysed in other articles and we will not dwell on them here, except to comment that our database had the same problems. Over time, our units have become more experienced, we have used the database more often and with better data, leading to its improvement.
Although the follow-up period is 30 days after discharge, we have not established any control to confirm that this actually takes place. In line with the discussion above, we are aware of the existence of variability with respect to the endpoint of data collection. The figures we provide, therefore, represent the lower threshold, and may underestimate the real figures. However, we believe that the data remain valid as an overall guide for AE in a department.
The main use of working this way is to continuously monitor the key indicators in a surgery department. Anyone can detect deviations from their own historical average that lead to a detailed analysis. For example, the database detected an abnormal increase in the adverse effects of epidermolysis caused by surgical tape. The problem was quickly resolved, and the figures provided by the database were submitted to the purchasing department and management to prevent any discussion of prices. Deviations observed in nosocomial and surgical site infection rates were also quickly detected and allow corrective action to be taken very early. Obviously, simply collecting the data is not enough: they must be interpreted and used proactively to improve health care.
How to treat and especially how to present health care errors are still a controversial issues within our department, and not unique to Spain.18 All of us are now accustomed to morbidity and mortality sessions where these errors are discussed naturally with the intention to make improvements. In fact, other authors have shown that the use of data similar to ours generates a useful feedback, leading to a marked improvement in health care.19,20 However, we still hesitate to present our mistakes in the medical literature.21 To our knowledge, nobody has collected a database with an analysis of 920 health care errors. The most important thing is that some of them practically disappear after being discussed, presented at a case session, or exposed. We are especially proud of the historical evolution of the incidence of errors. This is very important, because the incorporation of different clinical units to data collection has been at different speeds, and therefore, each new unit being incorporated leads to a peak in AE and errors that coincide with the beginning of systematic and comprehensive collection by a new team. This is well-known (the Hawthorne effect22) and is because there is a change in the way subjects work when they know they are being monitored. In fact, from the initial study design, the Hawthorne effect has always been used for the benefit of our patients.
Questions may arise, such as ‘Why aren’t errors dramatically lowered?’ or ‘Why doesn’t the percentage of our patients decrease but actually has a tendency to rise?’ We are absolutely convinced that human beings will continue to make mistakes.23 We found when we analysed our patterns of errors that as soon as one error decreases, and a temporary decrease in the overall rate is seen, another type of systematic error soon appears.24 We believe the key factor is continuous monitoring to detect new patterns of presentation, analyse them and correct them early, so that the system protects our patients from human error. There is much work to do: attitudes that promote patient safety must be learned and developed, such as adopting safety systems already validated in high-risk industries. Training health professionals also consists of developing non-technical skills such as communication, decision-making, and teamwork.25,26 In short, we must overcome the error approach and move forward by examining the connections and interactions of different levels of health care.27
The data we have offered in this article are macroscopic data. They are a good guide to see if the right things are being done. However, the microscopic data on the database can also be studied. ‘What health care errors are the most frequent and what measures can be implemented to resolve them?’ is an example of a question we can answer immediately and easily. Trend analysis of certain adverse effects and possible measures to modify these trends are other examples of actions to which our database can be put. A detailed analysis of these possibilities is something beyond a single article.
Finally, we emphasise that all these responses were generated within the surgery department itself, without external evaluators, almost immediately and as a result of the patient safety culture we have created after 6 years of hard work. We believe that this is the way forward.
Conflicts of InterestThe authors have no conflicts of interest to declare.
Please cite this article as: Rebasa P, et al. Efectos adversos en cirugía general. Análisis prospectivo de 13.950 pacientes consecutivos. Cir Esp. 2011;89:599-605.
This project has been presented partially at the 28th Congreso Nacional de Cirugía (Spanish Congress of Surgery), Madrid.
articles

Cirugía Española (English Edition) follows the Recommendations for the Conduct, Reporting, Editing and Publication of Scholarly Work in Medical Journals