


Prostate cancer (PCa) shows varied aggressiveness, complicating personalised treatment decisions. Traditional risk stratification systems rely on clinical parameters but may miss crucial genetic insights. The Prostatype® score (P-score) integrates gene expression with clinical data to improve PCa risk assessment precision.
ObjectivesTo validate the P-score’s predictive performance for prostate cancer-specific mortality (PCSM) and metastasis in a Spanish cohort, comparing it with NCCN, D’Amico, and EAU systems.
Materials and methodsThis study was multicentre, retrospective and included seven Spanish hospitals. Of 154 core needle biopsies, 93 met RNA criteria, and for those, P-score was calculated based on IGFBP3, VGLL3, and F3 genes expression and clinical data.
The primary endpoint was PCa-specific mortality (PCSM), with secondary endpoints being development of metastasis, adverse pathology (AP), and International Society of Urological Pathology (ISUP) grading.
ResultsThe P-score demonstrated superior accuracy in predicting 10-year PCSM, with an AUC of 0.81 and a C-index of 0.75, outperforming NCCN (AUC 0.77, C-index 0.69) and D’Amico/EAU (AUC 0.70, C-index 0.62). For metastasis prediction, the P-score achieved a C-index of 0.77, significantly higher than NCCN, D’Amico, and EAU (0.58). Kaplan–Meier analysis underscored the P-score’s ability to better stratify patients by risk, especially high-risk groups. Additionally, the P-score correlated with tumour burden, showing significant associations with positive biopsy cores (p = 0.017) and ISUP grade at radical prostatectomy (p = 0.0028).
ConclusionsIn this Spanish cohort, the P-score outperformed traditional clinicopathological systems in predicting PCSM, development of metastasis, and pathological markers, supporting its clinical utility for more personalised PCa management.
El cáncer de próstata (CaP) muestra una agresividad variada, lo que complica las decisiones de tratamiento personalizadas. Los sistemas tradicionales de estratificación del riesgo se basan en parámetros clínicos, pero pueden pasar por alto aspectos genéticos cruciales. El P-score de Prostatype® integra la expresión genética con los datos clínicos para optimizar la precisión de la evaluación del riesgo de CaP.
ObjetivosValidar el rendimiento predictivo del p-score para la mortalidad específica por cáncer de próstata (MECP) y la metástasis en una cohorte española, y compararlo con los sistemas de NCCN, D'Amico y EAU.
Materiales y métodosSe realizó un estudio multicéntrico y retrospectivo que incluyó siete hospitales españoles. De un total de 154 biopsias con aguja gruesa, 93 cumplieron los criterios de calidad del ARN. En estas muestras se calculó el P-score en función de la expresión génica de IGFBP3, VGLL3 y F3, junto con los datos clínicos correspondientes. El objetivo principal fue la mortalidad específica por cáncer de próstata (MECP), mientras que los objetivos secundarios incluyeron el desarrollo de metástasis, la presencia de patología adversa (PA) y el grado según la clasificación de la International Society of Urological Pathology (ISUP).
ResultadosEl P-score demostró una mayor precisión en la predicción de la MECP a 10 años, con un AUC de 0,81 y un índice C de 0,75, superando a los sistemas NCCN (AUC 0,77, índice C 0,69) y D'Amico/EAU (AUC 0,70, índice C 0,62). Para la predicción de metástasis, el P-score alcanzó un índice C de 0,77, significativamente superior a NCCN, D'Amico y EAU (0,58). El análisis de Kaplan–Meier destacó la capacidad mayor del P-score para estratificar el riesgo, especialmente en los grupos de alto riesgo. Además, el P-score se correlacionó con la carga tumoral, con asociaciones significativas con el número de cilindros positivos en la biopsia (p = 0,017) y el grado ISUP en la prostatectomía radical (p = 0,0028).
ConclusionesEn esta cohorte española, el P-score superó a los sistemas clinicopatológicos tradicionales en la predicción de la MECP, el desarrollo de metástasis y los marcadores patológicos, lo que respalda su utilidad clínica para un manejo más personalizado del CaP.
Prostate cancer (PCa) is the second most common cancer in men globally, presenting a wide spectrum of clinical behaviours, from indolent cases that may only require monitoring to highly aggressive forms that demand immediate intervention. Spain has become one of the European countries with the lowest PCa mortality rates (13.2 deaths per 100,000 person-years),1 with the majority (89.8% in 20102) of initial PCa diagnoses in Spain being localised, non-metastatic disease. The common treatment options for PCa include radical prostatectomy (RP), radiation therapy (RT) and hormone therapy, as well as active surveillance (AS). Each method, apart from AS, is associated with potential adverse effects such as erectile dysfunction, urinary incontinence and others, while AS is connected to illness uncertainty.3 Therefore, accurate risk stratification at diagnosis is crucial for guiding individualised treatment decisions.4,5 There are several risk stratification systems. The D’Amico system uses nomograms combining prostate-specific antigen (PSA), clinical tumour stage (cT-stage), and Gleason Score (GS), and stratifies patients into low, intermediate, and high-risk groups.6 The European Association of Urology (EAU) system adds percentage of biopsy core.7 The National Comprehensive Cancer Network (NCCN) system adds to the PSA, cT-stage, and GS, tumour volume and extent of disease. Moreover, it divides the intermediate group into favourable and unfavourable, and adds very low and very high-risk groups, making it a more granular system.8 Currently, a substantial proportion of PCa patients are overtreated, leading to impaired quality of life and health-economic burden.9
Prostatype® score (P-score) is a risk stratification system, which integrates a three-gene signature (IGFBP3 encoding for insulin-like growth factor binding protein 3, VGLL3 encoding for vestigial-like family member 3, and F3 encoding for coagulation factor III) and clinicopathological parameters (GS, PSA, cT-stage) for accurate assessment of PCa-specific mortality (PCSM) risk. By incorporating genetic biomarkers, the P-score showed improved stratification of PCa patients, and hence, it can facilitate the choice of treatment.10–12
This study aimed to validate the clinical utility of the P-score in the Spanish population, comparing its performance in predicting PCSM and metastasis with established risk classification systems (NCCN, D’Amico, and EAU). By assessing whether the P-score offers superior risk stratification and prognostic power, this study sought to provide evidence for incorporating genetic markers into routine clinical practice to support more personalised PCa management.
Material and methodsStudy cohort and specimen collectionThis multicentre retrospective study included patients with PCa from seven Spanish hospitals. Eligible patients (50–100 years old) had localised PCa (EUA risk group) diagnosed between 2000–2017, no metastasis at diagnosis, underwent curative treatments (RP, RT +/− ADT), and had available core needle biopsies (CNB) and medical records containing relevant clinicopathological data. Exclusion criteria: unavailable medical records or CNB material, insufficient tissue (<2 mm), inadequate RNA quality, metastasis at diagnosis, or non-cancer related deaths. A total of 154 patients were screened, and 93 were eligible for final analysis. Formalin-fixed, paraffin-embedded (FFPE) CNBs were obtained from each hospital and sent to Hospital Universitario La Paz for analysis. The cohort selection and specimen handling are described in detail in supplemental material.
The study complied with the Declaration of Helsinki and was approved by the Regional Ethics Committee in Spain. Patient material was anonymised, patient consent was obtained.
Gene expression analysis and P-score calculationExpression levels of the genes IGFBP3, F3, and VGLL3 were assessed with the Prostatype® RT-qPCR kit, and the P-score was calculated as described in the supplemental material and in Söderdahl et al.12 Patients were classified into three P-score risk groups (low-, intermediate-, and high-risk) based on the calculated score. For comparative analysis, patients were also classified using the NCCN, D’Amico, and EAU risk stratification systems.
EndpointsThe primary endpoint was PCa-specific mortality (PCSM). The secondary endpoints were development of metastases, percentage positive biopsy cores (PPB), adverse pathology (AP), and International Society of Urological Pathology (ISUP) grading.
Statistical analysisThe statistical analyses are detailed in the supplemental material. Baseline characteristics were compared using the chi-squared (categorical) or the Kruskal-Wallis (continuous) tests.
Kaplan–Meier survival curves and log-rank tests assessed PCSM across P-score, NCCN, D’Amico, and EAU groups.
The predictive accuracy for PCSM and AP was assessed via ROC curves (AUC with 95% CI).
The predictive ability of each stratification system for both PCSM and development of metastasis over time was evaluated using the concordance index (C-index); a value of 0.5 corresponds to “no better than chance”, a value of 1 corresponds to “perfect prediction”.
The impact of the stratification system on treatment prediction was assessed using treatment intensity scores. For reclassification, initial risk assignments in NCCN, D’Amico, and EAU systems with P-score-based classification and changes in treatment decisions were analysed for patients who would have been reclassified. The probability of treatment changes was estimated using a Monte Carlo simulation (10,000 iterations) model.
Sankey diagrams were generated using the D3 JavaScript package.
All analysis was performed using RStudio version 2024-04-2 + 764. A p-value <0.05 was deemed statistically significant.
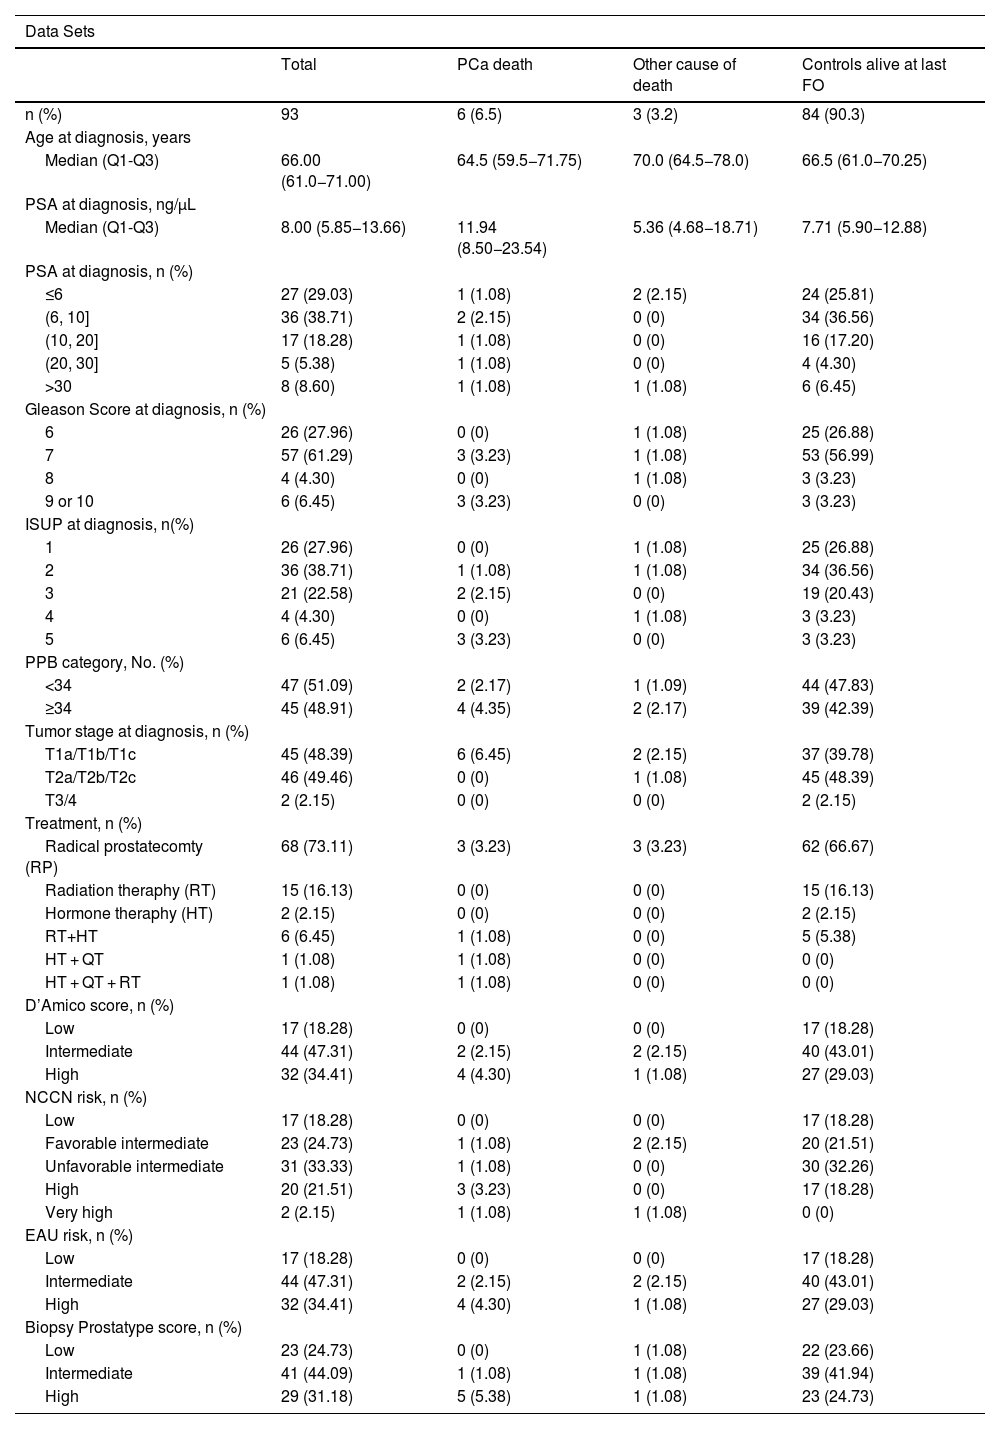
ResultsPatient characteristicsOf 154 initially identified PCa cases eligible for inclusion in the study, 14 cases had no tumour cells in the biopsy, one patient had metastasis at diagnosis, and 46 cases had poor-quality RNA and could not be analysed. Ultimately, 93 cases had valid test results (Table 1). The median age at diagnosis of included patients was 66 years (Q1-Q3: 61.0–71.0) and the median follow-up time was 8.51 years. Twenty-three (24.73%) cases were P-score low-risk, 41 (44.09%) cases P-score intermediate-risk, and 29 (31.18%) P-score high-risk. The P-score ranged between 0 and 10, with a median of 4.0 (Q1-Q3: 3.0–6.0) (Figure S1). The clinicopathological data and the assignment to the D’Amico, NCCN, and EAU risk scoring systems are given in Table 1. Of 93 cases included in the final analysis, six died of PCa.
Clinical characteristics of patients included in the dataset, n = 93.
| Data Sets | ||||
|---|---|---|---|---|
| Total | PCa death | Other cause of death | Controls alive at last FO | |
| n (%) | 93 | 6 (6.5) | 3 (3.2) | 84 (90.3) |
| Age at diagnosis, years | ||||
| Median (Q1-Q3) | 66.00 (61.0−71.00) | 64.5 (59.5−71.75) | 70.0 (64.5−78.0) | 66.5 (61.0−70.25) |
| PSA at diagnosis, ng/µL | ||||
| Median (Q1-Q3) | 8.00 (5.85−13.66) | 11.94 (8.50−23.54) | 5.36 (4.68−18.71) | 7.71 (5.90−12.88) |
| PSA at diagnosis, n (%) | ||||
| ≤6 | 27 (29.03) | 1 (1.08) | 2 (2.15) | 24 (25.81) |
| (6, 10] | 36 (38.71) | 2 (2.15) | 0 (0) | 34 (36.56) |
| (10, 20] | 17 (18.28) | 1 (1.08) | 0 (0) | 16 (17.20) |
| (20, 30] | 5 (5.38) | 1 (1.08) | 0 (0) | 4 (4.30) |
| >30 | 8 (8.60) | 1 (1.08) | 1 (1.08) | 6 (6.45) |
| Gleason Score at diagnosis, n (%) | ||||
| 6 | 26 (27.96) | 0 (0) | 1 (1.08) | 25 (26.88) |
| 7 | 57 (61.29) | 3 (3.23) | 1 (1.08) | 53 (56.99) |
| 8 | 4 (4.30) | 0 (0) | 1 (1.08) | 3 (3.23) |
| 9 or 10 | 6 (6.45) | 3 (3.23) | 0 (0) | 3 (3.23) |
| ISUP at diagnosis, n(%) | ||||
| 1 | 26 (27.96) | 0 (0) | 1 (1.08) | 25 (26.88) |
| 2 | 36 (38.71) | 1 (1.08) | 1 (1.08) | 34 (36.56) |
| 3 | 21 (22.58) | 2 (2.15) | 0 (0) | 19 (20.43) |
| 4 | 4 (4.30) | 0 (0) | 1 (1.08) | 3 (3.23) |
| 5 | 6 (6.45) | 3 (3.23) | 0 (0) | 3 (3.23) |
| PPB category, No. (%) | ||||
| <34 | 47 (51.09) | 2 (2.17) | 1 (1.09) | 44 (47.83) |
| ≥34 | 45 (48.91) | 4 (4.35) | 2 (2.17) | 39 (42.39) |
| Tumor stage at diagnosis, n (%) | ||||
| T1a/T1b/T1c | 45 (48.39) | 6 (6.45) | 2 (2.15) | 37 (39.78) |
| T2a/T2b/T2c | 46 (49.46) | 0 (0) | 1 (1.08) | 45 (48.39) |
| T3/4 | 2 (2.15) | 0 (0) | 0 (0) | 2 (2.15) |
| Treatment, n (%) | ||||
| Radical prostatecomty (RP) | 68 (73.11) | 3 (3.23) | 3 (3.23) | 62 (66.67) |
| Radiation theraphy (RT) | 15 (16.13) | 0 (0) | 0 (0) | 15 (16.13) |
| Hormone theraphy (HT) | 2 (2.15) | 0 (0) | 0 (0) | 2 (2.15) |
| RT+HT | 6 (6.45) | 1 (1.08) | 0 (0) | 5 (5.38) |
| HT + QT | 1 (1.08) | 1 (1.08) | 0 (0) | 0 (0) |
| HT + QT + RT | 1 (1.08) | 1 (1.08) | 0 (0) | 0 (0) |
| D’Amico score, n (%) | ||||
| Low | 17 (18.28) | 0 (0) | 0 (0) | 17 (18.28) |
| Intermediate | 44 (47.31) | 2 (2.15) | 2 (2.15) | 40 (43.01) |
| High | 32 (34.41) | 4 (4.30) | 1 (1.08) | 27 (29.03) |
| NCCN risk, n (%) | ||||
| Low | 17 (18.28) | 0 (0) | 0 (0) | 17 (18.28) |
| Favorable intermediate | 23 (24.73) | 1 (1.08) | 2 (2.15) | 20 (21.51) |
| Unfavorable intermediate | 31 (33.33) | 1 (1.08) | 0 (0) | 30 (32.26) |
| High | 20 (21.51) | 3 (3.23) | 0 (0) | 17 (18.28) |
| Very high | 2 (2.15) | 1 (1.08) | 1 (1.08) | 0 (0) |
| EAU risk, n (%) | ||||
| Low | 17 (18.28) | 0 (0) | 0 (0) | 17 (18.28) |
| Intermediate | 44 (47.31) | 2 (2.15) | 2 (2.15) | 40 (43.01) |
| High | 32 (34.41) | 4 (4.30) | 1 (1.08) | 27 (29.03) |
| Biopsy Prostatype score, n (%) | ||||
| Low | 23 (24.73) | 0 (0) | 1 (1.08) | 22 (23.66) |
| Intermediate | 41 (44.09) | 1 (1.08) | 1 (1.08) | 39 (41.94) |
| High | 29 (31.18) | 5 (5.38) | 1 (1.08) | 23 (24.73) |
Reclassification was based on 57 patients with ≥8 years of follow-up and no metastases at diagnosis. NCCN classified patients into five groups (Fig. 1a). Of nine low-risk patients, five (56%) remained P-score low-risk (one developed metastases), while four (44%) were reclassified as intermediate-risk (two developed metastases). All survived beyond 8 years.
 NCCN, (b) D’Amico, and (c) EAU systems into P-score risk classes, n = 57.")
Among 13 NCCN favourable intermediate-risk patients, six (46%) were reclassified to P-score low-risk, five (38%) to intermediate-risk, and two (16%) to high-risk. One low-risk and one high-risk patient died from non-PCSM causes, while one high-risk patient died from PCa. For 21 NCCN unfavorable intermediate-risk patients, one (5%) was reclassified as low-risk, 13 (62%) as intermediate-risk, and seven (33%) as high-risk. One intermediate-risk patient developed metastases and died from PCa. Of the 12 NCCN high-risk patients, two (17%) were reclassified as intermediate-risk, while 10 (83%) remained high-risk. Four developed metastases, and three died from PCa. No patients were reclassified as NCCN very high-risk.
The D’Amico and EAU classification systems stratified patients into three groups (low-risk, intermediate-risk, high-risk) (Fig. 1b-c). In the low-risk groups, all nine patients survived for at least 8 years. Of these nine patients, four (44%) were reclassified to P-score intermediate-risk, with two developing metastases.
Among 29 D’Amico/EAU intermediate-risk patients, four (14%) shifted to low-risk (one non-PCa death), and nine (31%) to high-risk (two developed metastases).
Of the 19 D’Amico/EAU high-risk patients, three (16%) were reclassified to P-score low-risk, and four (21%) to intermediate-risk. All survived beyond eight years. Of the 12 (63%) patients assigned to the high-risk P-score group, four developed metastases (three of whom died from PCa).
Impact on treatment decisionWe analysed the treatment intensity score to assess the impact of risk classification on treatment decisions. RP and RT were the primary treatments in all classifications, with varied treatment intensities (Table S1). Low-risk patients (score = 2.00) mainly received RP or RT. Intermediate-risk patients (score = 2.02–2.03) underwent slightly more aggressive interventions (e.g., RT + ADT). High-risk patients (score = 2.38–2.41) were more likely to receive multimodal therapy. To assess the impact of reclassification of the NCCN, D’Amico, and EAU systems to P-score on treatment decisions, we performed a Monte Carlo simulation, modelling probability-based treatment adjustments. In this analysis, the use of the P-score led to an estimated treatment escalation probability of 10.06% for NCCN and 9.94% for D’Amico/EAU, while the de-escalation probability of 9.55% for NCCN, 9.49% for D’Amico and 9.48% for EAU system (Figure S2). Patients reclassified from intermediate-risk to high-risk by P-score were more likely to receive intensified treatment, such as the addition of ADT to RT. However, the overall impact on treatment intensity was modest, with RP or RT remaining the primary treatment modalities. Patients downgraded from high-risk to intermediate- or low-risk by P-score had favourable clinical outcomes, with no metastases recorded during follow-up. The findings suggest that using P-score at diagnosis could help prevent overtreatment while maintaining effective disease management.
Prostate cancer-specific mortalityOf the 93 patients included in the dataset, six (6.5%) died from PCa within ten years after diagnosis. One of these patients (1.1%) was stratified into P-score intermediate-risk and the remaining five patients (5.4%) into the high-risk P-score. Three patients (3.2%) in this dataset died of non-PCa causes. All remaining patients (n = 84) remained alive at the last follow-up. Ten patients developed metastases, six of these had been assigned to high-risk P-score, three to intermediate-risk P-score, and one to low-risk P-score. The classification according to NCCN, D’Amico and AEU systems is given in Table 1.
Among all the risk stratification systems included in this study, P-score demonstrated the highest accuracy in predicting PCSM at 10 years, with an AUC of 0.81 (95%CI: 0.61–1.00), while AUC for NCCN was 0.77 (95% CI: 0.56−0.97), and both D'Amico and EAU classifications had an AUC of 0.70 (95% CI: 0.53−0.88) (Fig. 2a). The concordance index (C-index) was 0.75 (95% CI:0.58−0.89) for P-score, 0.69 (95% CI: 0.62−0.93) for NCCN, 0.62 (95% CI: 0.48−0.85) for D’Amico, and 0.62 (95% CI: 0.50−0.86) for EAU (Fig. 2b).
 AUC analysis, (b) C-index analysis, n = 93.")
The Kaplan–Meier (KM) graphs illustrate PCa-specific survival, with death reflecting PCSM. The P-score (Fig. 3) provided the best differentiation between high- and intermediate-risk groups within the first 5 years post-diagnosis. In the P-score classification, two high-risk patients died of PCa during this period, with no deaths in the intermediate- or low-risk groups. According to the NCCN classification (Figure S3), these two patients were classified into the high-risk group and favourable intermediate-risk group, while according to D’Amico (Figure S4 and EAU (Figure S5) systems they were classified into intermediate- and high-risk groups, respectively. Survival differences were not statistically significant, with p = 0.068 for P-score and p ≥ 0.1 for the other systems. However, combining low- and intermediate-risk groups in the P-score yielded a statistically significant p-value of 0.023 (Figure S6).
Metastases
About 10% of newly diagnosed PCa patients have bone metastases, rising to 80% in advanced stages.13 The metastatic spread makes treatment more challenging and affects prognosis. The evaluation of the risk model’s accuracy showed that the P-score had the best predictive accuracy of metastases with a C-index of 0.77 (95% CI: 0.31−0.96), while C-index of 0.58 (95% CI: 0.35−0.81) was the same for NCCN, D’Amico, and EAU systems (Fig. 4).
Percentage of positive biopsy cores (PPB)
The PPB provides information regarding the extent and aggressiveness of the PCa. In line with that, PPB increased as P-score groups moved from low- to high-risk (p = 0.017, Fig. 5a). This suggests that the P-score can predict tumour burden in biopsy cores.
 Percentage of positive biopsy cores (PPB) across P-score groups; (b) comparison of adverse pathology across P-score, NCCN, D’Amico, and EAU systems in AUC analysis; (c) relationship between ISUP grades in biopsy specimens and ISUP grades at RP; (d) relationship between P-score risk groups at biopsy and ISUP grades at RP.")
Analysis of pathological features, n = 68: (a) Percentage of positive biopsy cores (PPB) across P-score groups; (b) comparison of adverse pathology across P-score, NCCN, D’Amico, and EAU systems in AUC analysis; (c) relationship between ISUP grades in biopsy specimens and ISUP grades at RP; (d) relationship between P-score risk groups at biopsy and ISUP grades at RP.
Adverse pathology (defined as GS ≥ 4 or pathological stage ≥ T3 in surgical specimens) and ISUP grading were assessed in patients who underwent RP (n = 66). The predictive performance for AP is depicted in ROC curves (Fig. 5b), showing that the P-score (AUC = 0.74, 95% CI: 0.63−0.84) has a superior ability to predict AP than NCCN (AUC = 0.68, 95% CI: 0.56–0.79) and D’Amico & EAU systems (AUC = 0.58, 95% CI: 0.47−0.69).
The ISUP grading system is a histopathological tool to assess aggressiveness of a tumour. It consists of five grades, with Grade 1 representing the least aggressive cancers and Grade 5 indicating the most aggressive. Fig. 5c illustrates that the ISUP in biopsy specimens discriminates between ISUP grades at RP with p = 0.033, while P-score categorises ISUP at RP with p = 0.0028 (Fig. 5d).
DiscussionThis study aimed to validate the predictive performance of the P-score in a Spanish cohort by measuring the expression of IGFBP3, VGLL3, and F3. Using expression data and clinicopathological information, we calculated P-scores from historical CNB samples (≥10 years old). Of the biopsy tissue collected from 154 patients, 93 were included in the analysis, 46 samples were ineligible due to RNA degradation.
Reclassification analysis, based on patients with at least 8 years of follow-up data, was performed for 57 cases. When reclassifying D’Amico/EAU and NCCN scores to P-scores, 24 cases changed risk category compared to the D’Amico/EAU systems, and 22 cases changed risk category compared to the NCCN system. The majority of reclassifications resulted in an upgrade to a higher risk category. None of the patients reclassified to a lower risk group developed metastases, whereas metastases were observed in some cases reclassified to higher-risk group. Among patients who underwent RP, the P-score showed superior predictive accuracy for the development of metastases compared to the NCCN, D’Amico, and EAU classifications, suggesting that the use of the P-score is of value for identifying patients with a high-risk of PCa progression.
RP and RT remained the primary treatments, P-score identified ∼10% of patients for treatment escalation, aligning with poorer survival outcomes, and ∼9.5% for de-scalation, with no metastases. Consistent with other studies reporting a median survival over 10 years for PCa patients,1,14 the number of PCa-related deaths in the current study was low (n = 6). Nevertheless, we were able to assess the accuracy of PCSM prediction. Both AUC and C-index analyses demonstrated that the P-score provided greater accuracy in predicting 10-year PCSM compared to other scoring systems included in this study. Kaplan–Meier plots for PCa-specific survival also illustrated enhanced accuracy of the P-score, particularly during the first 5 years of follow-up. Altogether, these results indicate that the P-score is a more reliable tool to predict PCa-specific outcomes than NCCN, D’Amico or EAU systems.
The P-score demonstrated strong predictive power for assessing tumour burden in biopsy samples, which is essential for identifying patients who may benefit from aggressive treatments or closer monitoring. By improving predictive accuracy, the P-score enables a more personalised approach to treatment. Additionally, while both P-score and ISUP biopsy grading correlated significantly with ISUP grade at RP, the P-score showed a notably stronger association, indicated by a lower p-value. Validation in a larger cohort could further support its utility in identifying patients at higher risk of progressing to aggressive cancer phenotypes before surgery.
A key limitation is the modest sample size (n = 93), with exclusions due to insufficient tissue (9.2%) or poor RNA quality (33.1%). These factors may introduce bias, though variability in sample quality is common in retrospective studies.15 Additionally, although drawn from multiple Spanish hospitals, the patient cohort used in this study may not fully represent the diversity of the broader Spanish PCa population or account for variations in clinical practices. Future studies with larger, more diverse cohorts are essential to confirm the P-score’s predictive accuracy and enhance its applicability across different clinical settings.
This study confirms P-score’s superior accuracy for predicting PCSM and metastases in a Spanish cohort. By integrating genetic and clinical data, P-score aids personalized treatment decisions, distinguishing high-risk patients from AS candidates.
FundingWe acknowledge Prostatpe Genomics AB for providing the kits to perform this study.
EB is employed by Prostatype Genomics AB. The authors report no other conflicts of interest in this work.
The contributions of the Data Scientist Vladimir Bykov (independent consultant) and the Medical Writer Agata Wasik (LINK Medical AB, Sweden) are highly appreciated.
The following are Supplementary data to this article:
