

Mexico is consistently portrayed as a happy country. Research endeavors, both national and international, show that Mexico's levels of happiness are favorable, although little has been done regarding specific measurement underpinnings. There is a constant debate on whether happiness should be measured in terms of frequency or intensity of positive affect over negative affect (Diener, Sandvik, & Pavot, 2009), although some consensus points toward frequency's superiority over intensity of emotions. Some authors insist that frequency can me more easily and accurately measured than intensity, allowing for cross-person metric comparisons. This research put to test the frequency-intensity debate by providing several conceptual frameworsk that accentuated one over the other, allowing people to decide how they defined their own happiness. Two independent samples (n1=158, n2=583) of Mexican men and women provided insights on whether happiness in Mexico is defined in terms of frequency or intensity. Once it was defined, happiness levels were compared between two groups showing that those who define happiness as “frequency” present higher levels of joy. This research supports the premise that happiness could be defined as the sum of frequent events, congruent with bottom-up approaches to happiness and wellbeing.
México es consistentemente definido como un país feliz. Algunas investigaciones, tanto nacionales como internacionales, muestran que los niveles de felicidad de México son favorables, aunque poco se ha hecho respecto a algunos aspectos clave sobre la medición de la felicidad. Existe un constante debate sobre si la felicidad debe ser medida en términos de intensidad o de frecuencia de afecto positivo sobre afecto negativo (Diener, Sandvik y Pavot, 2009), aunque existe cierto acuerdo en torno a la superioridad de la frecuencia sobre la intensidad. Algunos insisten en que la frecuencia puede ser medida de manera fácil y precisa, permitiendo una métrica comparable entre individuos. Esta investigación tuvo como propósito poner a prueba el debate de frecuencia-intensidad al proveer diferentes esquemas en torno a la felicidad, permitiendo que la gente eligiera cómo se define esta. Dos muestras independientes (n1=158, n2=583) de hombres y mujeres mexicanos proveen información útil sobre cómo se define en México la felicidad. Una vez definida, se compararon los niveles de felicidad de 2 grupos, obteniendo resultados que apuntan a mayores niveles de felicidad en aquellos que la definen en términos de «frecuencia». Estos hallazgos apoyan la premisa de que la felicidad puede ser entendida como la suma de componentes básicos que ocurren con relativa frecuencia, congruente con las posturas teóricas de «abajo-arriba» (sumativas) en torno al estudio del bienestar y la felicidad.
The study of wellbeing started with researchers trying to assess happiness, which was considered for some as the goal of human life. Wilson's (1967) and Diener, Suh, Lucas, and Smith's (1999) reviews have been consistently used as conceptual and empirical frameworks toward research in the field. Wilson's (1967) conclusions about who the person who is universally happy stated that the happy person is a “young, healthy, well-educated, well-paid, extroverted, optimistic, worry-free, religious, married person with high self-esteem, job morale, modest aspirations, of either sex and of a wide range of intelligence” (p. 294). Since then, extensive research has been made in the field (see Diener, 2009a, 2009b, 2009c, 2009d) toward defining a happy person.
Social behavioral sciences consider the study of Subjective Well Being (SWB) the field in which people's evaluations of their lives are studied. It includes many of dimensions and assessments ranging from quick-momentary moods, feelings, and cognitive frameworks to global judgements of life satisfaction and overall feelings toward life (Diener, 2009a). Diener (2005) defines SWB as the various types of evaluations that people make of their own lives. These evaluations may be either positive or negative and include both cognitive evaluations of satisfaction toward life, and affective reactions to life events, such as feeling happy or sad.
In Mexico, some of the most recent endeavors concerning the scientific study of SWB and happiness (Arita, 2005a, 2005b, 2005c; INEGI, 2015; Palomar, 2000, 2004, 2005; Velasco, 2015) have directed their efforts into trying to explain how the access to public services (water, electricity, gas, paved roads), sociodemographic data (age, sex, income), and personality traits determine self-reported levels of happiness/wellbeing. One of these efforts (INEGI, 2012, 2015), labeled as BIARE (Bienestar Auto-Reportado in Spanish, Self-Reported Wellbeing in English) was intended to obtain enough information in order to generate data equivalent to that of the OECD (Organization for Economic Co-operation and Development). The assessment involved a series of questions such as “On a scale of 0 to 10, how satisfied are you with your life?” (10 being the most satisfied), “How happy did you feel yesterday?”, “How happy would you consider yourself?” among others. With more than ten thousand participants, results showed the following: 36.5% of the Mexican population is moderately satisfied with life (ranging from 7 to 8 in the 0–10 continuum), 47.1% is satisfied (9–10 interval), 33.4% is moderately happy (7–8 interval), and 55.7% is happy (9–10). These findings seem to be consistent for Mexican population across time (Gómez, 2012; Velasco, 2015).
According to Diener et al. (2009), when people seek happiness, some desire to be happy most of the time, even if only mildly so. Arguably, some people may think that happiness and wellbeing are addressed when frequent positive affect and intense positive affect are both fulfilled, with minimal amounts of non-intense, non-frequent negative affect. However, many people would suggest that either frequent (mild) or intense (but frequent) experiences of positive affect are necessary of sufficient to produce a happy life.
Diener, Sandvik, & Pavot (2009) and Diener, Sandvik, and Pavot (1991) suggest that happiness refers to the frequency and not the intensity of positive affect (feeling good) over negative affect (feeling bad). According to these authors, frequency of emotions is more easily and accurately measured than intensity since information concerning frequency can be encoded in memory and can therefore be more accurately recalled. Also, frequency can be more easily comparable across persons, whereas intensity of emotions is usually too subjective, making it harder to compare among individuals. Even more, Diener and Iran-Nejad (1986) argued that the judgment of happiness versus unhappiness is easier in terms of frequency since people tend to understand, live and experience both of them in terms of dominance: when one of them is dominant, the other one exists, if at all, al low levels.
Emotional intensity is likely to be more difficult to encode because of its nature. The calibration of emotional experiences becomes more challenging as emotions become more intense. Frequency information can be measured since people do know when they are happy of unhappy, when they feel good or not, whereas information regarding intensity has no discrete event. Therefore, clearly distinguishable levels of emotional intensity become a constant challenge and cannot be easily addressed. Self-reports of frequency can me more comparable across persons because frequency of emotions seems to have a more universal meaning (Diener et al., 1991, 2009). People know the difference between experiencing or not a certain event, however the internal experience of emotional intensity, making it very problematic to reach a cross-person metric.
International and national research seem to be consistent in their findings concerning Mexico: it is a happy country. The World Happiness Report (Helliwell, Layard, & Sachs, 2016) is an update to the 2013 and 2015 reports as an effort to portray the scientific underpinnings of measuring and understanding happiness and wellbeing worldwide. Mexico's BIARE (INEGI, 2015) is an extension to 2012s (INEGI, 2012) effort to portray Mexican happiness throughout the nation. BIARE's scores locate both happiness (M=8.37) and satisfaction (M=8.04) means around 8 on a 1–10 continuum, whereas according to WHR's data Mexico's mean is 6.77, also on a 1–10 continuum.
Cross-cultural research tries to address issues with an interest in cultural variations on specific variables or instruments (Van de Vijver & Leung, 2000), which leads us to re-visit the premise of frequency over intensity proposed by Diener et al. (2009), since Mexico's understanding of “happiness” could be behaving different. Bear in mind that most of the instruments used in Mexico are adaptations or validations from other cultural contexts (as reviewed by Anguas, 2000, 2005 and Velasco, 2015), so although there is extensive research on the field and there are good theoretical and empirical reasons to use frequency and/or intensity of emotions to assess happiness and wellbeing, the better understanding of how Mexicans experience happiness and wellbeing could lead to a uniform and adequate metric that could facilitate comparisons across people and across contexts.
In order to test Diener et al.’s (2009) premise of frequency over intensity in a Mexican sample, we developed this research with two main purposes: (1) Assess whether Mexican happiness is defined in terms of frequency or intensity, and (2) Evaluate happiness levels in a Mexican sample.
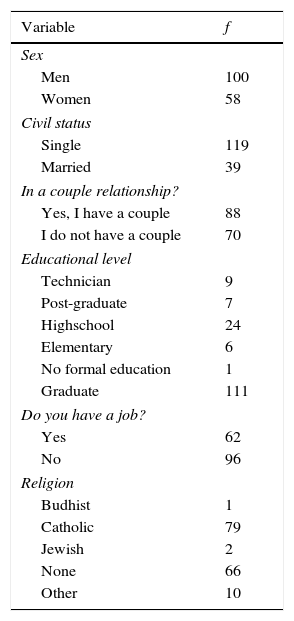
Study 1MethodSampleA total convenience sample of 58 men and 100 women, all Mexican, with a mean age of 26.91 years (SD=11.40, ages ranging from 17 to 57), 55.7% of them in a couple relationship, 50% of them Catholic, and 39% of them with a job, was used for this study. All participants agreed to participate on a voluntary basis and no monetary compensation was given to any of them. Other sociodemographic data can be found in Table 1.
Sociodemographic data for Mexican men and women.
| Variable | f |
|---|---|
| Sex | |
| Men | 100 |
| Women | 58 |
| Civil status | |
| Single | 119 |
| Married | 39 |
| In a couple relationship? | |
| Yes, I have a couple | 88 |
| I do not have a couple | 70 |
| Educational level | |
| Technician | 9 |
| Post-graduate | 7 |
| Highschool | 24 |
| Elementary | 6 |
| No formal education | 1 |
| Graduate | 111 |
| Do you have a job? | |
| Yes | 62 |
| No | 96 |
| Religion | |
| Budhist | 1 |
| Catholic | 79 |
| Jewish | 2 |
| None | 66 |
| Other | 10 |
One question (“How do you define your happiness?”) was developed for this study, with four possible answers. The answers were written from the combination of frequency and intensity as bipolar axis (frequent/infrequent, intense/not intense), creating four possible scenarios, as follows:
- •
Not intense, and not frequent events/moments of happiness
- •
Not intense, but frequent events/moments of happiness
- •
Intense, but infrequent events/moments of happiness
- •
Intense, and frequent events/moments of happiness
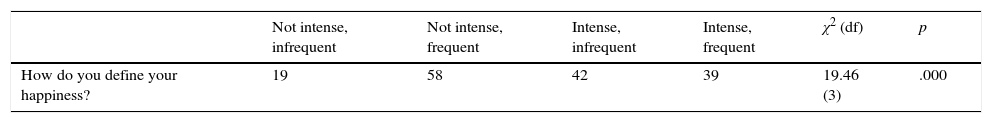
A Chi-square test compared which two of the four possible answers were the most frequent. Table 2 shows statistically significant differences between all four possible answers, being the combination of no intensity–frequency, and intensity–infrequency the two highest ones. These two answers were then considered for Study 2.
Chi-square comparisons between four types of happiness.
| Not intense, infrequent | Not intense, frequent | Intense, infrequent | Intense, frequent | χ2 (df) | p | |
|---|---|---|---|---|---|---|
| How do you define your happiness? | 19 | 58 | 42 | 39 | 19.46 (3) | .000 |
Note: The four answer options have been re-written for display purposes on this table. The exact content is described in the “instrument” section of this paper.
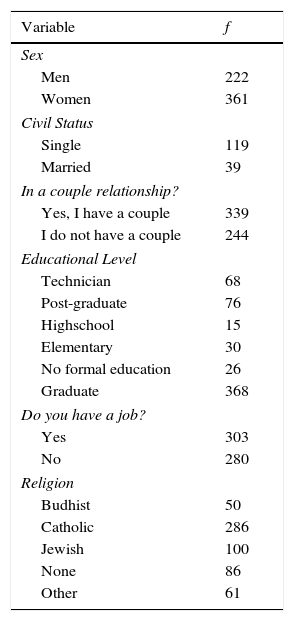
A new convenience sample of 222 men and 361 women, all Mexican, with a mean age of 28.71 years (SD=10.33, ages ranging from 18 to 69), 58% of them in a couple relationship of at least 6 months, 49% of them Catholic, and 52% of them with a job, was used for this study. All participants agreed to participate on a voluntary basis and no monetary compensation was given to any of them. Other sociodemographic data is shown in Table 3.
Sociodemographic data for Mexican men and women.
| Variable | f |
|---|---|
| Sex | |
| Men | 222 |
| Women | 361 |
| Civil Status | |
| Single | 119 |
| Married | 39 |
| In a couple relationship? | |
| Yes, I have a couple | 339 |
| I do not have a couple | 244 |
| Educational Level | |
| Technician | 68 |
| Post-graduate | 76 |
| Highschool | 15 |
| Elementary | 30 |
| No formal education | 26 |
| Graduate | 368 |
| Do you have a job? | |
| Yes | 303 |
| No | 280 |
| Religion | |
| Budhist | 50 |
| Catholic | 286 |
| Jewish | 100 |
| None | 86 |
| Other | 61 |
The same question of Study 1 (“How do you define your happiness?”) was used for this study but only two possible answers were considered. The two considered answers were the two most frequent from the previous study, and read as follows:
- •
Not intense, but frequent events/moments of happiness
- •
Intense, but infrequent events/moments of happiness
Additionally, one question was administered to assess levels of happiness with a 1–10 response style (being 1 the lowest and 10 the highest level), and read: Based on how you just defined happiness, how happy are you on a 1 to 10 scale?
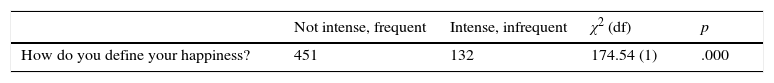
ResultsA Chi-square test compared which of the two possible answers was the most frequent. Table 4 shows statistically significant differences between the two possible answers, being happiness in terms of low intensity and high on frequency the most frequent choice.
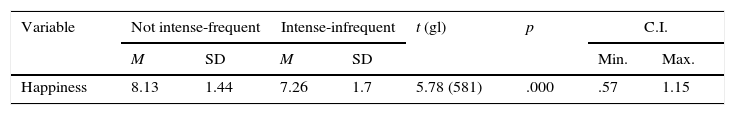
Additionally, an independent samples t-test was performed to compare levels of happiness comparing those who consider happiness in terms of frequency versus those who consider it in terms of intensity. Table 5 shows statistically significant differences, indicating that happiness is higher on the frequency group (M=8.13, SD=1.44) when compared to the intensity group (M=7.26, SD=1.70).
DiscussionOne of the key issues when evaluating affective components of wellbeing (referred by some as “happiness”; Veenhoven, 1994, 1996, 2005), is the emotional experience that should be measured. Research (Diener, 2009a; Diener, Scollon, & Lucas, 2003) shows that the intensity with which an individual experiences emotion is not the same as the frequency with which those same emotions are lived. Frequency seems to be the go-to approach when considering evaluations across time since researchers can assess it by summing the number of times a person reports experiencing any emotion. On the other hand, intensity is usually determined by examining the mean intensity of the emotion when a person reports feeling it.
Our findings suggest that people's meaning and experience of “happiness” is directly associated to frequency of life events. Both Study 1 and 2 show that happiness defined in terms of frequency over intensity were the most frequent options, even when considering all possible combinations. This leads us to believe that happiness is defined this way in a relatively stable fashion. Just as Diener (2005) proposed, people evaluate their lives in several ways, and in this case it seems to be that happiness is being evaluated in terms of frequency over intensity of positive emotions. Just as Velasco (2015) and Veenhoven (2005) suggested, the presence of positive emotions seems to be enough and sufficient to produce a positive experience.
The fact that happiness is understood as the frequency of favorable, positive, pleasurable moments and life events is totally consistent with previous literature. As Diener et al. (2009) and Diener, Larsen, Levine, and Emmons (1985) suggested, frequency could be functioning as an optimal metric when evaluating life. Bearing in mind that according to Diener (2005) wellbeing is the overall evaluation of one's life, Veenhoven (2005) proposed various types of happiness. These types of happiness are defined as momentary or stable across time, and determine if a life event can produce true happiness or if it is just a mere quick, ephemeral sensation. Since our sample seems to be (mostly) understanding happiness in terms of frequency over intensity, the decision of whether an individual is happy or not is in fact possible, allowing people to make a decision with solid grounds, congruent with Veenhoven's categorization.
The preference of frequency over intensity is also congruent with one of the major theoretical approaches to wellbeing and happiness: bottom-up theories. Bottom-up theories suggest that the evaluation of whether a person is or is not happy depends on a mental calculation of the sum of pleasures and pains. Hence, a happy life is an accumulation of happy moments (Diener, 2009a, 2009b, 2009c, 2009d; Kozma & Stones, 1980). One of the greatest advantages of this view (Velasco, 2015) is that its basic premise allows to consider the frequency of almost any category as precursor of happiness. As long as it happens, and as long as it happens consistently throughout life, family members, material possessions, money, prizes, good news, jobs, friends, or any other domain, could be used to effectively measure happiness.
Mean comparisons showed statistical differences that favored the group that defined happiness in terms of frequency. As it was just mentioned, this could be partly due to the fact that many life events occur more than once in a lifetime without even considering if it is an intense event (either positive or negative). The overall higher scores on this group could be showcasing the accumulation of little moments of happiness that make up a larger, bigger happiness. This research did not consider asking what makes up happiness, and therefore we are currently unaware of the key components of such phenomenon. Data undeniably shows that Mexico is considered a happy country; however, the composition of this concept is still under examination. Results reported by the WHR (Helliwell et al., 2016) and BIARE (INEGI, 2015) suggest that happiness is made up of several domains, such as income, sex, demographic characteristics, education, public services, family, friends, personality, etc. Further research is needed in order to evaluate which of these components is more determining when trying to establish if our lives are happy or not.
Kahneman (1999) argued that frequency based measures appear to have better psychometric characteristics. Reports base on this type of items are likely to valid and have similar meaning across respondents, making results more comparable. If research intends to be comparable across different contexts, several issues, including construct equivalence (Dudley, McFarland, Goodman, Hunt, & Sydell, 2005; Van de Vijver & Leung, 2000) should eventually be addressed. Frequency seems to be one approximation toward obtaining a useful metric, although alternative approaches should be tested.
Finally, the arguments presented here have important future directions. It seems only logical that people that can attain frequent positive events will become happy. Therefore, interventions should aim at increasing the frequency and duration of happy experiences, just as Positive Psychology (Seligman & Csikszentmihalyi, 2000) suggests.
FundingNo financial support was provided.
Conflict of interestThe authors have no conflicts of interest to declare.
Peer Review under the responsibility of Universidad Nacional Autónoma de México.