


This study is aimed to model and forecast the tourism demand for Mozambique for the period from January 2004 to December 2013 using artificial neural networks models. The number of overnight stays in Hotels was used as representative of the tourism demand. A set of independent variables were experimented in the input of the model, namely: Consumer Price Index, Gross Domestic Product and Exchange Rates, of the outbound tourism markets, South Africa, United State of America, Mozambique, Portugal and the United Kingdom. The best model achieved has 6.5% for Mean Absolute Percentage Error and 0.696 for Pearson correlation coefficient. A model like this with high accuracy of forecast is important for the economic agents to know the future growth of this activity sector, as it is important for stakeholders to provide products, services and infrastructures and for the hotels establishments to adequate its level of capacity to the tourism demand.
In many countries, whether developed or developing, tourism, due to its transversality, has gained more and more space in the economic outlook, boosting the development of other interrelated sectors such as agriculture, crafts, food, drinks, transportation, etc. (SPDTM, 2004). For Mozambique, the tourism sector is the major ally on the fight over poverty, through the enhancement of natural resources and the historical and cultural heritage areas that are contributing to the promotion of investment and employment as well as the generation of foreign exchange earnings (SPDTM, 2004).
Actually, the tourism industry has less contribution in the gross domestic product and employment market in Mozambique than in the world. According to WTTC (2014), the direct contribution to Gross Domestic Product (GDP) it estimated in 2.9% for 2014 and the contribution to employment market is 2.2%, in Mozambique. When compared with the tourism contribution in GDP of the world 3.1%, and in the employment 9.8% (WTTC, 2014).
Mozambique needs to make its tourist potentialities to be known in order to be competitive in the regional market (Southern region of Africa), just like South Africa that has (3% to GDP and, 5% to Employment) and Tanzania with (5.1% to GDP and; 4.3% to Employment).
So several actions have to be taken by private and public (actors/players) institutions to improve the situation. The starting point begins with the strategic plan, i.e., where the accuracy of forecasting plays a crucial factor in the knowledge of the future.
According to the tourism studies, it is estimated that in 2025 there will be over 4 million tourists in Mozambique (SPDTM, 2004). It is expected that the rate of growth between 2004 and 2025 goes around 6, 1%, and we expect that this number of entries has considerable effects on the number of overnight stays, because the number of tourism internationally have greater impact on the number of overnight stays compared to domestic tourism.
So, concerned with that, this study has the aim to develop a model as well as forecasting the overnights number for the period of 2004–2013 on a monthly basis from a set of variables presumed to influence the number of overnight stays by 5 major tourist issuing countries for Mozambique, namely: Mozambique itself, South Africa, United States of America, Portugal and the United Kingdom. The selected variables are Harmonized Index of Consumer Prices, Gross Domestic Product per capita and Exchange Rate.
Therefore, the aim of this work is the modelling and forecasting tourism demand represented by total overnights for Mozambique, for the period, since January 2004 until December 2013 using artificial neural networks methodology. Additionally, in the study for accuracy was used Mean Absolute Percentage Error (MAPE) and Pearson correlation coefficient (r).
In order to achieve the objective of this study, the paper is organized in this structure: Section 1 presents the literature review; Section 2 presents the methodological approach; Section 3 presents the empirical results and analysis, while the final section summarizes the main conclusions.
2Literature reviewDue to the perishable nature of the tourism industry, the need to devise accurate forecasts has become crucial (e.g., Gunter & Önder, 2015; Law, 2000; Law & Au, 1999; Witt & Witt, 1995). Most studies about modelling and forecasting have been published in the recent years (e.g., Athanasopoulos & Hyndman, 2008; Dwyer, Forsyth, & Dwyer, 2010; Fernandes, Monte, & Teixeira, 2009; Fernandes, 2005; Li, Song, & Witt, 2005; Peng, Song, Crouch, & Witt, 2014; Rigall-I-Torrent & Fluvia, 2007, 2011; Santos & Fernandes, 2011; Song & Li, 2008; Song & Witt, 2012; Song, Witt, & Li, 2003; Tribe & Xiao, 2011). Some of these studies used neural networks for modelling and forecasting tourism demand (e.g., Claveria & Torra, 2014; Fernandes & Teixeira, 2008; Fernandes, Teixeira, Ferreira, & Azevedo, 2008; Law, 2000; Law & Au, 1999; Teixeira & Fernandes, 2014). For example, Law and Au (1999) used a supervised feed-forward neural network model to forecast Japanese tourist arrivals in Hong Kong. Law and Au used Service Price, Average Hotel Rate, Foreign Exchange Rate, Population, Marketing Expenses, and Gross Domestic Expenditure as explanatory variable and estimated Japanese arrivals from Hong Kong was applied as dependent variable. Law and Au (1999) conclude that using the neural network model to forecast Japanese arrivals outperforms multiple regressions, naıve, moving average, and exponent smoothing. Law (2000) applied Back propagation learning in improving the accuracy of neural network-based tourism demand forecasting and the empirical results indicate that using a back propagation algorithm to train neural network outperforms regression models and time-series models in terms of forecasting accuracy. Fernandes et al. (2008) applied artificial neural networks as alternative to ARIMA model to forecast ‘nights spent in the hotel accommodation’ recorded in the period from January 1987 until December 2006. Fernandes and Teixeira (2008) applied a neural networks to model and forecast tourism demand, represented by number of overnight stays in north of Portugal since January 1987 to December 2006. Claveria and Torra (2014) applied neural networks to forecasting tourism demand in Catalonia (Spain). Teixeira and Fernandes (2014) applied artificial neural networks to forecast time series namely: tourism revenue and overnights registered in the hotels of north of Portugal for the period between January 2006 and December 2011.
Most of the studies about modelling and forecasting used tourist arrivals as variable representative of the tourist demand (e.g., Gunter & Önder, 2015; Law, 2000). According to them, the second most used variable was the variable income or tourist spending. Another variable no less used to model the tourist demand is the number of overnight stays registered/recorded in hotels and similar guest houses. According to Cunha and Abrantes (2013), the use of variable number of overnight stays is relevant when you want to capture the movement of foreign and domestic tourists simultaneously.
The variable number of overnight stays has been used in several studies related to modelling and forecasting of tourism demand using artificial neural networks (Fernandes et al., 2008; Teixeira & Fernandes, 2014). This study for modelling and forecasting used the number of overnight stays as it is intended to make a combination between national and international tourism.
3Methodology of neural networksThis article aims to model and predict the tourist demand in Mozambique through the artificial neural network model for the period from January 2004 to December 2013. The variable number of overnight stays was used as the dependent variable in the model and will be explained by a set of variables, including: Harmonized Index of Consumer Prices (CPI), Gross Domestic Product per capita (GDP), and Exchange Rate (ER). The explanatory variables were selected for the five largest tourist issuers presumed to have positively influence the number of overnight stays, including: United States of America, United Kingdom, South Africa, Portugal and Mozambique.
The data used in the model construction were obtained from the following places.
- -
For the data for South Africa has acceded to the Institute Statistics South Africa (SSA, 2014);
- -
For Mozambique data were collected from the National Statistics Institute of Mozambique (INE, 2014);
- -
The data for Portugal were collected from Eurostat (2014);
- -
The data from the United Kingdom were collected in the Office for National Statistics (ONS, 2014);
- -
For the data for the United States of America (USA) has referred to the Federal Reserve Bank, FRB (2014);
- -
Data on the exchange rate of the top five outbound tourism markets (South Africa, USA, Mozambique, Portugal and the United Kingdom) were collected from the OANDA (2014).
In this study, all monetary values are expressed in meticais (MT) currency of Mozambique.
3.1Artificial neural networksThe artificial neural networks (ANN) method was first introduced to tourism demand forecasting in the late 1990s (Chen, Lai, & Yeh, 2012). According to Zhang (2003), recent research activities in forecasting with ANN suggest that methodology can be a promising alternative to the traditional linear methods (e.g., multiple regression model, ARIMA). The ANN are relatively new computational tools that have found extensive use in solving many complex real-world problems (Basheer & Hajmeer, 2000) and can be defined as information processing systems whose structure and functioning are inspired by biological neural networks (Palmer, Montaño, & Sesé, 2006).
In recent years, the study of ANN has aroused great interest in fields just like biology, psychology, medicine, economics, mathematics, statistics and computers (e.g., Khashei, Hamadani, & Bijari, 2012; Palmer et al., 2006). The attractiveness of ANNs comes from their remarkable information processing characteristics pertinent mainly to nonlinearity, high parallelism, fault and noise tolerance, and learning and generalization capabilities (e.g., Basheer & Hajmeer, 2000; Palmer et al., 2006).
In the perspective of Law and Au (1999), the architecture of the neural feed forward network is composed of three distinct layers, namely an input layer, one or more hidden layers (hidden) and an output layer; each of these layers contains nodes, and they are connected to nodes on the adjacent layer. For them, each node of a neural network is a processing unit that contains a weight and a sum function. A weight (w) returns a mathematical value for the relative strength of connections to transfer data from one layer to another layer, whereas a sum function (y) computes the weighted sum of the input elements entering a processing unit. The nodes in the input layer represent independent problem variables, the hidden layer is used to add an internal representation of handling non-linear data and the output of a neural network is the solution to a problem (Law & Au, 1999).
The relationship between the output (Y) and the inputs (X1, X2, …, Xp) has the following mathematical representation (Khashei, Hejazi, & Bijari, 2008; Teixeira & Fernandes, 2010; Zhang & Qi, 2005).
where Yk (k=1, 2, 3, ..., p) represent the output variable; Wji (i=0, 1, 2, 3, ...., m; j=1, 2, 3, ..., n) and wj (j=1,2,3,...,n) are model parameters often called connection weights; m represent the number of input nodes; and n represent the number of hidden nodes. Data enters the network through the input layer, moves through hidden layer, and exits through the output layer. Where: Yk (k=1, 2, 3, ..., p) represents the output variable; m corresponds to the number of nodes in the input layer (number of input variables); n, is the number of nodes in the hidden layer; f corresponds to sigmoidal activation function (equation also indicates the use of a linear activation function in the output layer); wj (j=1,2,3,...,n) corresponds to the weight vector connecting the nodes of the hidden layer to the output layer; Wji (i=0, 1, 2, 3, ...., m; j=1, 2, 3, ..., n) corresponds to weights which relate the nodes in the input layer to the hidden layer and are model parameters designated connection weights. The b0 e B0j and indicate the deviations of the independent terms (bias) associated with each output layer node and hidden layer node, respectively (Fig. 1).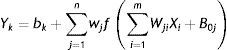

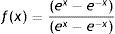
In the construction of artificial neural networks models, activation function most commonly used in the hidden layer is Sigmoidal Logarithmic Function (Haykin, 1999; Zhang, Patuwo, & Hu, 1998). The logarithmic sigmoidal activation function is given by Eq. (2) and in Fig. 2a. The logarithmic sigmoidal activation function extends from 0 to +1 (Haykin, 1999). This function is used to transform output so that it falls within an acceptable zone and is defined as a strictly increasing function which exhibits an appropriate balance between linear and non-linear behaviour (Fernandes, 2005; Haykin, 1999). For Law (2000), the transformation is done before the output reaches the next level and the purpose of this function is to prevent the output value is too large, as the value must be between 0 and +1.

.")
Activation function chart. Source: Adapted from Beale et al. (1992, p. 6).
Another function, not least, that is used in the hidden layer is the hyperbolic tangent function or tangent Sigmoidal, defined by Eq. (3) and Fig. 2b, when you want the activation function takes negative values, i.e., a form anti symmetrical regarding the origin (Haykin, 1999).
In the output layer, the most used function is the linear function given by Eq. (4) and Fig. 2c.

Fig. 2 illustrates the sigmoidal activation logarithmic functions, tangent sigmoidal and linear functions (Beale, Hagan, & Demuth, 1992).
The most important feature of an artificial neural network is its ability to learn from their environment and improve their performance through learning (Haykin, 1999). For Sivanandam and Paulraj (2003) learning is a process in which the network adjusts its parameters (synaptic weights) in response to input stimulus so that the actual output response converges to the desired output response. Supervised or teacher learning is by far the most used technique in the field of artificial neural networks. In this type of learning, the main condition is the existence of a teacher able to provide accurate fixes for the network outputs when an error occurs, or lay down a relationship to the environment of the input units and free network output (Haykin, 1999).
A supervised feed forward neural network learns from training data to uncover patterns that represent input and output variables. Typically, the learning process involves the following steps (Law & Au, 1999):
- •
Random numbers to assign the weights;
- •
For each element in the training set (a set of observations of the sample used to develop the pattern or relationship between observations) adjust the weights W and w in the error back propagation process (back propagation algorithm);
- •
To compare computed output with observed values. The process is stopped when the error between the output and the target is below a present value, or if during a predetermined number of iterations the error in another validation set is not lower. This latter process is called by cross-validation and prevents the model to over-fit the training set data, ensuring the neural network's ability to generalize.
There are several steps to measure the accuracy of the forecast. For the present work, in view of measurement accuracy of the multiple linear regression models and the model of artificial neural networks will appeal to the precision model suggested by Burger, Dohnal, Kathrada, & Law (2001), namely mean absolute percentage error (MAPE) and the Pearson correlation coefficient (r). The Eq. (5) gives the MAPE and the Eq. (6) gives the Pearson correlation coefficient (r).

In Eq. (5), n represents the number of observations used in the study, in this study there are 120 observations; Y−Yˆ designates his forecast error; Yi represents the actual current value of the variable, which in this work is the tourism demand for Mozambique and Yˆi represents the value of tourism demand to Mozambique planned for the same period. For evaluation, we follow the criteria proposed by Lewis (1982).
where r is the Pearson correlation coefficient; Yi and Yˆi parameters and represent, respectively, the real value and the expected value of the number of nights spent in Mozambique.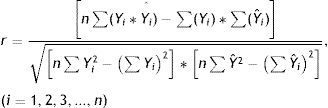
The Pearson correlation coefficient (r) measures the degree of linear association between two numerical variables (Levine, Berenson, & Krehbiel, 2006).
4Empirical results4.1Presentation and analysis of variable behaviourAt this stage of the work, the variables that will form the basis for construction of the models and will study their behaviour for the reporting period (January 2004 to December 2013), will be presented. First, the dependent variable of the model, i.e., the ‘Number of overnight stays in hotels and similar places’, as representative of the tourist demand in Mozambique, will be presented or explained. Second, the independent or explanatory variables in the model, namely the Harmonized Index of Consumer Prices (CPI), Gross Domestic Product per capita (GDP), and Exchange Rate (ER), will be presented. It was decided to consider the dollar of the United States of America designating ER_DOLLAR-MT; for the Euro in Portugal to ER_EURO-MT designation; for Rand of South Africa ER_RAND-MT designation; and the United Kingdom Great British Pound the ER_GBP-MT designation.
These variables, presented in Table 1, were selected from the main five outbound tourism markets of Mozambique presumed to influence the number of overnight stays in hotels and similar service providers in Mozambique (dependent variable), namely: South Africa (SA); United States of America (USA); Portugal (PT); Mozambique (MOZ); and United Kingdom (UK).
List of variables and its acronyms.
| Variable acronym | Variable description |
|---|---|
| Number of overnights stays | Number of overnights stays in Hotels of Mozambique |
| ER_DOLLAR-MT | Exchange Rate dollar-metical |
| ER_GBP-MT | Exchange Rate Pound-metical |
| ER_RAND-MT | Exchange Rate rand-metical |
| ER_EURO-MT | Exchange Rate euro-metical |
| GDP_USA | Gross Domestic Product per capita of EUA |
| GDP_UK | Gross Domestic Product per capita of United Kingdom |
| GDP_PT | Gross Domestic Product per capita of Portugal |
| GDP_SA | Gross Domestic Product per capita of South Africa |
| GDP_MOZ | Gross Domestic Product per capita of Mozambique |
| CPI_USA | Harmonized Index of Consumer Prices of EUA |
| CPI_UK | Harmonized Index of Consumer Prices of United Kingdom |
| CPI_PT | Harmonized Index of Consumer Prices of Portugal |
| CPI_SA | Harmonized Index of Consumer Prices of South Africa |
| CPI_MOZ | Harmonized Index of Consumer Prices of Mozambique |
Now making a descriptive and graphical analysis of the variable ‘Number of overnight stays in hotels and similar places’ (Fig. 3) we can observe the evolution from the period of January 2004 to December 2013. In the case of Mozambique, this variable does not have a tendency for typical seasonality and constant over the years, but it is possible to consider three different situations for the months of January, April and December.

That is, January is the month in which fewer tourists are received and this is due to the reason that tourists are doing a reverse movement by returning to their homelands.
For the month of April, there is need to consider that the series recorded an increase and this is because it is a month that we celebrate the Christian Easter, with a grace period in neighbouring countries, which to some extent gives a tourist flow the relevant entry to Mozambique and consequently greater demand for tourist resorts.
Lastly, December is the month with more tourists, this is due to the following reasons: this is the month of the festive season and the period of holidays in labour institutions and schools, therefore it motivates many tourists move, if either of domestic tourists or foreign tourists, with main emphasis on the South African tourists who represents the highest percentage of entries with about 32% in 2004 and around 44% in 2013 (INE, 2014).
Please note that the year 2011 found the highest peak due to the preparation and holding of the 10th All African Games. Also in June/July 2010 there was an increase in the number of overnight stays and this may be due to the realization of the World Cup held in South Africa, for the city of Maputo was a point of entry for football fans, where they had the opportunity to visit both countries while their stay throughout the football world.
Now doing an exploratory descriptive and graphical analysis, the variable ‘Harmonized Index of Consumer Prices, CPI’ (Fig. 4), are evidenced the CPI of the top five outbound tourism markets presumed to influence significantly the number of nights spent in Mozambique. The CPI is the cost of living in a given economy. Analysing, the graphics of the figure it can be noticed an evolution and positive trend over time, i.e., the prices of goods and services have an upward trend, which to some extent penalize the amount of goods and services to be acquired in particularly in general and tourism.

Analysing the information presented in Fig. 5, which shows the ‘Gross Domestic Product per capita GDP’, i.e., average per capita income, the main outbound tourism markets of Mozambique (including Mozambique), it appears that: GDP per capita registers an upward trend over time. The growing trend of GDP per capita can be considered a driver or tour the catalyst as, for tourists moving, income is one of the key elements. The analysis of the figure shows that the North American nationality of tourists has the highest GDP per capita (per capita income), which immediately leads them more likely to make tourism. Following these, are the tourists from the UK, Portugal, South Africa and, finally, Mozambique tourists.

It should be noted that the gross domestic product per capita of each country was multiplied by the exchange rate between that currency and the metical (Currency Mozambique) in order to get the gross domestic product in currency of Mozambique.
As for the variable ‘Exchange Rate, ER’ (Fig. 6), from the main outbound tourism markets in Mozambique presumed to influence the number of overnight stays it can be observed that there is an evolution over time, even though, there is much sway between 2004 and 2013, with the exception of South Africa that has weak variability or oscillation. The exchange rate is representative of the cost of living, when there is an upward tendency, it serves as a catalyst for the tourism and tends to lower when it penalizes the propensity to tourism, since tourists are left with less income to spend. Comparing the patents currencies in the figure below, it appears that the GBP is the strongest currency against the METICAL (measured in monetary unit, one), since so while keeping the other factors constant tourists from UK have higher probability or propensity to tourism. It follows the EURO, the DOLLAR and finally the METICAL.
4.2ANN model – empirical results
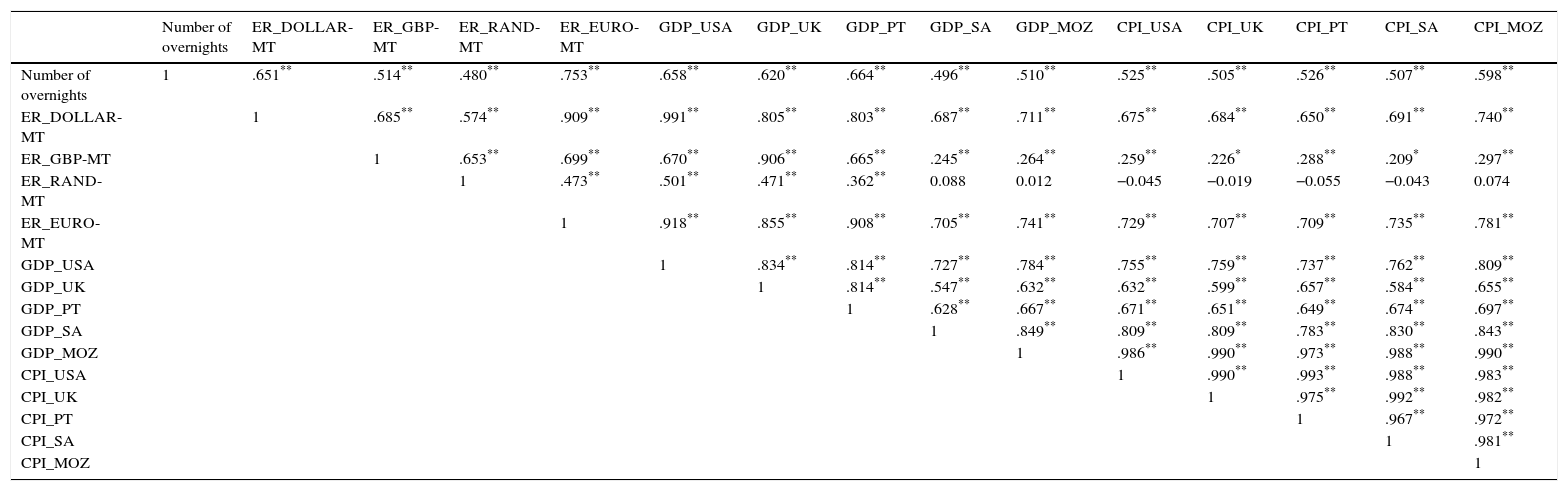
To build the artificial neural network model, first, begin to build the matrix of Pearson correlations (Table 2). From that table, variables that were more correlated with the variable to predict (number of overnight stays in hotels and the similar) and less with each other were selected and tested for the input layer. We selected the variables harmonized index of consumer prices in Mozambique (GDP_MOZ), exchange rates between ER_DOLLAR-MT, ER_EURO-MT, and ER_RAND-MT.
Matrix of Pearson correlation coefficient.
| Number of overnights | ER_DOLLAR-MT | ER_GBP-MT | ER_RAND-MT | ER_EURO-MT | GDP_USA | GDP_UK | GDP_PT | GDP_SA | GDP_MOZ | CPI_USA | CPI_UK | CPI_PT | CPI_SA | CPI_MOZ | |
|---|---|---|---|---|---|---|---|---|---|---|---|---|---|---|---|
| Number of overnights | 1 | .651** | .514** | .480** | .753** | .658** | .620** | .664** | .496** | .510** | .525** | .505** | .526** | .507** | .598** |
| ER_DOLLAR-MT | 1 | .685** | .574** | .909** | .991** | .805** | .803** | .687** | .711** | .675** | .684** | .650** | .691** | .740** | |
| ER_GBP-MT | 1 | .653** | .699** | .670** | .906** | .665** | .245** | .264** | .259** | .226* | .288** | .209* | .297** | ||
| ER_RAND-MT | 1 | .473** | .501** | .471** | .362** | 0.088 | 0.012 | −0.045 | −0.019 | −0.055 | −0.043 | 0.074 | |||
| ER_EURO-MT | 1 | .918** | .855** | .908** | .705** | .741** | .729** | .707** | .709** | .735** | .781** | ||||
| GDP_USA | 1 | .834** | .814** | .727** | .784** | .755** | .759** | .737** | .762** | .809** | |||||
| GDP_UK | 1 | .814** | .547** | .632** | .632** | .599** | .657** | .584** | .655** | ||||||
| GDP_PT | 1 | .628** | .667** | .671** | .651** | .649** | .674** | .697** | |||||||
| GDP_SA | 1 | .849** | .809** | .809** | .783** | .830** | .843** | ||||||||
| GDP_MOZ | 1 | .986** | .990** | .973** | .988** | .990** | |||||||||
| CPI_USA | 1 | .990** | .993** | .988** | .983** | ||||||||||
| CPI_UK | 1 | .975** | .992** | .982** | |||||||||||
| CPI_PT | 1 | .967** | .972** | ||||||||||||
| CPI_SA | 1 | .981** | |||||||||||||
| CPI_MOZ | 1 |
Note: * Significant at 5%; ** Significant at 1%.
It was decided to include the GDP_PT and GDP_USA variables to have a significant correlation with the output variable, and is not highly correlated between them.
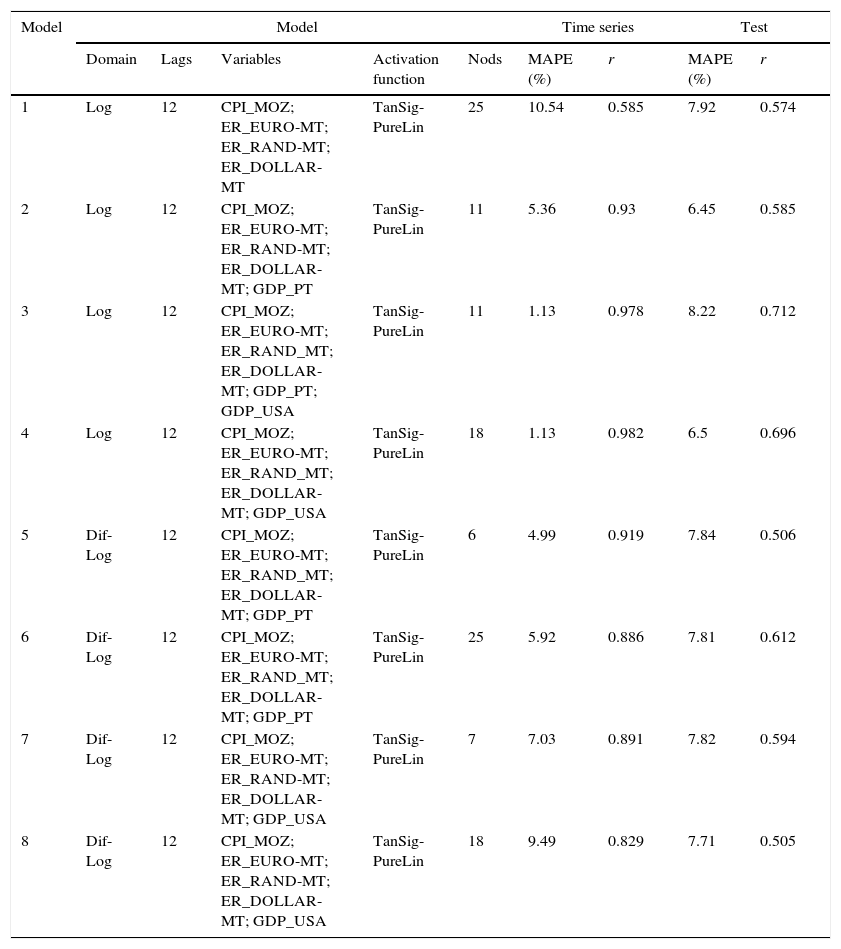
Several models were trained and tested by combining these variables in the input to identify the best set of variables. In total, 107 models were built. Table 3 shows the summary of 8 best models obtained.
Table of artificial neural network model.
| Model | Model | Time series | Test | ||||||
|---|---|---|---|---|---|---|---|---|---|
| Domain | Lags | Variables | Activation function | Nods | MAPE (%) | r | MAPE (%) | r | |
| 1 | Log | 12 | CPI_MOZ; ER_EURO-MT; ER_RAND-MT; ER_DOLLAR-MT | TanSig-PureLin | 25 | 10.54 | 0.585 | 7.92 | 0.574 |
| 2 | Log | 12 | CPI_MOZ; ER_EURO-MT; ER_RAND-MT; ER_DOLLAR-MT; GDP_PT | TanSig-PureLin | 11 | 5.36 | 0.93 | 6.45 | 0.585 |
| 3 | Log | 12 | CPI_MOZ; ER_EURO-MT; ER_RAND_MT; ER_DOLLAR-MT; GDP_PT; GDP_USA | TanSig-PureLin | 11 | 1.13 | 0.978 | 8.22 | 0.712 |
| 4 | Log | 12 | CPI_MOZ; ER_EURO-MT; ER_RAND_MT; ER_DOLLAR-MT; GDP_USA | TanSig-PureLin | 18 | 1.13 | 0.982 | 6.5 | 0.696 |
| 5 | Dif-Log | 12 | CPI_MOZ; ER_EURO-MT; ER_RAND_MT; ER_DOLLAR-MT; GDP_PT | TanSig-PureLin | 6 | 4.99 | 0.919 | 7.84 | 0.506 |
| 6 | Dif-Log | 12 | CPI_MOZ; ER_EURO-MT; ER_RAND_MT; ER_DOLLAR-MT; GDP_PT | TanSig-PureLin | 25 | 5.92 | 0.886 | 7.81 | 0.612 |
| 7 | Dif-Log | 12 | CPI_MOZ; ER_EURO-MT; ER_RAND-MT; ER_DOLLAR-MT; GDP_USA | TanSig-PureLin | 7 | 7.03 | 0.891 | 7.82 | 0.594 |
| 8 | Dif-Log | 12 | CPI_MOZ; ER_EURO-MT; ER_RAND-MT; ER_DOLLAR-MT; GDP_USA | TanSig-PureLin | 18 | 9.49 | 0.829 | 7.71 | 0.505 |
The neural network model used is as the multilayer type, having used three distinct layers, namely an input layer, with the previous twelve months plus the selected variables in its entrance; a hidden layer (hidden); and an output layer (corresponding to the number of overnight stays in hotels and similar establishments), with a feed forward structure. In the hidden layer, a sigmoid activation functions was used [TanSig] and [Logsig] and at the output layer, we used the linear activation function [PureLin], being the ones that provide the best results for this type of architectures. In network training, we used the Levenberg–Marquardt (Marquardt, 1963) Back propagation algorithm, a variant of the Back-Propagation training algorithm.
The available data was divided into three distinct groups, namely, a training set, a validation and test sets (Law & Au, 1999). The test set was never seen by the model in the training process. The test set consists of the last 12 months of the year 2013. The validation set was tested with two dimensions of 6 and 12 months. This validation set consists of 6 or 12 months prior to the test set (January or July to December 2012). Having verified that the results did not differ significantly, it was decided to use the 6-month validation set (July to December 2012). The training set corresponds to the remaining available months. A total that varied depending on the model, from February 2005 to June 2012, in case of models with differences and using 12 previous months at the entrance; and May 2004 to June 2012, the model with only four months earlier at the entrance. Thus the training set contains between 89 and 97 input output pairs.
The neural network model variants have been tried. Namely:
- •
Combinations of variables, GDP_MOZ; ER_EURO-MT, ER_RAND-MT, ER_DOLLAR-MT, GDP_PT and GDP_USA.
- •
Previous months number of output variable (number of lags).
- •
The output variable domain – was used the variable overnight stays with its absolute value (d), in the logarithmic domain (ld) and the differences of logarithms (dld).
- •
Activation of functions in the hidden layer – experienced is the sigmoidal tangent functions and logarithmic sigmoidal.
- •
The number in the hidden layer – some values between 3 and 40 nodes.
The models that were used in the differences of logarithms were determined by the difference of overnight stays of the current month to the previous month as in Eq. (7).

In this case, the forecast of overnight stays was obtained by a process of replacement of the differences as in Eq. (8).

Being the value in the logarithmic domain of nights planned for the month i, the difference of certain nights off the neural network and the real value of the logarithm of overnight stays in previous month.
The various training experiences and test of the neural network conducted to build up Table 3 by measuring the Mean Absolute Percentage Error and the Pearson correlation coefficient (e.g., Law & Au, 1999; Burger et al., 2001) in the test sets and three sets (Series=training+validation+test).
Analysis of the best results in test set models were selected to best summarize results presented in Table 3.
The results were selected based on the Mean Absolute Percentage Error (MAPE) and the Pearson correlation coefficient (r) of the test set. MAPE in the decision to rule a model has better forecast when submitting the lowest value according Lewis (1982) and with respect to the Pearson correlation coefficient model has better forecast when it presents the highest value.
Table 3 shows a summary of the best results obtained with the model of artificial neural networks.
From Table 3 it can be seen that the model has better performance in the logarithmic domain and logarithmic differences.
Regarding the number of Lags or previous months in neural network input the model performs better when they use 12 months. Table 3 only presents the model variants with 12 Lags.
Table 2 shows that compared the input variables, 4 of them (CPI_MOZ, ER_EURO-MT, ER_RAND-MT and ER_DOLLAR-MT) are common to all the best models. And variables related to GDP are needed at least one or even a combination of both (GDP_PT and GDP_USA).
The activation function in the hidden layer having best results was the sigmoidal tangent. In the output layer the linear function was always used.
The number of nodes in the hidden layer varies between 6 and 25 knots for the different combinations.
Analysing the results of Table 3, it appears that the value of MAPE and the value of the correlation r will vary in the test set between [6.45; 7.92] and [0.505; 0.712], respectively.
To select the best model can be regarded the one that has one that has a lower MAPE, which corresponds to the template whose sequence provided overnights is closer to the actual nights, or can select the model with the highest (r) corresponding one whose sequence forecasts of overnights follows best variations of the behaviour of actual overnight stays. Not always the model with the best MAPE (lowest) present a better r (higher). Thus, since the values are very close between 8 selected models presented in Table 3 and none could be used for the purpose of forecast overnights. However the model 4 presents a fairly low MAPE value (6.50%), almost the lowest value, and simultaneously a high (r) (0.696) for the remaining models, at the test set. This model also features very good results when considered all data (training, validation and test sets) with a MAPE value of 1.13% and the (r) of 0.982.
The model No. 4 has 18 nodes in the hidden layer; it is used the logarithmic domain; lags features 12 in the input layer; it is used the sigmoidal tangent activation function in the hidden layer and linear function in the output layer, and used the following variables GDP_MOZ, ER_EURO-MT, ER_RAND-MT, ER_DOLLAR-MT and GDP_USA led to better results in terms of MAPE and r coefficient.
Based on the above information it can be said that the model of artificial neural networks built to explain the tourist demand for Mozambique is presented in Table 3 and Eq. (9) below.
Fig. 7 shows the model based on the artificial neural network model in Table 3.

Eq. (9) illustrates in terms of the model in Eq. (4), which shows the model variables.
where l, is the month to which the data subject is forecast; X1, represent the variable CPI; X2, represent ER_EURO-MT variable; X3, represent ER_RAND-MT variable; X4, represent ER_DOLLAR-MT; X5, represent a variable GDP_PT; X6, represent a variable GDP_USA; X7, …, X18, represents overnight stays by months l−1 a l−12.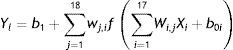
Fig. 8 presents the overnight stays of the actual and predicted values for the model 4. The last 12 months correspond to the test set.
5Conclusion and future lines of research
This study is aimed to model and forecast the tourism demand for Mozambique for the period from January 2004 to December 2013 using artificial neural networks models. The number of overnight stays in Hotels was used as representative of the tourism demand. This variable was used as the output of the model. A set of independent variables were experimented in the input of the model, namely: the Consumer Price Index, Gross Domestic Product (GDP) and Exchange Rates (ER) of the outbound tourism markets, South Africa (SA), United State of America (USA), Mozambique (MOZ), Portugal (PT) and the United Kingdom (UK).
A multilayer neural network with different combinations of variables in the input layer, one hidden layer with different number of nodes and one output layer was experimented. Empirical results showed that variables CPI_MT, ER_EURO-MT, ER_DOLLAR-MT and ER_RAND-MT are fundamental, and the GDP_PT and GDP_USA variables are also important to be used in the input of the model because the prediction results became improved.
The best results were obtained with the output in the logarithmic domain and using the previous 12 months besides the 6 mentioned variables in the input and 18 nodes in the hidden layer. The best model achieved a mean absolute percentage error (MAPE) of 6.5% and 0.696 for the Pearson correlation coefficient.
As future lines of research we proposed: increase of the time horizon to increase the accuracy of the model; aggregation of more variables, such as unemployment rate from main outbound tourism markets; variables related to marketing costs; dummy variables to explain the abnormal growth seen in 2011; the cost of travel and the distance between the outbound tourism markets and the tourism destination (Mozambique).
The utility of such a tool to forecast the tourism demand can be understood at three levels. At the higher level, for the economic agents it is important to have tools that allow them to know the expected evolution of the growth of this important economic sector of tourism. At another level it is also important for the stakeholders to know previously the future tourism demand in order to be prepared to offer products, services and infrastructures to meet the expectation of the tourists. Finally at a lower level, it is also important for the hotel establishments, municipal public services, travel agencies and other organizations that offer touristic products at the cultural, patrimonial, beach and nature tourism levels and other services in order to adequate its level of capacity to the forecast tourism demand.
Hortêncio André Constantino (M.Sc. in Management) is Professor of the Economics and Management Department in the Polytechnic Institute of Gaza (Mozambique). His research interest include: Modelling, Artificial Neural Network, Econometric Modelling and Management.
Paula Odete Fernandes (Ph.D. in Economics and Management) is Professor of Management, in the Polytechnic Institute of Bragança (IPB) – Portugal. She is researcher of NECE (UBI) and Scientific Coordinator of UNIAG (Applied Management Research Unit). Her research interest include: Tourism, Management, Artificial Neural Network, Entrepreneurship, Econometric Modelling, Marketing Research, and Applied Research Methods. Participation in 5 international projects I&D and more than 140 publications in proceedings and scientific journals with referee.
João Paulo Teixeira (Ph.D. in Electrical and Computers Engineering) is Adjunct Professor of the Electrical Department in the School of Technology and Management in the Polytechnic Institute of Bragança (IPB). His research interest include: Modelling, Artificial Neural Network, Signal Processing and Speech Processing.
