


Patients with schizophrenia have been found impaired in important aspects of their basic and social cognition. Our aim in this study is to explore the relationship between executive function (EF) and theory of mind (ToM) deficiencies in patients that suffer the illness.
Materials and methodsTwenty-two Spanish-speaking inpatients and 22 healthy controls matched in age, sex, education, language dominance, and premorbid IQ were assessed in EF and ToM abilities. The former were assessed using 10 tasks that covered 5 cognitive dimensions and the latter using 3 different tasks. Correlation analyses were used to explore the level of association between executive and mentalizing abilities. A series of discriminant function analyses were carried out to examine the relative contribution of each executive and mentalizing task to discriminate between patients and controls.
ResultsPatients showed impairments in both, executive and ToM abilities. The correlation analyses showed a virtual absence of association between EF and ToM abilities within the group of patients, and an almost opposite pattern within the healthy group. ToM performance was more accurate than executive performance to discriminate patients from controls.
ConclusionsAlthough EFs and ToM deficits come into view together in schizophrenia, they appear to belong to different and relatively independent cognitive domains.
En la esquizofrenia se han encontrado alteraciones en aspectos importantes de la cognición básica y social. El objetivo de este estudio es explorar la relación entre deficiencias en función ejecutiva (FE) y en teoría de la mente (TM) en pacientes que sufren esta enfermedad.
Materiales y métodosVeintidós pacientes de habla hispana y 22 controles emparejados a los primeros en edad, sexo, educación, lengua dominante y CI premórbido fueron evaluados en FE y capacidad de TM. Para evaluar las FEs se utilizaron 10 tareas que abarcan 5 dimensiones cognitivas, mientras que para evaluar la TM se han utilizado 3 tareas distintas. Para explorar el grado de asociación entre habilidades ejecutivas y mentalistas se han empleado técnicas de análisis correlacional. A través del análisis discriminante se ha examinado la contribución relativa de cada tarea ejecutiva y mentalista a la hora de discriminar entre pacientes y controles.
ResultadosLos pacientes presentaron alteraciones tanto en su capacidad ejecutiva como mentalista. El análisis de correlación mostró una ausencia de asociación entre FEs y habilidades de TM dentro del grupo de pacientes, mientras que el patrón fue más bien opuesto en el grupo control. El rendimiento en TM fue más preciso que el rendimiento ejecutivo para predecir a qué grupo pertenecían los participantes.
ConclusionesAunque los déficits en FE y en TM aparecen conjuntamente en la esquizofrenia, ambos pertenecen a dominios cognitivos distintos y relativamente independientes.
Schizophrenia is conceptualized as a neurobiological disorder that entails a severe and persistent functional impairment. The NIMH-Measurement and Treatment Research to Improve Cognition in Schizophrenia (MATRICS)1 has identified several separable domains of cognitive impairment in people affected by the illness. Those domains can be grouped under the umbrella of neurocognition (non-social) or social cognition. Since non-social and social cognition appear systematically impaired in schizophrenia they are considered core features of the illness as well as highly relevant to its functional outcome.
The neurocognitive functioning in schizophrenia is characterized by severe impairments in a wide range of cognitive processes, especially, the ones considered purely neuropsychological, such as attention, memory, and other executive functions (EFs). EFs were defined by Lezak2 as the mental abilities needed to perform an effective, creative and socially accepted behavior. Other authors3 place EFs as encompassing a range of cognitive processes as anticipation, goal selection, planning, behavior's choice, self-regulation, self-control and cognitive feedback. The main purpose of these processes is to orchestrate the function of other systems in the performance of complex tasks, as comprehension, learning and reasoning. Very recently, Banich4 has proposed a model that attempts to integrate the levels of neurobiology, psychology, and computation to provide a better comprehension of this set of abilities. The investigation of EFs in schizophrenia has been rather heterogeneous and many studies inform of impairments in multiple executive domains.5–7
From the field of social cognition, ToM is considered the natural capacity that allows us to decode or understand our own mental states or the ones of other people.8 As a matter of fact, the neuropsychological studies of ToM have found this capacity consistently impaired in people suffering from schizophrenia.9–12 The co-occurrence between anomalies in basic cognitive functions and ToM abilities has been treated in an important number of studies. The systematic review carried out by Pickup13 revealed that in all cases patients were impaired in their executive and mentalizing domains, and two thirds of the studies showed correlations between some executive and some ToM task. This author points out that in the eight studies that used multivariate statistics, ToM performance continued predicting the schizophrenia group once EF was controlled for. The evidence examined leads Pickup to conclude that ToM impairment in schizophrenia reflects the dysfunction of a domain-specific cognitive system rather than a domain-general executive impairment.
One of the problems in previous studies that somehow deal with the co-occurrence of executive and mentalizing impairments is not taking into account the multifaceted nature of the EF concept. To account for it, we aimed to analyze the relationship between schizophrenic's anomalies in EFs and ToM, by using a combination of tasks in each of these domains. On the one hand, we have chosen a set of reasonably easy tasks that are regularly administered to patients with schizophrenia but that at the same time are reliable estimators of the most important dimensions of EF, such as attention, working memory, reasoning, cognitive flexibility, and verbal fluency. On the other hand, we have selected a set of non-verbal and verbal ToM tasks in order to have an improved and more accurate estimation of mentalizing impairment in schizophrenia, all of them composed of critical items (false belief specific) and control items (non-false belief). With regard to participants, we have been particularly strict when matching patients to healthy controls in sex, age, educational level, language dominance, and premorbid IQ. We are interested in clarifying whether in our Spanish-speaking sample of patients the expected mentalizing impairments are a projection of the well-known executive anomalies or, as some studies13 point out, they can be better conceptualized as independent of basic cognitive functioning.
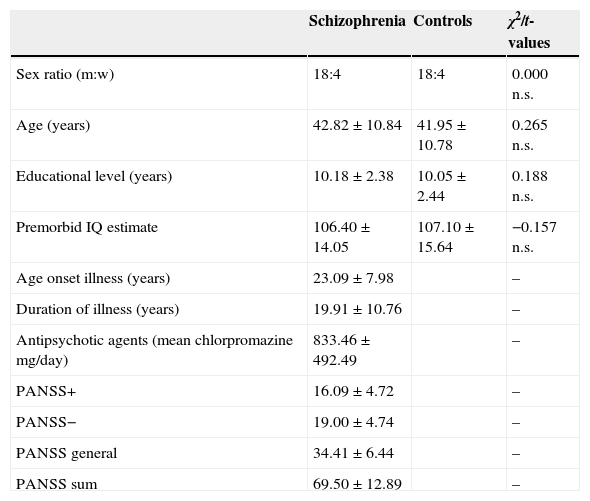
Materials and methodsParticipantsTwenty-two volunteers with schizophrenia were recruited (18 men and 4 women). They all were inpatients from the Rehabilitation Unit at the Hospital Psiquàtric Universitari Institut Pere Mata (Reus, Spain). All of the patients fulfilled the ICD-1014 criteria for schizophrenic disorder, and were taking antipsychotic agents at the time of the study. As a group, they show a moderate level of symptoms according to the PANSS,15 though individually they were clinically stable and none of them was in remission in accordance with the above mentioned scale. All patients were Spanish-speakers, but Catalan language was considered as a variable since the community where the hospital is settled has Spanish and Catalan as common usage languages. Patients with a history of traumatic brain injury, acute exacerbation stage of the illness, and physical disability (visual or auditory) were excluded from the study. The investigation was approved by the St. Joan Hospital (Reus, Spain) ethics committee, and informed written consent was obtained from each patient and healthy comparison participant. The comparison group consisted of 22 healthy control participants (18 men, 4 women) carefully recruited from the general community once the socio-demographic characteristics of each patient were known. Control subjects were matched one by one to patients in sex, age, educational level, language dominance, and premorbid IQ. Exclusion criteria for controls included current or past psychiatric disease, history of central nervous system disease, history of substance dependence, or physical disability. That information was obtained from potential control participants through a previous questionnaire. Clinical characteristics for patients and demographic background for both the patients and controls groups are shown in Table 1.
Clinical and demographic details of participants (means±standard deviations).
| Schizophrenia | Controls | χ2/t-values | |
|---|---|---|---|
| Sex ratio (m:w) | 18:4 | 18:4 | 0.000 n.s. |
| Age (years) | 42.82±10.84 | 41.95±10.78 | 0.265 n.s. |
| Educational level (years) | 10.18±2.38 | 10.05±2.44 | 0.188 n.s. |
| Premorbid IQ estimate | 106.40±14.05 | 107.10±15.64 | −0.157 n.s. |
| Age onset illness (years) | 23.09±7.98 | – | |
| Duration of illness (years) | 19.91±10.76 | – | |
| Antipsychotic agents (mean chlorpromazine mg/day) | 833.46±492.49 | – | |
| PANSS+ | 16.09±4.72 | – | |
| PANSS− | 19.00±4.74 | – | |
| PANSS general | 34.41±6.44 | – | |
| PANSS sum | 69.50±12.89 | – |
IQ, intellectual quotient; m, men; n.s., non significant; PANSS, Positive and Negative Syndrome Scale; w, women.
We administered a total of 10 tests in order to cover the neurocognitive dimensions of attention (2), working memory (2), reasoning (3), cognitive flexibility (1), and verbal fluency (2).
AttentionThe Stroop test16 and the Toulouse-Piéron test.17 The first assesses dimensions associated to basic components of EFs, such as selective attention, resistance to interference and inhibition of automatic responses, while the second evaluates sustained attention, concentration and resistance to monotony.
The Spanish adaptation of the Stroop test consists of three sheets displaying 100 stimuli each. The first sheet contains color words that have to be read. The second has colored stimuli with no meaning that have to be named. The third sheet contains color words painted in colors that do not match with the meaning of the written word. The participants had 45s to perform each sheet, reading or naming colors. The test offers a direct measure of each sheet and a calculated measure of resistance to interference.
The Toulouse-Piéron test is made of one only sheet displaying 1600 small squares (in 40 rows of 40 elements) that have attached a small dash at one of its sides or vertices. The participant is initially presented with 2 models (2 different squares with the dash in a specific position) and his task is for 10min, to identify by a tick those squares that have the dash in the same position of the models. The final score of each participant takes into account hits, errors and omissions.
Working memoryDigit span forward and backward from the WAIS-III.18 In this task the participant had to repeat verbally several numbers strings told by the experimenter in a direct or reverse order respectively. Finally, 2 raw measures are obtained, one for digit span forward and other for digit span backwards. Notice that although both scales are grouped under the dimension of working memory, the digit span forward task is more related with immediate memory, while the digit span backwards is the proper working memory task; that is the reason why we have kept both scores separated in the analyses.
ReasoningSimilarities, block design and visual puzzles from the WAIS-III. In the first task the participant is requested about the likeness between two words that depict common objects or concepts, such as table-chair, poem-statue or work-game. The second task is non-verbal, and consists of colored blocks that have to be placed together to make designs. The third task is also non-verbal and consists of several figures that have to be built by assembling pieces of a puzzle. A direct measure from each task was obtained.
Cognitive flexibilityTrail making test19 (TMT). This test has two parts, A and B. In the first part the participant is presented with 25 small circles containing numbers that are distributed in a sheet (from 1 to 25). The second part is made of 25 circles containing numbers and letters (from 1 to 13 and A to L) that also are distributed in a sheet. The task of the participant is first to connect by a line the numbers in their correct sequence (part A: 1-2-3…) and afterwards numbers that alternate with letters (part B: 1-A-2-B…). The task provides three different measures: time employed to complete part A, time needed for part B, and the difference of time between parts A and B (B–A). Notice that the specific cognitive flexibility measures are the part B and the difference between both (B–A). The part A assesses psychomotor speed and serves as baseline.
Verbal fluencyControlled oral word association test.20 This test measures phonologic and semantic fluency dimensions. In the first task the participant has to produce words starting with a particular letter (F, A and S) during 1min. In the second task the participants had to say in 1min, words fitting the category “animals”. Finally two measures were obtained, one for phonologic fluency (average of uttered words starting with F, A and S), and other for semantic fluency (number of uttered animals).
ToM assessmentWe have combined verbal and non-verbal tasks in order to obtain a representative measure of the participants’ mentalizing abilities. The three task used have proved their reliability in several studies that evaluated clinical patients.
ToM-1. Picture sequencing task (non-verbal)This task21–23 includes four different types of story: false-belief (FB; character acts on the basis of a false belief); mechanical (MEC; causal interactions between objects); social scripts (SS; everyday social routines); and capture stories (CAP; which include a salient “decoy” cue intended to mislead participants). Each type of story contained four items. FB-stories test the ability to go beyond the objective facts so as to infer mental states; the remaining stories are used as control. An average measure of each type of story was obtained.
ToM-2. Cartoon task (non-verbal)In this task, participants were asked to answer the question “Why is this funny?” for 20 black and white cartoons already used in other studies.24 Half of them required an understanding of characters’ mental states (FB set), while the others were based on absurd humor (non-FB set) and used as control for the first one. A direct measure of each type of cartoon was obtained.
ToM-3. Story task (verbal)Nine short passages, each followed by a test question, were used in this task. The original task was composed by 16 short passages built to assess theory of mind in healthy participants by means of functional imaging study.25 We decided to shorten the amount of passages in order to adapt the task to patients’ executive functions difficulties. There were three types of story passages: ToM stories (FB), non-ToM (non-FB) stories, and scrambled (SCR) stories. A direct measure of each type of story was obtained.
Statistical analysisStatistical analyses were carried out by using IBM SPSS Statistics 20 for Windows. Initial group comparisons on demographic variables were conducted with t-test for continuous variables and χ2 tests for categorical variables. Before processing the data, the raw scores on the TMT (in seconds for A and B) have been inverted. The transformation allows expressing and interpreting all the scores in the same direction, that is, higher scores depict better performance than low scores. Afterwards, all individual raw scores were converted to relative percentage using as reference, on each task, the highest standard possible score or the best performance score in the cases that there was not standard top.
In order to have a clear representation of patients’ performance in relation to controls in every assessed variable (following Bozikas et al.5) their scores were transformed. First, all the scores were converted on z-scores using the 44 participants (patients and controls) as a whole group. Afterwards we reduced the mean z-scores for each group in each measure by subtracting the mean z-score of the healthy group, from each individual z-score to obtain a new z-score mean. This procedure yielded a mean of zero for the control group on each measure, but lower than zero for the schizophrenic group. The procedure allows representing the mean performance of the healthy group as a baseline, and showing the deficiency of patients expressed in standard deviations.
The procedure followed in applying statistical techniques was as follows. Firstly, performance differences between groups were examined by using t-tests. Secondly, the level of association of EFs with ToM was determined within each group of participants by using Pearson's correlation coefficient. Finally, we carried out a series of three discriminant function analyses: the first one was done by using the most relevant measures of each EF test; the second one was done by using all ToM measures, 3 corresponding to critical (FB items) and 6 to control items (non-FB); the third analysis included the measures (EF and ToM) that obtained significance in the two previous discriminant analyses. The main aim of every discriminant function analysis was elucidating the relative contribution of EF and ToM measures (on their own and together) when it comes to discriminating between patients and controls. As a secondary aim, we also were interested in clarifying which set of variables were better in classifying participants, that is, testing the goodness of fit of the statistical model in each analysis.
ResultsAs it was shown in Table 1, both groups do not differ significantly in age (p=0.792), sex ratio (p=1), educational level (p=0.852), or premorbid IQ estimate (p=0.876).
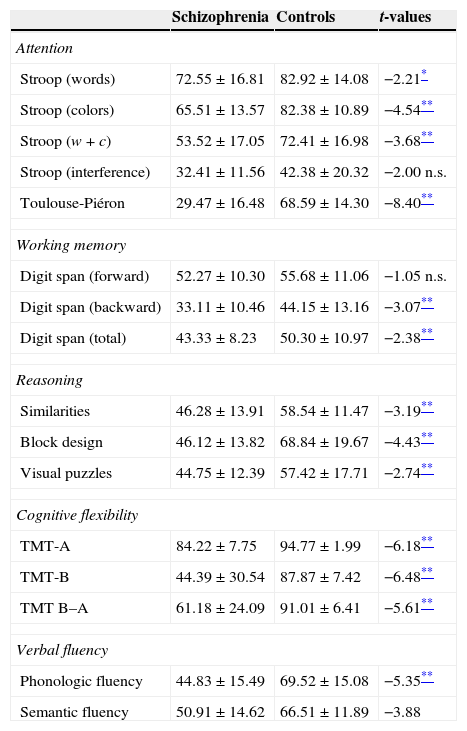
Executive functionsTable 2 summarizes the mean scores of both groups expressed in relative percentage. The contrasts show that patients as a group had a lower performance than controls in almost all measures. The only measures that show no differences between groups are the calculated interference in the Stroop test (p=0.052), and the Digit span forward (p=0.296). For a better illustration of these results, the z-scores transformations depicted on Fig. 1 present the mean performance of the control group as baseline, and show the deficiency of patients expressed in standard deviations. Measures that are derived from a mathematical calculation based on other measures have not been included in the graph because the information they provide is redundant (i.e., the calculated interference in the Stroop test, the total sum in the Digit span test, or the subtraction B–A in the TMT).
Mean performance of patients and controls on EFs tests expressed in relative % (means±standard deviations).
| Schizophrenia | Controls | t-values | |
|---|---|---|---|
| Attention | |||
| Stroop (words) | 72.55±16.81 | 82.92±14.08 | −2.21* |
| Stroop (colors) | 65.51±13.57 | 82.38±10.89 | −4.54** |
| Stroop (w+c) | 53.52±17.05 | 72.41±16.98 | −3.68** |
| Stroop (interference) | 32.41±11.56 | 42.38±20.32 | −2.00 n.s. |
| Toulouse-Piéron | 29.47±16.48 | 68.59±14.30 | −8.40** |
| Working memory | |||
| Digit span (forward) | 52.27±10.30 | 55.68±11.06 | −1.05 n.s. |
| Digit span (backward) | 33.11±10.46 | 44.15±13.16 | −3.07** |
| Digit span (total) | 43.33±8.23 | 50.30±10.97 | −2.38** |
| Reasoning | |||
| Similarities | 46.28±13.91 | 58.54±11.47 | −3.19** |
| Block design | 46.12±13.82 | 68.84±19.67 | −4.43** |
| Visual puzzles | 44.75±12.39 | 57.42±17.71 | −2.74** |
| Cognitive flexibility | |||
| TMT-A | 84.22±7.75 | 94.77±1.99 | −6.18** |
| TMT-B | 44.39±30.54 | 87.87±7.42 | −6.48** |
| TMT B–A | 61.18±24.09 | 91.01±6.41 | −5.61** |
| Verbal fluency | |||
| Phonologic fluency | 44.83±15.49 | 69.52±15.08 | −5.35** |
| Semantic fluency | 50.91±14.62 | 66.51±11.89 | −3.88 |
c, colors; TMT, Trail Making Test; w, words.

Fig. 1 shows that the worse EF performance of patients in relation to their controls is situated in the domain of sustained attention (Toulouse-Piéron test) and cognitive flexibility (TMT).
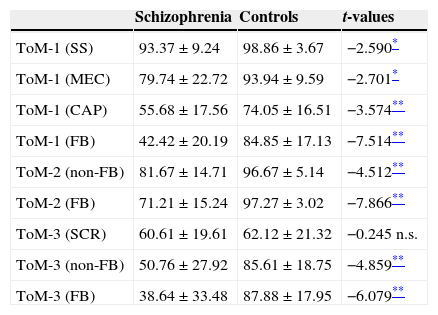
Theory of mindTable 3 summarizes the relative percentage mean scores of both groups in the three ToM tasks. In all ToM measures (3 FB-critical and 6 non-FB control conditions) patients show significant statistical differences in respect to controls except for the SCR items mean score in ToM-3. Patients performed worse than controls in general (see Fig. 2), and more importantly, in each task (ToM-1, 2 & 3) patients clearly presented their higher difficulty in the FB-critical condition. At this point our interest is to explore the level of association between executive and mentalizing abilities.
Mean performance of patients and controls on ToM tasks expressed in relative % (means±standard deviations).
| Schizophrenia | Controls | t-values | |
|---|---|---|---|
| ToM-1 (SS) | 93.37±9.24 | 98.86±3.67 | −2.590* |
| ToM-1 (MEC) | 79.74±22.72 | 93.94±9.59 | −2.701* |
| ToM-1 (CAP) | 55.68±17.56 | 74.05±16.51 | −3.574** |
| ToM-1 (FB) | 42.42±20.19 | 84.85±17.13 | −7.514** |
| ToM-2 (non-FB) | 81.67±14.71 | 96.67±5.14 | −4.512** |
| ToM-2 (FB) | 71.21±15.24 | 97.27±3.02 | −7.866** |
| ToM-3 (SCR) | 60.61±19.61 | 62.12±21.32 | −0.245 n.s. |
| ToM-3 (non-FB) | 50.76±27.92 | 85.61±18.75 | −4.859** |
| ToM-3 (FB) | 38.64±33.48 | 87.88±17.95 | −6.079** |
CAP, capture stories; FB, false-belief; MEC, mechanical; n.s., non significant; SCR, scrambled stories; SS, everyday social routines.

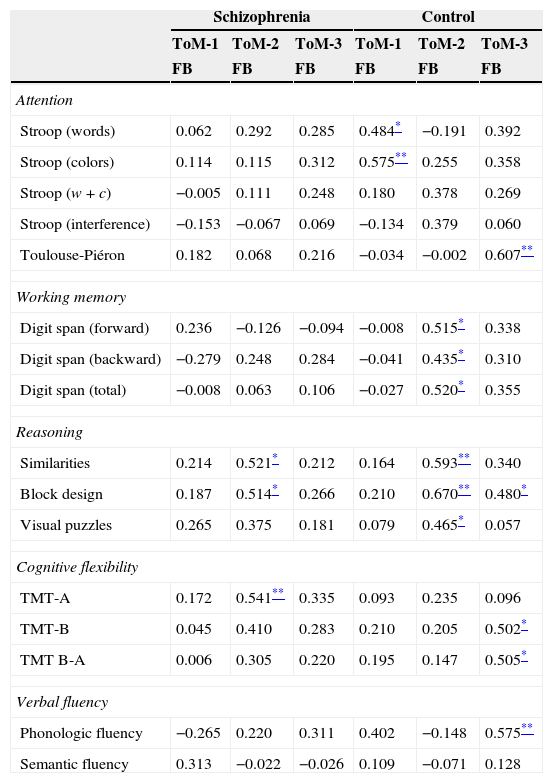
Table 4 shows the correlations within each group between measures of EF and ToM. For the latter the only measures considered are the ones that specifically assess mentalizing abilities in each task, that is, the false belief critical conditions. It can be seen that within the group of patients the relationship between both capacities almost does not appear, while the control group shows associations between ToM abilities and each EF evaluated dimension: attention, working memory, reasoning, cognitive flexibility, and phonologic fluency. Given the absence of significant correlations within the group of patients, we repeated the analyses in this group but controlling for medication dose and symptomatology through partial correlation techniques. When controlling for medication dose, there were no changes in the number of significant correlations; and when controlling for symptomatology (using the 3 PANSS scales together) there were no changes either except for the correlation between FB-ToM-2 and visual puzzles (r=0.491, p=0.033) that reached significance.
Correlations for ToM critical FB-conditions and EF tasks within the groups of patients and controls.
| Schizophrenia | Control | |||||
|---|---|---|---|---|---|---|
| ToM-1 | ToM-2 | ToM-3 | ToM-1 | ToM-2 | ToM-3 | |
| FB | FB | FB | FB | FB | FB | |
| Attention | ||||||
| Stroop (words) | 0.062 | 0.292 | 0.285 | 0.484* | −0.191 | 0.392 |
| Stroop (colors) | 0.114 | 0.115 | 0.312 | 0.575** | 0.255 | 0.358 |
| Stroop (w+c) | −0.005 | 0.111 | 0.248 | 0.180 | 0.378 | 0.269 |
| Stroop (interference) | −0.153 | −0.067 | 0.069 | −0.134 | 0.379 | 0.060 |
| Toulouse-Piéron | 0.182 | 0.068 | 0.216 | −0.034 | −0.002 | 0.607** |
| Working memory | ||||||
| Digit span (forward) | 0.236 | −0.126 | −0.094 | −0.008 | 0.515* | 0.338 |
| Digit span (backward) | −0.279 | 0.248 | 0.284 | −0.041 | 0.435* | 0.310 |
| Digit span (total) | −0.008 | 0.063 | 0.106 | −0.027 | 0.520* | 0.355 |
| Reasoning | ||||||
| Similarities | 0.214 | 0.521* | 0.212 | 0.164 | 0.593** | 0.340 |
| Block design | 0.187 | 0.514* | 0.266 | 0.210 | 0.670** | 0.480* |
| Visual puzzles | 0.265 | 0.375 | 0.181 | 0.079 | 0.465* | 0.057 |
| Cognitive flexibility | ||||||
| TMT-A | 0.172 | 0.541** | 0.335 | 0.093 | 0.235 | 0.096 |
| TMT-B | 0.045 | 0.410 | 0.283 | 0.210 | 0.205 | 0.502* |
| TMT B-A | 0.006 | 0.305 | 0.220 | 0.195 | 0.147 | 0.505* |
| Verbal fluency | ||||||
| Phonologic fluency | −0.265 | 0.220 | 0.311 | 0.402 | −0.148 | 0.575** |
| Semantic fluency | 0.313 | −0.022 | −0.026 | 0.109 | −0.071 | 0.128 |
FB: false belief condition.
The independent variables used as predictors of group membership in the first analysis include 13 EF measures. They are all that appear in Table 2 with the exception of the three combined measures mentioned in the “Executive functions” section.
Just one discriminant function was obtained given that the criterion variable “group” was dichotomous. Function 1 was statistically significant (χ2=44.146, df=13, p<0.001), which indicates that it makes a significant contribution to prediction of group affiliation. It accounts for 84.4% of between group variance and separates well patients (M=−1.535) from controls (M=1.535). In view that the assumption of homoscedasticity was violated (Box’ M=249.190, df1=91, df2=5528.575, p<0.001), we used the option of “separate-groups” covariance in classification. The usefulness of the equation extracted in discriminating correctly between patients and controls was confirmed by the classification procedure. Results show that 88.6% of subjects were correctly classified in their membership group, exceeding the value for classification based on chance (50%). Three patients were misclassified as control subjects and two controls as patients.
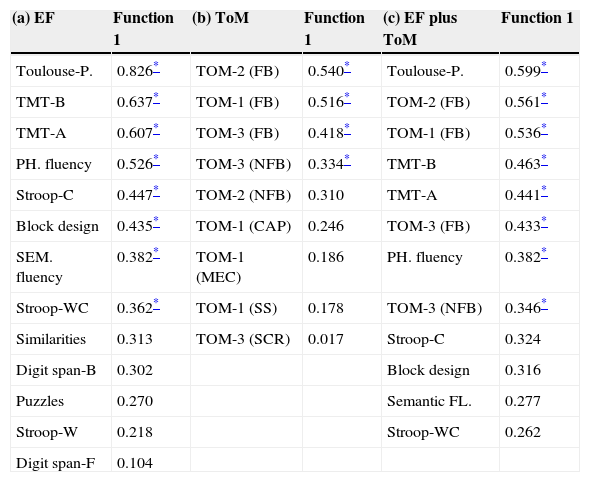
In Table 5(a) the loadings or structure coefficients for function 1 are reported. From the obtained weights, it can be seen that in relation to EFs performance, the best predictors discriminating patients from controls are by this order: (a) Toulouse-Piéron test, (b) TMT-B, (c) TMT-A, (d) phonological fluency task, (e) Stroop-C task, (f) block design task, (g) semantic fluency task, and (h) Stroop-WC task.
Structure matrix corresponding to the three discriminant analysis: (a) EF, (b) ToM and (c) combined EF and ToM variables.
| (a) EF | Function 1 | (b) ToM | Function 1 | (c) EF plus ToM | Function 1 |
|---|---|---|---|---|---|
| Toulouse-P. | 0.826* | TOM-2 (FB) | 0.540* | Toulouse-P. | 0.599* |
| TMT-B | 0.637* | TOM-1 (FB) | 0.516* | TOM-2 (FB) | 0.561* |
| TMT-A | 0.607* | TOM-3 (FB) | 0.418* | TOM-1 (FB) | 0.536* |
| PH. fluency | 0.526* | TOM-3 (NFB) | 0.334* | TMT-B | 0.463* |
| Stroop-C | 0.447* | TOM-2 (NFB) | 0.310 | TMT-A | 0.441* |
| Block design | 0.435* | TOM-1 (CAP) | 0.246 | TOM-3 (FB) | 0.433* |
| SEM. fluency | 0.382* | TOM-1 (MEC) | 0.186 | PH. fluency | 0.382* |
| Stroop-WC | 0.362* | TOM-1 (SS) | 0.178 | TOM-3 (NFB) | 0.346* |
| Similarities | 0.313 | TOM-3 (SCR) | 0.017 | Stroop-C | 0.324 |
| Digit span-B | 0.302 | Block design | 0.316 | ||
| Puzzles | 0.270 | Semantic FL. | 0.277 | ||
| Stroop-W | 0.218 | Stroop-WC | 0.262 | ||
| Digit span-F | 0.104 |
CAP, capture stories; EF, executive function; FB, false-belief; MEC, mechanical; SCR, scrambled stories; TMT, Trail Making Test; ToM, theory of mind.
The variables used as predictors in the second analysis include the 9 ToM measures used to assess mentalizing abilities. Just one discriminant function was obtained. Function 1 was statistically significant (χ2=67.483, df=9, p<0.001) and in this case accounts for 91.4% of between group variance; separating perfectly patients (M=−2.195) from controls (M=2.195). Homoscedasticity was violated (Box’ M=119.885, df1=45, df2=5795.061, p<0.001), so we used again the option of “separate-groups” covariance in classification. The usefulness of the extracted equation in discriminating correctly between groups was confirmed by the classification procedure. Results show that in this case, all subjects (100%) were correctly classified in their membership group, far exceeding a based on chance classification value. In Table 5(b), the structure coefficients for function 1 show that the best predictors discriminating patients from controls are by this order: (a) FB-ToM-2, (b) FB-ToM-1, (c) FB-ToM-3, and (d) NFB-ToM-3.
Discriminant 3 (EFs and ToM)The independent variables employed as predictors in the last analysis of the series are the 8 EF measures that reported significance in the first discriminant analysis, and the 4 ToM measures significant in the second. Only one discriminant function was obtained and was statistically significant (χ2=62.556, df=12, p<0.001). In this case it accounts for 90.8% of between group variance and perfectly separates patients (M=−2.114) from controls (M=2.114). Homoscedasticity was once more violated (Box’ M=260.069, df1=78, df2=5570.418, p<0.001), so we used the option of “separate-groups” covariance in classification. The efficacy of the extracted equation in discriminating correctly between groups was confirmed by the classification procedure. Results show that for a second time, all subjects (100%) were correctly classified in their membership group. In Table 5(c), the structure coefficients for function 1 show that in this last analysis, when it comes to separating patients from controls, the best predictors are by this order: (a) Toulouse-Piéron test, (b) FB-ToM-2, (c) FB-ToM-1, (d) TMT-B, (e) TMT-A, (f) FB-ToM-3, (g) phonological fluency task, and (h) NFB-ToM-3.
DiscussionThe group of patients evaluated in this study shows impairments in both their executive functions and their mentalizing abilities. Deficits in memory, attention, and the assessed executive functions in the group of patients are in accordance with previous studies.5,7 Similarly, impairments in ToM are in line with those found in earlier investigations with comparable tasks.9–12 When looking at the EFs performance profile, we have found that the more deteriorated dimensions in our group of patients lie in the areas of sustained attention and cognitive flexibility. In both tests patients performed close to one-and-a-half standard deviations below the score of the healthy group. In relation with mentalizing abilities we have found that in the three ToM tasks used, patients decisively show greater difficulty in the false belief critical conditions than in the neutral ones. The most informative of the ToM results is that in each of the three tasks, patients show their larger differences compared to controls in the critical FB conditions, namely, the items that specifically detect mentalizing abilities. At the same time, it is important to notice that the difference between patients and controls is much bigger in ToM than in EFs, as is well illustrated by comparing Fig. 1 with Fig. 2.
In answer to our main aim, we conducted a correlational analysis within each group of participants in order to clarify the type of relationship between executive and mentalizing abilities. On the one hand, results show almost an absence of correlation between both types of abilities within the patients group. On the other hand, a different pattern appeared within the healthy group, where the association between executive and mentalizing abilities is notorious. In this group, each of the five dimensions evaluated correlated significantly with one or more of the ToM-FB tasks. We interpret that when the executive functions and mentilizing abilities are in use by minds that work within a cognitive standard, as is the case of the healthy group, they show a well-coordinated functioning and they appear consistently interconnected. However, in the case of schizophrenia, where patients suffer a remarkable cognitive breakdown, the deficient executive and mentalizing skills show a less connected functioning. Furthermore, the lack of correlation within the group of patients cannot be explained by the dose of medication prescribed, neither by their present symptomatology. Taking into account the limitations of the sample, we wondered if correlation results would remain stable in the group of patients when using a larger number of participants. But in any case, the relationships between ToM and EFs found in the control group tell us that the lack of significant correlations in patients should be attributed to something different than the number of participants.
The results of the discriminant function analyses show that EF and ToM performance explain a high portion of the variance in the three cases, when the tasks of each dimension were introduced alone or together. At the same time, the three analyses are highly accurate when classifying participants. It can be seen that the one that used ToM tasks as predictors explains more variance than the other two, being better than the first one (EFs) and as good as the third one (joined measures) when classifying participants. That is, adding the EFs measures to the ToM ones does not improve the predictions of the ToM performance alone.
According to the structure matrix loadings on the third analysis, the best predictors of group membership are sustained attention, the two non-verbal mentalizing tasks, cognitive flexibility and the verbal ToM task. This result suggests that in the contribution to the separation of groups there is no clear predominance of one dimension over the other, although ToM tasks are better than the EF ones to predict and assign participants to groups.
As for the limitations of the study, we consider that the relatively small size of the sample may influence the power of the correlation and discriminant function analysis techniques employed. The fact that most of our participants were long-term ill inpatients could have had some effects on cognitive functioning, but this is an inherent limitation of all investigations with inpatients. Nowadays many neurocognitive researches in schizophrenia involve outpatients so that potential limitation would not be in force. On the other hand, we reduced the number of items of the original verbal Story Task26 used to assess ToM in order to reduce the verbal memory load in patients and that could have restricted the precision of ToM evaluation. The use of a more complete set of tasks (second order and others for ToM and more diverse ones for EFs) would be desirable for future research in order to improve the accuracy of executive and mentalizing assessment.
Finally, according to our evidence and in line with the results obtained in previous studies,13 we can conclude that EFs and ToM abilities are genuinely impaired in people suffering schizophrenia and markedly compromise different aspects of patients’ behavior. Although both types of deficits appear together in the illness, our correlational data suggest that they might belong to different and relatively independent cognitive domains. The healthy group has no problem to use interactively their intact executive and mentalizing abilities, but when these get impaired as happens in schizophrenia, they appear to be selectively damaged as the lack of interaction in their functioning demonstrates. This conclusion should have its projection when designing cognitive rehabilitation programs since EFs and ToM deficiencies are both involved27 in the functional outcome of schizophrenia.
Ethical disclosuresProtection of human and animal subjectsThe authors declare that no experiments were performed on humans or animals for this investigation.
Confidentiality of dataThe authors declare that they have followed the protocols of their work center on the publication of patient data and that all the patients included in the study have received sufficient information and have given their informed consent in writing to participate in that study.
Right to privacy and informed consentThe authors have obtained the informed consent of the patients and/or subjects mentioned in the article. The author for correspondence is in possession of this document.
FundingThis work was partially supported by the Spanish Ministry of Science and Education (research project PSI 2012-37623) and by a grant from the Generalitat de Catalunya (2009-SGR-401).
Conflict of interestThe authors declare no conflict of interest.
Please cite this article as: Gavilán JM, García-Albea JE. La función ejecutiva en la esquizofrenia y su asociación con las habilidades cognitivas sociales (mentalistas). Rev Psiquiatr Salud Ment (Barc.). 2015;8:119–129.