


The present study aims to test, under different simulated anatomic circumstances the sensitivity and reproducibility of the T‐Scan®III HD sensor (T‐Scan® Tekscan Incorporation, Boston, USA), the newest generation of a computerized occlusal analysis device.
MethodsFour different occlusal tables were created: two of 120° represented by an artificial inferior first molar either embedded in a periodontal‐ligament‐simulator or not; one of 100° (simulating the occlusion of anterior teeth) and a plane surface (180°) in static and variable positions. Three levels of force (10N, 50N and 150N) were applied, 40 times each, by a universal testing machine (Autograph®, AG‐I) with a spherical bur (diameter=2.2mm) on the sensor film. One‐way ANOVAs with Bonferroni corrections for post hoc tests were used for multiple comparisons.
ResultsAccording to our study, 85% of the outliers are within the 5 first closures, representing the conditioning time required by the initially flat sensor. Graphically and statistically sustained differences (p<0.05) in the recorded data could only be found when the sensor's position was switched between closures, but not in the other circumstances.
ConclusionsAn undeniable improvement of the T‐Scan®III HD system as compared to former designs could be shown. The anatomic circumstances did not influence the sensor's sensibility or reproducibility. However, further studies on the varying sensitivity throughout its sensing surface are required. Its reproducibility could be proved, except for the 5 first values (outliers to the mean values), which shall be used as a conditioning time to both the sensor and the patient.
Este estudo tem como objetivo testar a mais recente geração do T‐Scan®III HD (T‐Scan® Tekscan Incorporation, Boston, USA), um sistema de análise oclusal computadorizada, quanto a sua sensibilidade e reprodutibilidade em diferentes situações anatómicas simuladas.
MétodosForam criadas 4 mesas oclusais diferentes: duas a 120° representadas por um primeiro molar inferior artificial (Ivoclar®, Vivadent) incluído ou não num simulador de ligamento periodontal; uma a 100° (simulando a oclusão dos dentes anteriores) e uma superfície plana (180°) em posições estática e variável. Foram aplicadas no sensor três níveis de força (10N, 50N e 150N), 40 vezes cada, por uma máquina de testes universal (Autograph®, AG‐I) com uma broca esférica (diâmetro=2,2 mm). Uma análise ANOVA com correções de Bonferroni para testes post hoc foi utilizada para comparações múltiplas.
ResultadosDe acordo com nossos resultados: 85% dos outliers estão contidos nos 5 primeiros valores, e representam o tempo de condicionamento do sensor. Diferenças gráficas e estatísticas (p < 0,05) foram encontradas: nos coeficientes de variação entre as mesas (180°‐Variável versus todas as outras.
ConclusõesPode ser observada uma melhoria incontestável do desempenho deste novo sistema em comparação com versões anteriores. No entanto serão necessários mais estudos para verificar alguma variabilidade na sensibilidade que possa existir na superfície do sensor. A reprodutibilidade foi provada, com excepção dos cinco primeiros valores que representam o condicionamento necessário para conformação do sensor à morfologia dentária. No entanto, em nenhum dos casos a morfologia anatómica simulada teve alguma influência nos parâmetros testados.
In 1987, the World Health Organization (WHO) emphasized the importance of reliability in clinical measurements regarding oral health care.1 With this goal, many investigators have been researching the performance of registration materials and methods in an effort to thoroughly understand the patient's occlusion.2–16
In the dental community, articulating paper has been widely accepted as the gold standard for occlusal analysis.17 However, published studies about its physical properties (thickness, composition, ink substrate, plastic deformation) and interactions with the field properties such as wetness, offer no evidence to suggest that variable articulating paper/film mark size can be descriptive of variable occlusal loads.18–29 For this reason and because of its subjective interpretation, paper/film should be carefully used as an occlusal registration material.17,21,30
Apart from articulating paper or films, other methods for occlusal analysis, such as impression materials, photoplastic/elastic wafers, wax bite or shimstock, have been described in literature. None of them proved to be ideal.17,20,30–34 Those materials allow the clinician only to locate occlusal contacts. However, their strength must be extrapolated qualitatively or from the subject's evaluation.35 The need to develop a device, which enabled the clinician to evaluate qualitatively and quantitatively the patient's occlusion, arose.
Technologic advances encouraged the development of the prototype of a computerized occlusal analysis device (T‐Scan®I Tekscan Inc., Boston, USA), first reported by Maness et al.36 in 1987. The T‐Scan® system was designed to analyze and display occlusal contact information gathered by the pressure sensitive film. A study published in 1991, regarding the clinical use of the first T‐Scan® systems, stated that the great advantage of the T‐Scan over silk marking ribbon was that it not only recorded the contact reliably, but also analyzed the timing and force of each contact for the first time in occlusal history.37
However, the first generations of the T‐Scan system, T‐Scan®I and T‐Scan®II, generated some controversy in the dental community regarding their performance.35,37–42
In fact, Hsu et al.39 reported on the sensitivity and reliability of the T‐Scan system. It always recorded fewer contacts than were actually present as checked by occlusal foils. Those non‐sensitive areas described as “black spots” were often reported by other authors in relation to former designs of the T‐Scan® sensor (T‐Scan®I, T‐Scan®II).40,41
As a reaction to the low performance reported by some authors, Tekscan® Inc. developed a new sensor. In 2006, Kerstein et al.43 studied their newest generation, and reported the T‐Scan®III HD to have increased its active recording area by 33%, and decreased inactive recording area by 50% as compared to the previous design. The HD sensor exhibited significantly less variable force reproduction for at least 20 in‐laboratory loading cycles and no existence of “black spots” was described.44 Koos et al.9,45 published two studies emphasizing the HD sensor's reproducibility (95%) and clinical use, as well.
Important requirements for the clinical applicability of a measuring system are that exact values are depicted as precisely as possible and differ only slightly in repeated measurements.1,46–49 And therefore, the main goal of the current study consists in testing the T‐Scan®III HD on its sensitivity and reproducibility under different simulated occlusal circumstances, applying varying force magnitudes.
The objective consists in finding out whether the sensor is in fact suitable for intraoral use, where similar heterogenic anatomic circumstances are present just like those used in this study.
Materials and methodsAs the aim of the present study was to verify the HD sensor's performance using single point loading of the sensor in the same location repeatedly and in multiple single locations, we tried to recreate in laboratory some anatomic circumstances on which the sensor could be tested.
Four different occlusal tables were created as follows: (1) 180° (plane surface) simulated by a cylinder filled up with a self‐curing acrylic (Orthocryl® Dentaurum, Ispringen, Germany). After polymerization the cylinder was cut and polished at exactly the given angle. It was used as a control. (Fig. 1); (2) 100° table, representing the distortion inflicted to the sensor when anterior teeth occlude (Fig. 2); (3) 120° table without PDL‐simulator, representing the typical intercuspal angle of posterior natural unworn teeth. It was simulated by an artificial inferior first molar (Ivoclar® Vivadent, Liechtenstein) included into a cylinder with Orthocryl® (Dentaurum, Ispringen, Germany) (Fig. 3); (4) 120° table with PDL‐simulator, representing the typical intercuspal angle of posterior natural unworn teeth, simulated by an artificial tooth (Ivoclar® Vivadent, Liechtenstein) included into a transparent acrylic (Orthocryl® Dentaurum, Ispringen, Germany) cylinder (Fig. 4).
.")

.")
.")
The model was prepared in two stages. First, the roots of the artificial tooth were covered with melted wax to obtain a homogeneous thickness of PDL‐simulator and embedded into the acrylic block and then left to set. Second, the tooth was removed from the block, the residual wax was cleaned and the impression material, addition‐type silicone50,51 (Affinis® Putty soft, Coltène/Whaledent, Aldstätten, Switzerland), was poured into the alveolus‐shaped crater. The tooth was then returned and pressed into the acrylic block. The excess material which was unrestrained to release from the crater was removed with a scalpel n°11. By this method, the uniformity of PDL‐simulating material around the roots of the tooth was assured.
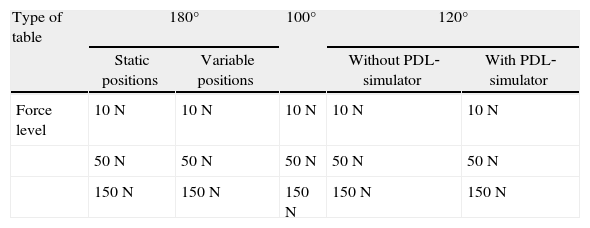
As represented in Table 1, increasing forces (10N, 50N and 150N) were applied to the occlusal tables, 40 times each, with a polished spherical bur (Ø=2.2mm) through a universal testing machine (Autograph®, AG‐I; Shimadzu Co., Kyoto, Japan), as illustrated in Figs. 5–7. Those forces were previously programmed into the machine's own software (Trapezium®X, Shimadzu Co., Kyoto, Japan). The T‐Scan® has several sensitivity levels that can be adjusted to match a range of occlusal strengths (Low 1–3; Default; Mid 1–3; High 1–4). Regarding the range of load magnitudes used, the recording sensitivity for this study was set on Default sensitivity.
.")

.")
According to a study by Koos et al.9 external influences, such as changing the foil, were not found to have any statistically significant influence on the results. Therefore, anytime our measurements depicted far too high data that appeared suddenly, the sensor was changed.
The sensors were purposefully placed in the same position with respect to the bur/table, except for Table 180°‐Variable. Consistent sensor placement would ensure that the same points were loaded at each closure.
Afterwards, we studied the correlation between the magnitudes of the forces measured with the T‐Scan®III HD sensors and the forces actually applied through the machine for the 4 simulated anatomic circumstances. The following points were analyzed:
- •
A graphical interpretation of the RAW‐sum vs. closures for each table.
- •
An analysis of the values’ distribution using boxplots (for the three levels of force) and their coefficients of variation (for each table);
The statistical analysis was performed on Windows® 7 using SPSS® v17.0 (SPSS® Co., Chicago, Illinois) software assuming a level of significance of α=0.05. In order to compare the coefficients of variation and the RAW‐sum means for each case, the variables were tested by an ANOVA statistical analysis. The assumption, that variances of the data from which different samples are drawn were equal, was verified using a Levene's test, after having tested the normal distribution of our values through a Kolmogorov–Smirnov test. Post hoc tests were performed using Bonferroni corrections for multiple comparisons, which is statistically more reliable than the LSD (least significant difference).
ResultsA graphical analysis is achieved through the representation of the values per table, drawing an X‐axis with the number of closures and a Y‐axis with the RAW‐sum values (Figs. 8–12).
, with the RAW‐sum values (Y‐axis) depicted at each of the 40 closures (X‐axis).")
, with the RAW‐sum values (Y‐axis) depicted at each of the 40 closures (X‐axis).")
 depicted at each of the 40 closures (X‐axis).")
 depicted at each of the 40 closures (X‐axis).")
 depicted at each of the 40 closures (X‐axis).")
Graphically, the RAW force varied more widely between closures for Table 180°‐Variable. However, the force data capture illustrates a consistent digital output, in general, with a trend towards a slight increase, as more closures are attempted for the remaining tables. Raw force output appears nearly constant after the early closures (about 5 times) are accomplished (except for the Tables 180°‐Variable and 120° with PDL at 150N).
In order to illustrate the distribution and make a visual comparison of the RAW‐sum measurements obtained between the different simulated tables within a same occlusal load, boxplots at 10N, 50N and 150N respectively were drawn (Figs. 13–15). The distribution is depicted with the median, the lower (25%) and upper (75%) percentile representing a box. Depending on the interquartile distance, 1.5× or 3×, dots respectively asterisks are drawn for the outliers. The numbers associated with the outliers represent the test closure. Since each table was loaded 40 times, the first value per box is always a multiple of 40 plus 1 (example: for Table 100° the first value is 2×40+1=81).


Notice that 40 out of 47 outliers are within the 5 first closures, which represents 85% of all outliers registered. As already noticed graphically, these outliners are often values far below the mean (1.5× or 3× interquartile distance) rather than above.
The coefficient of variation (CV) is defined as the ratio of the standard deviation σ to the μ:

It represents the extent of variability in relation to mean of the data collected and in contrast to the standard deviation and because it is a proportion, its value can be directly compared. The bigger the ratio, the higher is the variability of a set of measurements.
One‐way ANOVA at a significance level of p<0.05: Comparison of the CVs between the loaded tables in Fig. 16: Statistically significant differences (p<0.001) could be found between this table (180°‐Variable) and all the other tables, but not between the remaining tables. The sensor's consistency within and between variable anatomic circumstances could be verified, with exception of table (180°‐Variable) surface.
Discussion. * The mean difference is significant at the level p<0.001 vs. all other groups.")
Testing the new T‐Scan®III HD's sensitivity we did not encounter some of the problems quoted by various authors39–41 in the past as weaknesses of the T‐Scan®I and T‐Scan®II, such as the existence of pressure insensitive points, known as “black spots”. But, according to the statistical analysis of the coefficients of variation (Fig. 16), there is a noteworthy increase in the variation of the RAW‐sum measurements when the sensor's position is altered. This may suggest that the sensor does not have the same sensitivity throughout its surface. However we recognize that an experimental procedure bias might have occurred, since the tension applied to vary the sensor's position may have induced vectors of force that could alter the results. Furthermore, no pre‐conditioning of sensor (a pre‐requisite to ensure good measurements as stated by the manufacturer and verified through our study) could be executed with this method since all areas were newly pressured. Further studies should be conducted for better understanding of this phenomenon.
Nevertheless, we also recognize that a device design limitation exists such that the spatial resolution of the sensor might not be dense enough to prevent this phenomenon. It is therefore probable that when using the sensor intraorally, a tooth contact point on one closure could be on the border of a sensel, and on another closure be located on the inactive recording area. Some tooth contacts may even be small enough to fit between sensels and land completely in the inactive area where they would not be detected. However, this did not occur at any time during our tests using the spherical bur, and has not been reported by any clinical study, suggesting that it may represent an irrelevant clinical problem.
In 2006, Kerstein et al.43 stated that this new high definition sensor design has increased active recording area by 33%, and decreased inactive recording area by 50% as compared to the previous design (G3). This was accomplished by increasing the active sensing element (sensel), placing them much closer together within the recording grid (Fig. 17). Therefore, it is likely that tooth contacts present on the varying cuspal topography could more frequently land on a sensel instead of the inactive space between the sensels. Based on these facts, Kerstein et al.43 suggests that the closer sensel proximity of the HD sensor is better suited than former designs to compensate for the existence of “black spots”, and therefore produces less variable results for at least 20 in‐laboratory loading cycles.44

Some variability, though, exists throughout the sensing surface (Figs. 9 and 16). This is a typical characteristic of electronic sensors since their active recording area can not cover up the whole sensor at 100%, leaving some very small insensitive points scattered all over the recording grid. However, the clinical relevance of this minor insensitive spots could possibly be neglected.
It is therefore of capital importance to assure the sensor's stability during repeated closures in order to obtain comparable data. Variable sensor placement intraorally can be minimized by orienting the sensor support repeatedly between the patient's central incisors prior to recording any occlusal data.
Regarding the system's reliability, boxplots and an ANOVA were employed to determine the variability of force reproduction over multiple closures across the recording area.
First of all, we studied the boxplots and calculated 85% of the outliners (40 out of 47) to be within the 5 first sensor compressions. This phenomenon has already been described by other authors before.43 As the sensor is fabricated flat, according to the manufacturer, each sensor requires a conditioning period of test closures to allow for sensor deformation in and around the tooth anatomy, for assessing the patients’ occlusal strength for proper recording Sensitivity adjustment, and for acclimating the patient to intercuspate well upon the sensor for future recording. When consistently placed under close to ideal laboratory conditions, the variability of the HD sensor data is not affected by repeated closures for at least 36 out of 40 trials and more, when a single contact exists. Moreover, its reproducibility is not significantly affected by the anatomic circumstances.
Statistical significant differences (p<0.001) could be found in the coefficients of variation between the table (180°‐Variable) and all the other tables, but not between the remaining tables, confirming that varying the sensor's position increases significantly the measurements’ dispersion. So, when expecting to obtain reliable data during occlusal examination, we must assure the sensor's stability between the jaws. This guarantees us that always the same area, which has been conditioned before through repeated closures, is loaded. The clinician can assure the sensor's stability by fixing it firmly between the patient's central incisors.
ConclusionsIn general, this newest version of the T‐Scan® system seems to have undergone many improvements as compared to former designs. Independently of the anatomic circumstances, its sensitivity and reproducibility present very satisfactory results.
However, further studies on the varying sensitivity throughout its sensing surface and on its clinical relevance are required.
Its reproducibility could be proved, except for the 5 first values (outliers to the mean values). Therefore, anytime occlusal data are recorded, those closures are used as a conditioning period for the sensor to adapt to the tooth morphology. It also assesses the patients’ occlusal strength for proper recording sensitivity level adjustment, and acclimates the patient to intercuspate well upon the sensor for future recording.
Nevertheless, the practicing clinician's “gold standard” for diagnosing occlusal interferences and prematurities remains a combination of patient self‐report opinion and the occlusal examination.
Ethical disclosuresProtection of human and animal subjectsThe authors declare that no experiments were performed on humans or animals for this study.
Confidentiality of dataThe authors declare that no patient data appear in this article.
Right to privacy and informed consentThe authors declare that no patient data appear in this article.
Conflicts of interestThe authors have no conflicts of interest to declare.