


Musculoskeletal disorders of the locomotive apparatus are common in young people with Down syndrome (DS), especially in the feet. Early diagnosis by examination of podiatric footprints can help prevent orthopaedic symptoms. Our objective was to analyse, measure and classify footprints on the basis of podiatric indices (gold standard) in young people with DS.
MethodCross-sectional study; 86 footprints were analysed from 2 groups; there were 21 healthy subjects, 11 men 20.45 (2.16) years and 10 females 20.00 (1.70) years; and 22 subjects with DS, 11 men 23.82 (3.12) years and 11 females 24.82 (6.81) years. Footprints were recorded in standing position using an optical pedoscope and a digital camera system. We calculated the Hernández-Corvo index, Chippaux-Smirak index, Clarke's angle and Stahelli index. We then compared the results of both samples and analysed the concordance between types of feet and right and left feet by Chi-square test.
ResultsFootprints in individuals with DS showed flatfoot and/or pronated foot of 38.6% according to Hernández-Corvo index; 50%, to Chippaux-Smirak; 70.4%, to Stahelli; and 59.1%, to Clarke's angle. In healthy subjects the rates of cavus foot were 57.1%, according to Hernández-Corvo index; 59.5%, to Chippaux-Smirak index; and 81%, to Stahelli index; while 57.1% showed a normal foot based on Clarke's angle. Differences between the 2 groups were statistically significant (P<.01) in Chippaux-Smirak index, Stahelli index and Clarke's angle. The correlation between the right and left foot was not significant.
ConclusionsYoung people with DS had a higher percentage of pronation and a lower percentage of cavus foot than the control group.
Los trastornos musculoesqueléticos a nivel del pie son frecuentes en las personas con síndrome de Down (SD). Por ello el diagnóstico precoz mediante examen podológico de las huellas plantares puede ayudar a prevenir las manifestaciones ortopédicas. El objetivo es analizar, medir y clasificar la huella plantar mediante los índices podológicos (gold standard) en jóvenes con SD.
MétodoEstudio transversal comparativo; se analizaron 86 huellas plantares correspondientes a 2 grupos: 21 sujetos sin SD, 11 hombres de 20,45 (2,16) años y 10 mujeres de 20 (1,70) años; y 22 sujetos con SD, 11 hombres de 23,82 (3,12) años y 11 mujeres de 24,82 (6,81) años. Se registraron las huellas plantares en bipedestación estática mediante la utilización de un podoscopio óptico y una cámara digital. Los índices analizados son Hernández-Corvo, Chippaux-Smirak, Stahelli y ángulo de Clarke. Se compararon los resultados de ambas muestras y se analizó la concordancia entre los tipos de pies, derecho e izquierdo, mediante la prueba de Chi-cuadrado.
ResultadosLos sujetos con SD se clasifican con pie plano y pronador en un 38,6% según el índice de Hernández-Corvo; Chippaux-Smirak 50%; Stahelli 70,4%; y ángulo de Clarke 59,1%. Los sujetos control presentan pies cavos en un 57,1% según el índice de Hernández-Corvo; Chippaux-Smirak 59,5%; Stahelli 81%; y como pie normal según el ángulo de Clarke en un 57,1%. Hay diferencia significativa (p<0,01) en los índices Chippaux-Smirak, Stahelli y el ángulo de Clarke. La concordancia entre pie derecho e izquierdo no fue significativa.
ConclusiónLos jóvenes con SD presentan más porcentaje de pie plano pronador y menos cavos que el grupo control.
Individuals with Down syndrome (DS) present musculoskeletal disorders. The most common are those of instability of the upper cervical spine: atlantooccipital and atlantoaxial joints and thoracogenic scoliosis. There are also disorders of the lower limbs: at the level of the hips, acetabular dysplasia, displacement of the femoral epiphysis and osteonecrosis or Perthes disease; at the level of the knees, patellar instability; and at the level of the ankles and toes, metatarsus valgus (pigeon toe) and pes planus (flat feet).1–4
The musculoskeletal abnormality most often observed in individuals with DS is that of flat feet. It is considered a congenital orthopaedic problem that affects approximately 70% of people with DS.2,5–8 Other clinical manifestations are the external rotation of hips and tibia, knees in flexion and tendency to valgus, pronated flat feet, hallux valgus malformation and hammertoes.7 Clubfoot can also appear combined with some of these most common orthopaedic alterations, which is characteristic of subjects with DS.9
These orthopaedic manifestations are related and accompanied by muscular hypotonia, ligament laxity and plantar dysfunction.6,10 Individuals with DS have been described anecdotally due to their foot influence as having duck feet and a Chaplin-like walk because of the externally rotated position of the lower limbs.5,7 Foot position involves mechanisms of sensorial and motor integration that guarantee good balance in a standing position and later walking.11 It is also thought that foot position correlates closely with the standing phase.12
Early podiatric diagnosis is essential for detecting the presence of orthopaedic problems of the lower limbs that are so habitual in individuals with DS; for this reason, Concolino et al.13 used a podoscope as a morphostatic examination to analyse footprints. Calculating podiatric indexes from footprints provides information on the surface contact of the instep, midfoot and rearfoot.6
Other authors assess foot arches in healthy youngsters using other measurement tools such as inked paper and the photo-podoscope.14–16 They also take note of the sinking of the inner foot arch to diagnosis flat feet and heel valgus as a frequently seen malformation in paediatric orthopaedics in healthy individuals; they relate it with factors such as the growth in children, foot morphotype and shoe type using the podoscope.17
Podiatric indexes that belong to the gold standard are the following: the Hernández-Corvo Index (HCI), Chippaux-Smirak Index (CSI), Staheli Index (SI) and Clarke Angle (CA). These indices serve to calculate the surface contact of the footprint.18–20 The HCI makes it possible to establish foot type in agreement with the following classification: 0–34% flat foot, 35–39% flat-normal, 40–54% normal, 55–59% normal-cavus, 60–74% cavus, 75–84% high cavus and 85–100% extreme cavus foot. The CSI assesses the occupation of the isthmus. Normal values are 35±10. The upper values establish a tendency to flatness or pronation, while the lower values indicate a tendency towards cavus foot. The SI establishes a relationship between the midfoot and heel. The normal range lies between 0.600 and 0.699. Again, higher figures indicate a tendency towards flatness and pronation, while lower values show a tendency towards the cavus. The CA appraises the inner longitudinal foot arch. The normal range is 38°±7°. Higher values establish the tendency towards cavus foot and lower values, tendency towards flatness and/or pronation. Consequently, these indices measure footprints, classifying them as flat feet, normal or cavus feet. These classifications are made according to the position of the calcaneus, and also according to the relationships between the forefoot, rearfoot and el isthmus.
The objective of this study was to analyse the footprints using the gold standard of the podiatric indices, to measure and classify the footprints typologically, and compare the results of healthy individuals with those of the subjects with DS. The basis for comparison was a digital photograph obtained using an optical podoscope.
Materials and methodsDesignTransversal comparative study where 2 groups of subjects were established, a group with DS and a group without DS, to analyse the means and classify and compare the data analysed.
SampleThe sample consisted of 43 subjects: 21 individuals without DS (the control subjects), 11 males with an age of 20.45 (2.16) years and 10 females with an age of 20 (1.70) years; and 22 people with DS, 11 males with an age of 23.82 (3.12) and 11 females with an age of 24.82 (6.81) years. The control subjects participated voluntarily and were recruited from among Blanquerna Faculty of Health Sciences students, at Universidad Ramón Llull (Barcelona). The subjects with DS were students of the “Escuela de Pedagogía and Terapéutica” (School of Pedagogy and Therapeutics), at the “Jeroni Moragas” occupational workshop in Barcelona. Informed consent and approval of the institutional review board (IRB) were obtained. The subjects in the control group fulfilled the following inclusion criteria: healthy young individuals without antecedents of trauma or surgery of the lower limb joints. Any individuals that presented neuromuscular, vestibular or neurological disease were excluded. Likewise, those having any type of orthopaedic condition and those taking any drugs that affected posture or muscle tone were excluded. For the subjects with DS the criteria de inclusion considered the degree of disability, which had to be of 33–65%, and intellectual coefficient, between 30% and 70%.21,22 These levels are mild and moderate because their learning is slow. Subjects with severe or profound disability (65–85%) and a intellectual coefficient lower than 30% were excluded. Likewise, those that presented neuromuscular, vestibular or neurological disease, or took certain drugs related to additional psychiatric diagnoses were excluded.
Family information was gathered for all subjects, a case history was taken, and a morphostatic musculoskeletal system observation and a study of body composition in relation to fat tissue were performed. Descriptive data for the subjects were noted: age, weight, height and abdominal and hip perimeters. With these variables, the following were calculated: (a) Body mass index (BMI) (kg/m2), whose normal adult value ranges from 19 and 27kg/m2; (b) Bouchard index (kg/m), the ratio of weight to height; (c) weight index (cm/kg), evaluating the somatotype between 38 and 45cm/kg, with a value of 43cm/kg for healthy adults; and (d) the waist-to-hip circumference ratio (WHR=cm), which considers the visceral fat content of an organism and has values between 0.71 and 0.84cm for females and between 0.78 and 0.94cm for males. If there were values greater than these, the case was considered an android profile, while a case with values lower than this was considered a gynecoid profile.23,24
Register using a podoscopeStudying the footprint while standing in balance made use of an optical podoscope (chromed with direct 220 v light, 60×45×33). The apparatus is a glass device with a mirror 45° oblique to the upper surface and light that makes it possible to observed the reflected footprints while standing and lower limbs in parallel.25 The subjects got on the podoscope barefoot trying to maintain correct position for balance and support base. They became used to the apparatus by getting on and off it twice. Their footprints were photographed with a digital camera (Panasonic DMC-FS35), obtaining 86 footprints in JPG format between right and left feet of both groups.
Procedure for measurement and calculation of the indexesThe photographic foot images were used to calculate the podiatric indices HCI, CSI, SI and CA included in the reference “gold standard”.18,19,26 Each footprint was outlined and analysed for measurement and classification.
Analysis of statistical dataWe calculated the means and standard deviation for all the sample descriptive variables. We also calculated the numbers of cases and the percentages for each of the indices to make it possible to classify the foot types according to the results of the podiatric index analysis. Also included were the percentages of concordance between groups of foot types and of both feet, right and left, using Pearson's chi-square test. All statistical tests were performed with the SPSS version 20 programme for Windows (SPSS, Inc, Chicago, IL, USA).
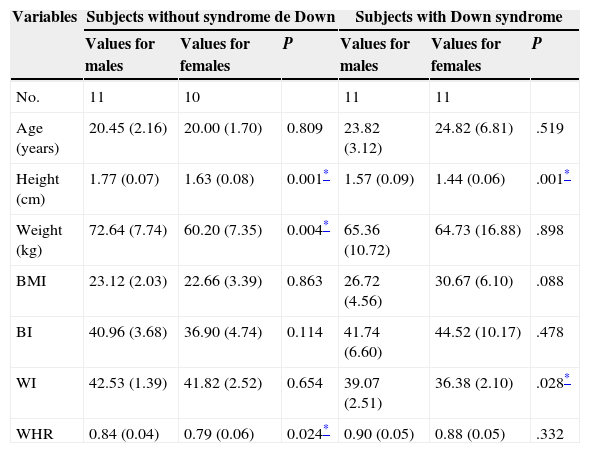
ResultsDescriptive statisticsThe descriptive information about the sample is presented in Table 1.
Sample characteristics.
| Variables | Subjects without syndrome de Down | Subjects with Down syndrome | ||||
|---|---|---|---|---|---|---|
| Values for males | Values for females | P | Values for males | Values for females | P | |
| No. | 11 | 10 | 11 | 11 | ||
| Age (years) | 20.45 (2.16) | 20.00 (1.70) | 0.809 | 23.82 (3.12) | 24.82 (6.81) | .519 |
| Height (cm) | 1.77 (0.07) | 1.63 (0.08) | 0.001* | 1.57 (0.09) | 1.44 (0.06) | .001* |
| Weight (kg) | 72.64 (7.74) | 60.20 (7.35) | 0.004* | 65.36 (10.72) | 64.73 (16.88) | .898 |
| BMI | 23.12 (2.03) | 22.66 (3.39) | 0.863 | 26.72 (4.56) | 30.67 (6.10) | .088 |
| BI | 40.96 (3.68) | 36.90 (4.74) | 0.114 | 41.74 (6.60) | 44.52 (10.17) | .478 |
| WI | 42.53 (1.39) | 41.82 (2.52) | 0.654 | 39.07 (2.51) | 36.38 (2.10) | .028* |
| WHR | 0.84 (0.04) | 0.79 (0.06) | 0.024* | 0.90 (0.05) | 0.88 (0.05) | .332 |
BI: Bouchard Index; BMI: body mass index; SD: standard deviation; WHR: waist-to-hip ratio; WI: weight index.
The data are expressed as mean (SD).
In the group of subjects without DS, statistically significant differences can be seen between sexes, in height (P=.001), weight (P=.004) and WHR (P=.024). In the cohort with DS, there are differences in height (P=.001) and weight index (P=.028).
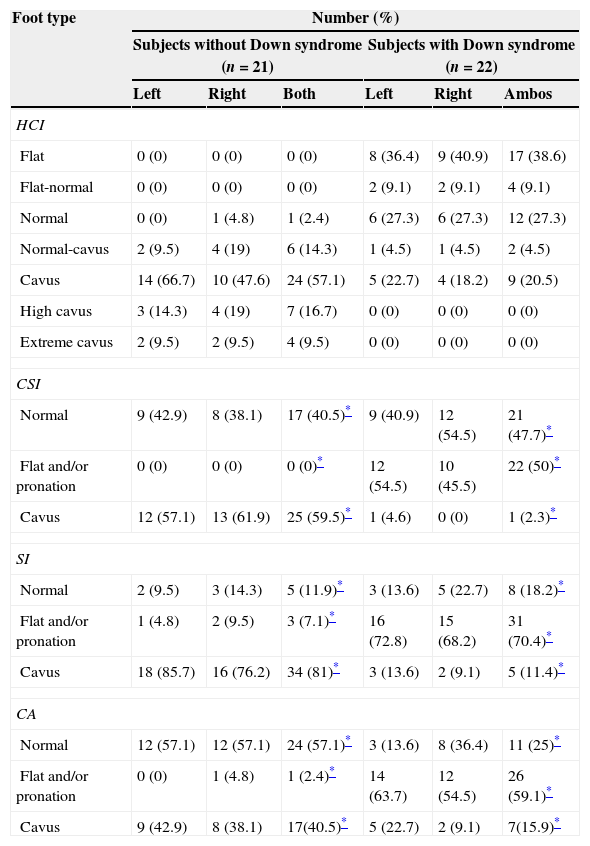
Foot classification according to the podiatric indicesThe Hernández-Corvo Index classifies feet into 7 types (flat, flat-normal, normal, normal-cavus, cavus, high cavus and extreme cavus). The CSI, SI and CA indices classify feet into 3 categories: normal, flat and/or pronation, and cavus. For the control subjects, 42 footprints were analysed; for the subjects with DS, 44. There was a statistically significant difference for the CSI, SI, and CA indices (P<.01). The HCI does not fulfil the conditions of applicability for the chi-square test.
The results of the classification according to the podiatric indices are presented in number of cases and percentages (Table 2).
Classification of foot type based on podiatric indices.
| Foot type | Number (%) | |||||
|---|---|---|---|---|---|---|
| Subjects without Down syndrome (n=21) | Subjects with Down syndrome (n=22) | |||||
| Left | Right | Both | Left | Right | Ambos | |
| HCI | ||||||
| Flat | 0 (0) | 0 (0) | 0 (0) | 8 (36.4) | 9 (40.9) | 17 (38.6) |
| Flat-normal | 0 (0) | 0 (0) | 0 (0) | 2 (9.1) | 2 (9.1) | 4 (9.1) |
| Normal | 0 (0) | 1 (4.8) | 1 (2.4) | 6 (27.3) | 6 (27.3) | 12 (27.3) |
| Normal-cavus | 2 (9.5) | 4 (19) | 6 (14.3) | 1 (4.5) | 1 (4.5) | 2 (4.5) |
| Cavus | 14 (66.7) | 10 (47.6) | 24 (57.1) | 5 (22.7) | 4 (18.2) | 9 (20.5) |
| High cavus | 3 (14.3) | 4 (19) | 7 (16.7) | 0 (0) | 0 (0) | 0 (0) |
| Extreme cavus | 2 (9.5) | 2 (9.5) | 4 (9.5) | 0 (0) | 0 (0) | 0 (0) |
| CSI | ||||||
| Normal | 9 (42.9) | 8 (38.1) | 17 (40.5)* | 9 (40.9) | 12 (54.5) | 21 (47.7)* |
| Flat and/or pronation | 0 (0) | 0 (0) | 0 (0)* | 12 (54.5) | 10 (45.5) | 22 (50)* |
| Cavus | 12 (57.1) | 13 (61.9) | 25 (59.5)* | 1 (4.6) | 0 (0) | 1 (2.3)* |
| SI | ||||||
| Normal | 2 (9.5) | 3 (14.3) | 5 (11.9)* | 3 (13.6) | 5 (22.7) | 8 (18.2)* |
| Flat and/or pronation | 1 (4.8) | 2 (9.5) | 3 (7.1)* | 16 (72.8) | 15 (68.2) | 31 (70.4)* |
| Cavus | 18 (85.7) | 16 (76.2) | 34 (81)* | 3 (13.6) | 2 (9.1) | 5 (11.4)* |
| CA | ||||||
| Normal | 12 (57.1) | 12 (57.1) | 24 (57.1)* | 3 (13.6) | 8 (36.4) | 11 (25)* |
| Flat and/or pronation | 0 (0) | 1 (4.8) | 1 (2.4)* | 14 (63.7) | 12 (54.5) | 26 (59.1)* |
| Cavus | 9 (42.9) | 8 (38.1) | 17(40.5)* | 5 (22.7) | 2 (9.1) | 7(15.9)* |
CA: Clarke Angle; CSI: Chippaux-Smirak Index; HCI: Hernández-Corvo Index; SI: Staheli Index.
According to the HCI, which classifies feet into 7 types, 57.1% of the subjects without DS had a normal-cavus foot, while 38.6% of the subjects with DS had flat feet (Fig. 1).

According to the HCI, which classifies feet into 7 types, 57.1% of the subjects without DS had a cavus foot, while 50% of the subjects with DS had a flat and/or pronated foot (Fig. 2).

Based on the SI, which classifies feet into 3 types, 81% of the subjects without DS had cavus feet; and 70.4% of the subjects with DS had feet that were flat and/or with pronation (Fig. 3).

According to the CA, which classifies feet into 3 types, 57.1% of the healthy subjects had normal feet, while 59.1% of the subjects with DS had a flat and/or pronated foot (Fig. 4).
Analysis of similarities between both feet: right and left
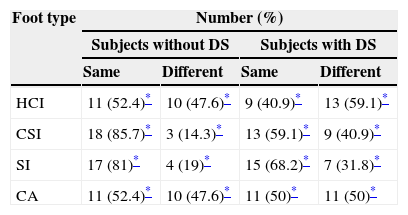
Based on the classification of foot type according to the indices, we compared the agreements and disagreements between the right and left footprints of both study samples (Table 3).
Concordance between the right and left foot according to podiatric indices.
| Foot type | Number (%) | |||
|---|---|---|---|---|
| Subjects without DS | Subjects with DS | |||
| Same | Different | Same | Different | |
| HCI | 11 (52.4)* | 10 (47.6)* | 9 (40.9)* | 13 (59.1)* |
| CSI | 18 (85.7)* | 3 (14.3)* | 13 (59.1)* | 9 (40.9)* |
| SI | 17 (81)* | 4 (19)* | 15 (68.2)* | 7 (31.8)* |
| CA | 11 (52.4)* | 10 (47.6)* | 11 (50)* | 11 (50)* |
CA: Clarke Angle; CSI: Chippaux-Smirak Index; HCI: Hernández-Corvo Index; SI: Staheli Index; DS: Down syndrome.
The chi-square test results for the CSI, SI and CA do not show statistically significant correlation (P<.05).
DiscussionThe population of subjects with DS show results in relation with corporal composition above the limits of normality, in contrast to the control group. We have confirmed statistically significant differences in the group with DS and with regard to sex. In the case of the body mass index, normal values for an adult are considered to lie within 19 and 27kg/m2. Females exceed the values considered normal to a greater extent than males. We established Grade 2 obesity for the females and Grade 1 for the males. For the weight index that assesses somatotype, a normal value is 43cm/kg (range, 38–45cm/kg). In the population with DS, females presented lower figures than males, but both were close to normal values; the statistically significant difference between them is minimal. In contrast, the population of subjects without DS had nearly normal values. Examining the WHR results in the subjects with DS, we can see that they are above the norm. We established that the males presented an android morphotype in which the topographic distribution of abdominal fat predominated, and the females were gynecoid type with tissue in the lower part at the level of hips and gluteal region dominating. The WHR value is influenced by the anthropometric characteristics of the subjects due to the special muscular and skeletal component. These data taken as a whole in the population with DS indicate that these individuals tend towards being overweight, which does not favour them insofar as preventing musculoskeletal misalignments or alterations in support. In contrast, the population of subjects without DS fall within normal limits. These anthropometric results for the 2 groups are important when it comes to evaluating the indices to establish the classification of the flat foot with a valgus rearfoot. Body composition in relation to fat tissue content can modify foot support, encouraging the tendency to pronated flat feet characteristic of the subjects with DS (Table 1).
This study was designed to calculate the percentages and to be able to classify both feet. The subjects with DS presented feet that were flat and/or pronated and the control group presented flat feet based on the HCI, CSI and SI indices. In contrast, the feet were classified as normal according to the CA. It was also revealed that the classification of the right and left feet in both study groups tended to show foot asymmetry (that is, that a single individual can have different feet). There is contradictory information in the literature about the relationship between the foot arch index, flat feet and cavus feet, bearing morphology in mind. The HCI is related to the anterior part of the footprint and reveals which amount of surface is supported on the metatarsals; our results with the subjects with DS showed very similar figures for the right and left foot. In contrast, our control group presented some differences between their feet. The CSI and CA were fairly balanced as to the right and left feet in both groups. Conversely, a we found a slight difference between both feet and both populations in the SI results. The correlation between CSI, SI and CA was statistically significant (Table 2).
In the HCI results, the control group presented a higher percentage of cavus feet, while more flat feet were found in the group with DS. With the CSI and SI, the group without DS showed cavus feet and the group with DS, feet that were flat and/or in pronation. With the CA, the individuals without DS were classified as having normal feet, while the group with DS had flat and/or pronated feet. It was shown that the group without DS were classified as cavus feet and that the group with DS, as flat feet and/or in pronation (Figs. 1–4).
In the control group, based on comparing the typology of their right and left feet, there was greater concordance with the CSI and SI indices; that is, there is greater similarity between their right and left feet. However, less concordance was shown using the HCI and CA. The subjects with DS showed less concordance with the HCI and CA and greater concordance according to the CSI and SI. None of the data were statistically significant (Table 3).
ConclusionAnalysing the data measuring the contact surface of the footprints has made it possible for us to show that, based on the amount of foot arch support, we can classify the foot into a specific foot typology, bearing in mind that each type of podiatric typology connects the anterior, medial and posterior parts of the foot. Comparing both groups reveals high percentages of cavus feet with a substantially increased internal arch; in the population with DS there is a decrease in this arch, presenting a type of pronated flat foot and a rearfoot valgus accompanying a tendency towards muscular weakness and ligament laxity. As for the similarities or differences of the right and left feet, both an individual's feet do not have the same classification.
FundingFellowship: The Ministry of Economy and Competitiveness (Directorate General for Research and Management for the National Plan for Research, Development and Innovation) partially funded this study: Grant DEP2012-38984.
Conflicts of interestThe authors have no conflicts of interest to declare.
We thank the young students of the “Escuela de Pedagogía and Terapéutica”, “Taller ocupacional Jeroni Moragas” in Barcelona, and the university students attending the Blanquerna Health Sciences Faculty that volunteered to participate as study subjects; and the management and staff at both centres.