


To study the correlation between a static PET image of the first-minute-frame (FMF) acquired with 18F-labeled amyloid-binding radiotracers and brain [18F]FDG PET in patients with primary progressive aphasia (PPA).
Material and methodsThe study cohort includes 17 patients diagnosed with PPA with the following distribution: 9 nonfluent variant PPA, 4 logopenic variant PPA, 1 semantic variant PPA, 3 unclassifiable PPA. Regional SUVRs are extracted from FMFs and their corresponding [18F]FDG PET images and Pearson’s correlation coefficients are calculated.
ResultsSUVRs of both images show similar patterns of regional cerebral alterations. Intrapatient correlation analyses result in a mean coefficient of r=0.94±0.06. Regional interpatient correlation coefficients of the study cohort are greater than 0.81. Radiotracer-specific and variant-specific subcohorts show no difference in the similarity between the images.
ConclusionsThe static FMF could be a valid alternative to dynamic early-phase amyloid PET proposed in the literature, and a neurodegeneration biomarker for the diagnosis and classification of PPA in amyloid PET studies.
Estudiar la correlación entre una imagen PET estática del primer minuto (FMF) adquirida con radiotrazadores de amiloide marcados con flúor-18 y la [18F]FDG PET cerebral en pacientes con afasia primaria progresiva (APP).
Material y métodosLa cohorte de estudio incluye 17 pacientes diagnosticados de APP con la siguiente distribución: 9 APP variante no fluente, 4 APP variante logopénica, 1 APP variante semántica, 3 APP inclasificable. Se extraen los SUVR regionales de las FMF y sus correspondientes imágenes [18F]FDG PET y se calculan los coeficientes de correlación de Pearson.
ResultadosLos SUVR de ambas imágenes muestran patrones similares de alteraciones cerebrales regionales. Los análisis de correlación intrapaciente dan como resultado un coeficiente medio de r=0,94±0,06. Los coeficientes de correlación regional entre pacientes de la cohorte de estudio son superiores a 0,81. Las subcohortes específicas de radiotrazadores y variantes no muestran diferencias en la similitud entre las imágenes.
ConclusionesLa FMF estática podría ser una alternativa válida a la PET dinámica de fase temprana de amiloide propuesta en la literatura, y un biomarcador de neurodegeneración para el diagnóstico y la clasificación de la APP en los estudios de PET amiloide.
Primary progressive aphasia (PPA) is a neurological syndrome characterized by the partial or total impairment of language-related functions due to neurodegenerative processes1,2. It is a heterogeneous syndrome, with different neuropathological causes, and the specific speech and language features define the diagnosis and classification into the non-fluent/agrammatic variant (nfvPPA), semantic variant (svPPA), and logopenic variant (lvPPA)3. Regarding the underlying neuropathologies, nfvPPA is most often related to tau-positive or TDP-43-positive frontotemporal lobar degeneration (FTLD), svPPA to FTLD-TDP, and lvPPA is commonly an atypical presentation of Alzheimer’s disease (AD)3,4.
Due to the region-specific alterations of the cerebral metabolism in this syndrome and the underlying neuropathologies, both neurodegeneration image biomarkers ([18F]fluorodeoxyglucose PET, FDG) and imaging biomarkers of the pathophysiological processes (amyloid and tau PET) play an important role in the diagnosis and classification5–8. Regarding the patterns of hypometabolism, nfvPPA has been shown to present frontal alterations, svPPA in the anterior temporal region, and lvPPA in the temporal-parietal region4,5,9–11.
Early-phase amyloid PET images acquired with an amyloid-binding radiotracer like [18F]florbetapir (FBP), [18F]flutemetamol (FMM) or [18F]florbetaben (FBB) have shown their similarity to [18F]FDG PET12–20. Moreover, the dual-phase protocol allows obtaining both information of neurodegeneration and amyloid load, which may also support the differential diagnosis of PPA variants6. While it’s main application has been studied for the diagnosis of AD, the use of early-phase amyloid PET images of patients with frontotemporal dementia (FTD)14 or PPA21 has also been evaluated.
In a previous study, we presented the first-minute-frame (FMF) of amyloid PET, a static perfusion-like image acquired during one minute after the injection of a 18F-labeled amyloid-binding radiotracer22. The similarity to the gold standard in clinical routine practice, [18F]FDG PET, was demonstrated quantitatively showing high correlation coefficients. The advantage of the proposed image is the use of a common time window of the early-phase image with three 18F-labeled amyloid-binding radiotracers, and of a static acquisition protocol, which facilitates the interpretation by nuclear medicine specialists in clinical routine practice. In this study, the comparability of the FMF and [18F]FDG PET is evaluated specifically in a study cohort of patients with PPA.
Material and methodsPatientsThe initial retrospectively selected database consisted of a cohort of patients with available dual-phase amyloid and [18F]FDG PET images acquired between February 2016 and July 2019 in the Department of Nuclear Medicine of the Hospital Universitario 12 de Octubre, Madrid, Spain. Patients without a diagnosis of PPA were excluded. PPA classification was performed prior to [18F]FDG PET imaging according to neuropsychological assessment, structural neuroimaging, and clinical judgement by neurologists and neuropsychologists based on the diagnostic criteria defined by Gorno-Tempini et al.3. Those patients who did not meet the criteria of nfvPPA, lvPPA or svPPA were defined as unclassified (ucPPA).
PET imagingFMF imagingFMFs were acquired using [18F]FBP or [18F]FMM on a Siemens Biograph 6 True Point PET/CT scanner (Siemens Healthcare, Erlangen, Germany). Images were acquired after the intravenous injection of radiotracer doses of 410±13MBq and 193±17MBq, respectively. Static image acquisition with a duration of 1min was performed for a total of 10min immediately post injection (p.i.) and the FMF was recorded. Images were reconstructed using a point spread function (PSF) reconstruction algorithm (3 iterations, 21 subsets, all-pass filter) and they were corrected for attenuation with a low-dose CT scan and scatter and random correction were also performed. The reconstructed images had a matrix size of 168×168 and voxel size of 4.0728×4.0728×5mm3.
[18F]FDG PET imaging[18F]FDG PET scans were acquired on a Siemens Biograph 6 True Point PET/CT scanner (Siemens Healthcare, Erlangen, Germany). A [18F]FDG dose of 275±103MBq was intravenously injected, and PET images were recorded 30−68min p.i. The images were reconstructed with a PSF algorithm (6 iterations, 16 subsets; Gaussian filter: 3mm). A low-dose CT scan was used for attenuation correction and random and scatter correction were performed. The reconstructed images had a matrix size of 336×336 and voxel size of 1.0182×1.0812×3mm3.
Image analysisStatistical Parametric Mapping 12 (SPM12) (Wellcome Centre for Human Neuroimaging, University College London, London United Kingdom)23 was used for the preprocessing of all images. To account for anatomical interpatient differences, the unified segmentation algorithm of SPM12 is employed to spatially normalize the images to the standard space defined by the Montreal Neurological Institute (MNI). The CT images corresponding to either the amyloid PET/CT or [18F]FDG PET/CT acquisition protocols were used as anatomical reference as described by Presotto et al.24. Resulting images have a matrix size of 91×109×91 and voxel size of 2×2×2mm3. Then, a total of 68 cortical and subcortical brain regions are segmented with the Automatic Anatomical Labelling (AAL2) atlas25,26. With 68 of these regions, 8 volumes of interest (VOI) are defined that correspond to the frontal, occipital, parietal and temporal lobes, the anterior and posterior cortices (ACC and PCC, respectively), the precuneus, and the striatum. Regional radiotracer uptake is quantified calculating standardized uptake value ratios (SUVr) using the grey matter part of the cerebellum.
Statistical analysisQuantitative variables are represented as mean±standard deviation (SD). The normality of distributions was studied using the Shapiro–Wilk test. Regional SUVr from FMFs and [18F]FDG images of the study cohort, as well as for radiotracer-specific and PPA variant-specific subcohorts, were compared calculating two-way mixed average measure intraclass correlation coefficients (r) and paired t-tests or Wilcoxon’s signed rank test. Due to the small study cohort of 17 patients, correlations for amyloid state-specific sub-cohorts, and dividing the PPA-specific subcohorts by radiotracer, were not calculated. For group analyses, the single available case with svPPA is grouped with the ucPPA cases as ‘Other PPA’. All statistical analyses are performed in MATLAB R2019a (The MathWorks, Inc., Natick, MA, USA) and SPSS software version 26.00 (IBM Corp., Armonk, NY, USA), and p-values <0.05 are considered statistically significant.
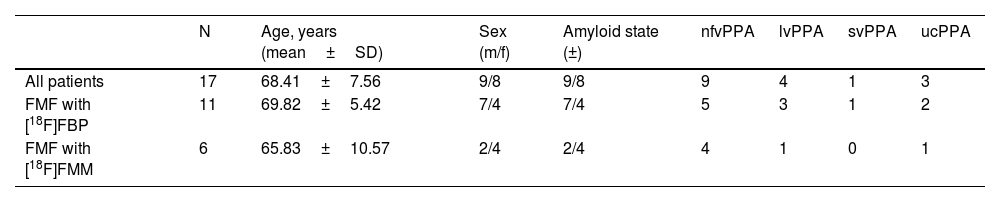
ResultsDemographics and image dataA total of 17 patients (age 68.41±7.56 years, female: 8) with available FMF and [18F]FDG PET scans were included in the retrospective study cohort. Dual-phase amyloid PET imaging was performed 48.72±50.71 days after [18F]FDG PET/CT acquisition. All patients were diagnosed with suspected PPA. The study cohort comprised 9 patients with nfvPPA, 4 with lvPPA, 1 with svPPA and 3 with ucPPA. Amyloid PET positivity by visual analysis was 2/9 (22.22%) for nfvPPA, 4/4 (100%) for lvPPA, 0/1 (0.00%) for svPPA, and 3/3 (100%) for ucPPA. Table 1 summarizes the demographics of the study cohort.
Examples of FMFs and their corresponding [18F]FDG PET images are shown in Fig. 1. Comparing the FMF to the [18F]FDG PET scan, a similar pattern of perfusion/metabolism can be observed in both images, with the same cortical regions showing reduced activity.
![Example of FMFs, its corresponding [18F]FDG PET image, as well as amyloid PET. Top row: 52-year-old female with suspected lvPPA. (A) Axial slices of [18F]FDG PET and fusion with CT, showing asymmetric right parieto-temporal hypometabolism. (B) Axial slices of early first-minute [18F]FMM PET (FMF) and fusion with CT, showing asymmetric right parieto-temporal hypoperfusion with a distribution similar to the corresponding [18F]FDG PET scan. (C) Axial slice of late-phase [18F]FMM PET scan, positive for pathological amyloid deposits in the cerebral cortex. The findings support the diagnosis of lvPPA as a presentation of AD with biomarker support. Bottom row: 65-year-old male with focal onset mild to moderate cognitive impairment of the PPA type. (D) Axial slices of [18F]FDG PET and fusion with CT, showing predominantly left frontal and temporal lobar hypometabolism. (E) Axial slices of early first-minute [18F]FMM PET (FMF) and fusion with CT, showing frontal and temporal hypoperfusion of similar distribution to the [18F]FDG PET scan. (F) Axial slice of late-phase [18F]FMM PET scan, negative for pathological amyloid deposits in the cerebral cortex. The findings support a diagnosis of nfvPPA in the context of FTD with biomarker support.](https://static.elsevier.es/multimedia/22538089/0000004200000004/v1_202307170957/S2253808923000149/v1_202307170957/en/main.assets/gr1.jpeg?xkr=ue/ImdikoIMrsJoerZ+w997EogCnBdOOD93cPFbanNdV4B9vwZQjgKcZv3MP4CdsNwQlWjMJVGmnQkWYSILi5IRc4+iL8ZMUnY8gaseYuVXgVavzI461/ocLuOS9R6BleYDG2As1tvr1wDu7L3DlJx33EM9qFset8TOaxzCm/NbflcV73JvJ9qC98OeibM6uoDgkxGOnX5tYCI8jAtezElBoiyBS4smzqmFExEv7+4qmy1tXoA7uSoGiA9eZkafwfle0NK3Zbp8m4qLOBd96bHB80kc1rbqBObjSdXQHq90EdA+susDB/6uFiFxmSQa1 "Example of FMFs, its corresponding [18F]FDG PET image, as well as amyloid PET. Top row: 52-year-old female with suspected lvPPA. (A) Axial slices of [18F]FDG PET and fusion with CT, showing asymmetric right parieto-temporal hypometabolism. (B) Axial slices of early first-minute [18F]FMM PET (FMF) and fusion with CT, showing asymmetric right parieto-temporal hypoperfusion with a distribution similar to the corresponding [18F]FDG PET scan. (C) Axial slice of late-phase [18F]FMM PET scan, positive for pathological amyloid deposits in the cerebral cortex. The findings support the diagnosis of lvPPA as a presentation of AD with biomarker support. Bottom row: 65-year-old male with focal onset mild to moderate cognitive impairment of the PPA type. (D) Axial slices of [18F]FDG PET and fusion with CT, showing predominantly left frontal and temporal lobar hypometabolism. (E) Axial slices of early first-minute [18F]FMM PET (FMF) and fusion with CT, showing frontal and temporal hypoperfusion of similar distribution to the [18F]FDG PET scan. (F) Axial slice of late-phase [18F]FMM PET scan, negative for pathological amyloid deposits in the cerebral cortex. The findings support a diagnosis of nfvPPA in the context of FTD with biomarker support.")
Example of FMFs, its corresponding [18F]FDG PET image, as well as amyloid PET. Top row: 52-year-old female with suspected lvPPA. (A) Axial slices of [18F]FDG PET and fusion with CT, showing asymmetric right parieto-temporal hypometabolism. (B) Axial slices of early first-minute [18F]FMM PET (FMF) and fusion with CT, showing asymmetric right parieto-temporal hypoperfusion with a distribution similar to the corresponding [18F]FDG PET scan. (C) Axial slice of late-phase [18F]FMM PET scan, positive for pathological amyloid deposits in the cerebral cortex. The findings support the diagnosis of lvPPA as a presentation of AD with biomarker support. Bottom row: 65-year-old male with focal onset mild to moderate cognitive impairment of the PPA type. (D) Axial slices of [18F]FDG PET and fusion with CT, showing predominantly left frontal and temporal lobar hypometabolism. (E) Axial slices of early first-minute [18F]FMM PET (FMF) and fusion with CT, showing frontal and temporal hypoperfusion of similar distribution to the [18F]FDG PET scan. (F) Axial slice of late-phase [18F]FMM PET scan, negative for pathological amyloid deposits in the cerebral cortex. The findings support a diagnosis of nfvPPA in the context of FTD with biomarker support.
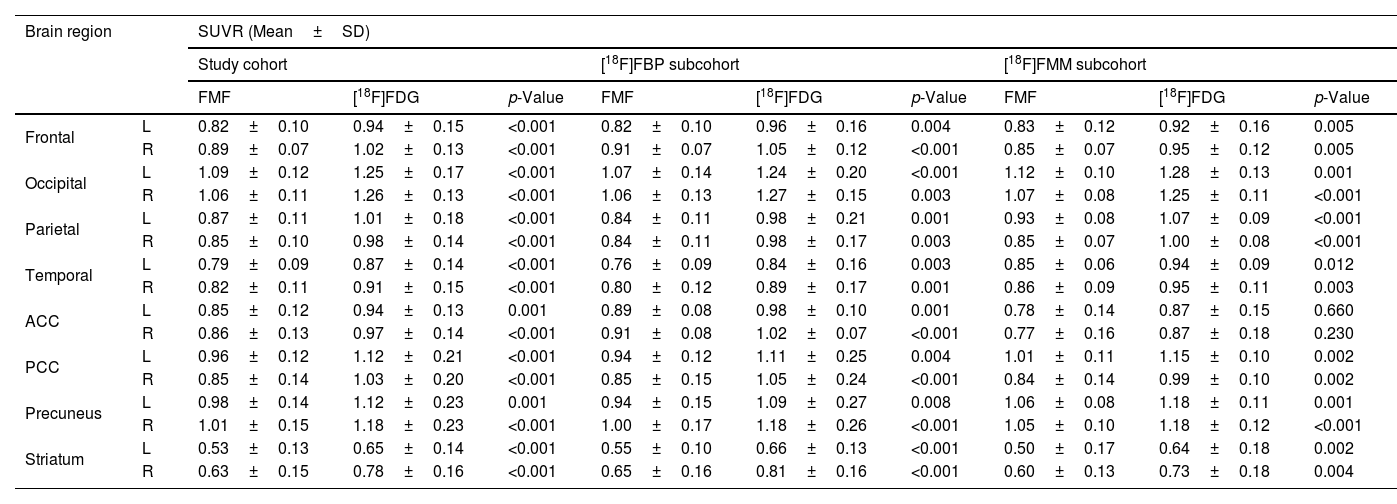
Regional SUVRs of FMFs and their corresponding [18F]FDG PET images are summarized in Table 2. Higher regional SUVRs can be observed in the [18F]FDG PET images but the trends of regional low/high remain the same in both images. Overall, the lowest values in all radiotracer-specific subcohorts can be seen in the striatum, and the lowest cortical values in the temporal region. On the other hand, due to the visual activity of the patient during image acquisition, the occipital region shows the highest SUVRs.
Regional SUVRs of FMFs and [18F]FDG PET grouped by FMF radiotracer.
| Brain region | SUVR (Mean±SD) | |||||||||
|---|---|---|---|---|---|---|---|---|---|---|
| Study cohort | [18F]FBP subcohort | [18F]FMM subcohort | ||||||||
| FMF | [18F]FDG | p-Value | FMF | [18F]FDG | p-Value | FMF | [18F]FDG | p-Value | ||
| Frontal | L | 0.82±0.10 | 0.94±0.15 | <0.001 | 0.82±0.10 | 0.96±0.16 | 0.004 | 0.83±0.12 | 0.92±0.16 | 0.005 |
| R | 0.89±0.07 | 1.02±0.13 | <0.001 | 0.91±0.07 | 1.05±0.12 | <0.001 | 0.85±0.07 | 0.95±0.12 | 0.005 | |
| Occipital | L | 1.09±0.12 | 1.25±0.17 | <0.001 | 1.07±0.14 | 1.24±0.20 | <0.001 | 1.12±0.10 | 1.28±0.13 | 0.001 |
| R | 1.06±0.11 | 1.26±0.13 | <0.001 | 1.06±0.13 | 1.27±0.15 | 0.003 | 1.07±0.08 | 1.25±0.11 | <0.001 | |
| Parietal | L | 0.87±0.11 | 1.01±0.18 | <0.001 | 0.84±0.11 | 0.98±0.21 | 0.001 | 0.93±0.08 | 1.07±0.09 | <0.001 |
| R | 0.85±0.10 | 0.98±0.14 | <0.001 | 0.84±0.11 | 0.98±0.17 | 0.003 | 0.85±0.07 | 1.00±0.08 | <0.001 | |
| Temporal | L | 0.79±0.09 | 0.87±0.14 | <0.001 | 0.76±0.09 | 0.84±0.16 | 0.003 | 0.85±0.06 | 0.94±0.09 | 0.012 |
| R | 0.82±0.11 | 0.91±0.15 | <0.001 | 0.80±0.12 | 0.89±0.17 | 0.001 | 0.86±0.09 | 0.95±0.11 | 0.003 | |
| ACC | L | 0.85±0.12 | 0.94±0.13 | 0.001 | 0.89±0.08 | 0.98±0.10 | 0.001 | 0.78±0.14 | 0.87±0.15 | 0.660 |
| R | 0.86±0.13 | 0.97±0.14 | <0.001 | 0.91±0.08 | 1.02±0.07 | <0.001 | 0.77±0.16 | 0.87±0.18 | 0.230 | |
| PCC | L | 0.96±0.12 | 1.12±0.21 | <0.001 | 0.94±0.12 | 1.11±0.25 | 0.004 | 1.01±0.11 | 1.15±0.10 | 0.002 |
| R | 0.85±0.14 | 1.03±0.20 | <0.001 | 0.85±0.15 | 1.05±0.24 | <0.001 | 0.84±0.14 | 0.99±0.10 | 0.002 | |
| Precuneus | L | 0.98±0.14 | 1.12±0.23 | 0.001 | 0.94±0.15 | 1.09±0.27 | 0.008 | 1.06±0.08 | 1.18±0.11 | 0.001 |
| R | 1.01±0.15 | 1.18±0.23 | <0.001 | 1.00±0.17 | 1.18±0.26 | <0.001 | 1.05±0.10 | 1.18±0.12 | <0.001 | |
| Striatum | L | 0.53±0.13 | 0.65±0.14 | <0.001 | 0.55±0.10 | 0.66±0.13 | <0.001 | 0.50±0.17 | 0.64±0.18 | 0.002 |
| R | 0.63±0.15 | 0.78±0.16 | <0.001 | 0.65±0.16 | 0.81±0.16 | <0.001 | 0.60±0.13 | 0.73±0.18 | 0.004 | |
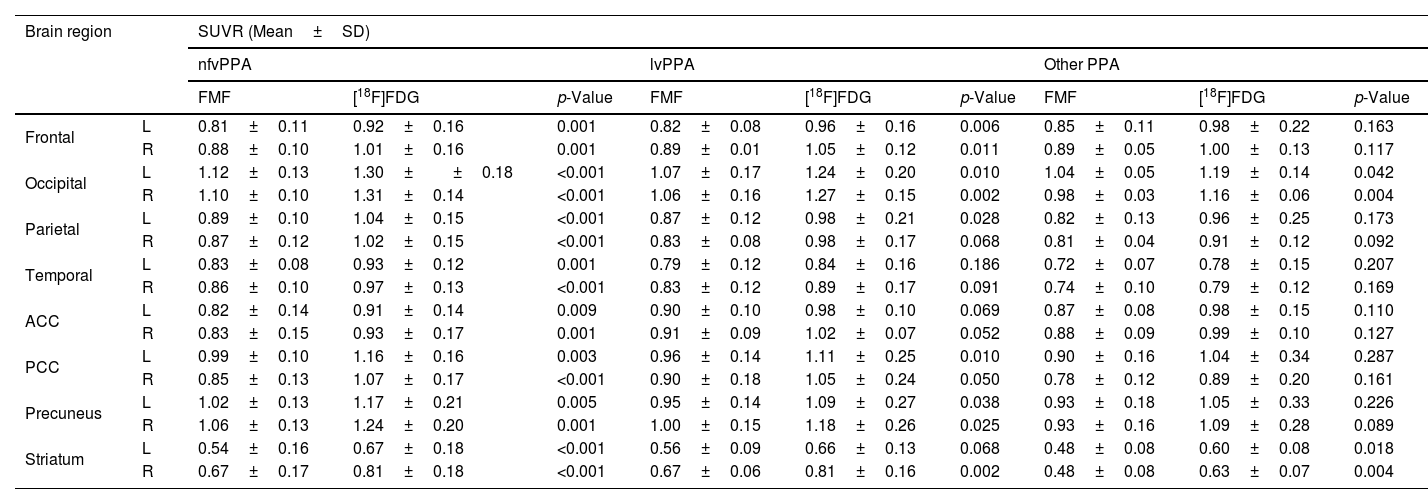
Table 3 shows the regional SUVRs for variant-specific subcohorts. Again, FMFs and [18F]FDG PET show similar regional SUVRs but are overall slightly higher in the second image. Reduced temporal metabolism can be observed in all groups. Additionally, SUVRs are more reduced in the ACC in the nfvPPA group than in the other two.
Regional SUVRs of FMFs and [18F]FDG PET grouped by PPA variant.
| Brain region | SUVR (Mean±SD) | |||||||||
|---|---|---|---|---|---|---|---|---|---|---|
| nfvPPA | lvPPA | Other PPA | ||||||||
| FMF | [18F]FDG | p-Value | FMF | [18F]FDG | p-Value | FMF | [18F]FDG | p-Value | ||
| Frontal | L | 0.81±0.11 | 0.92±0.16 | 0.001 | 0.82±0.08 | 0.96±0.16 | 0.006 | 0.85±0.11 | 0.98±0.22 | 0.163 |
| R | 0.88±0.10 | 1.01±0.16 | 0.001 | 0.89±0.01 | 1.05±0.12 | 0.011 | 0.89±0.05 | 1.00±0.13 | 0.117 | |
| Occipital | L | 1.12±0.13 | 1.30±±0.18 | <0.001 | 1.07±0.17 | 1.24±0.20 | 0.010 | 1.04±0.05 | 1.19±0.14 | 0.042 |
| R | 1.10±0.10 | 1.31±0.14 | <0.001 | 1.06±0.16 | 1.27±0.15 | 0.002 | 0.98±0.03 | 1.16±0.06 | 0.004 | |
| Parietal | L | 0.89±0.10 | 1.04±0.15 | <0.001 | 0.87±0.12 | 0.98±0.21 | 0.028 | 0.82±0.13 | 0.96±0.25 | 0.173 |
| R | 0.87±0.12 | 1.02±0.15 | <0.001 | 0.83±0.08 | 0.98±0.17 | 0.068 | 0.81±0.04 | 0.91±0.12 | 0.092 | |
| Temporal | L | 0.83±0.08 | 0.93±0.12 | 0.001 | 0.79±0.12 | 0.84±0.16 | 0.186 | 0.72±0.07 | 0.78±0.15 | 0.207 |
| R | 0.86±0.10 | 0.97±0.13 | <0.001 | 0.83±0.12 | 0.89±0.17 | 0.091 | 0.74±0.10 | 0.79±0.12 | 0.169 | |
| ACC | L | 0.82±0.14 | 0.91±0.14 | 0.009 | 0.90±0.10 | 0.98±0.10 | 0.069 | 0.87±0.08 | 0.98±0.15 | 0.110 |
| R | 0.83±0.15 | 0.93±0.17 | 0.001 | 0.91±0.09 | 1.02±0.07 | 0.052 | 0.88±0.09 | 0.99±0.10 | 0.127 | |
| PCC | L | 0.99±0.10 | 1.16±0.16 | 0.003 | 0.96±0.14 | 1.11±0.25 | 0.010 | 0.90±0.16 | 1.04±0.34 | 0.287 |
| R | 0.85±0.13 | 1.07±0.17 | <0.001 | 0.90±0.18 | 1.05±0.24 | 0.050 | 0.78±0.12 | 0.89±0.20 | 0.161 | |
| Precuneus | L | 1.02±0.13 | 1.17±0.21 | 0.005 | 0.95±0.14 | 1.09±0.27 | 0.038 | 0.93±0.18 | 1.05±0.33 | 0.226 |
| R | 1.06±0.13 | 1.24±0.20 | 0.001 | 1.00±0.15 | 1.18±0.26 | 0.025 | 0.93±0.16 | 1.09±0.28 | 0.089 | |
| Striatum | L | 0.54±0.16 | 0.67±0.18 | <0.001 | 0.56±0.09 | 0.66±0.13 | 0.068 | 0.48±0.08 | 0.60±0.08 | 0.018 |
| R | 0.67±0.17 | 0.81±0.18 | <0.001 | 0.67±0.06 | 0.81±0.16 | 0.002 | 0.48±0.08 | 0.63±0.07 | 0.004 | |
First, the intrapatient correlations between regional SUVRs of FMFs and their corresponding [18F]FDG PET images is obtained, resulting in a mean correlation of r=0.95±0.04. When dividing by radiotracer, the mean intrapatient correlation coefficients are r=0.94±0.05 and r=0.97±0.02 for [18F]FBP and [18F]FMM, respectively. Regarding variant-specific subgroups, the mean intrapatient correlations are r=±0.03 (nfvPPA), r=0.93±0.07 (lvPPA), and r=0.97±0.02 (Other PPA).
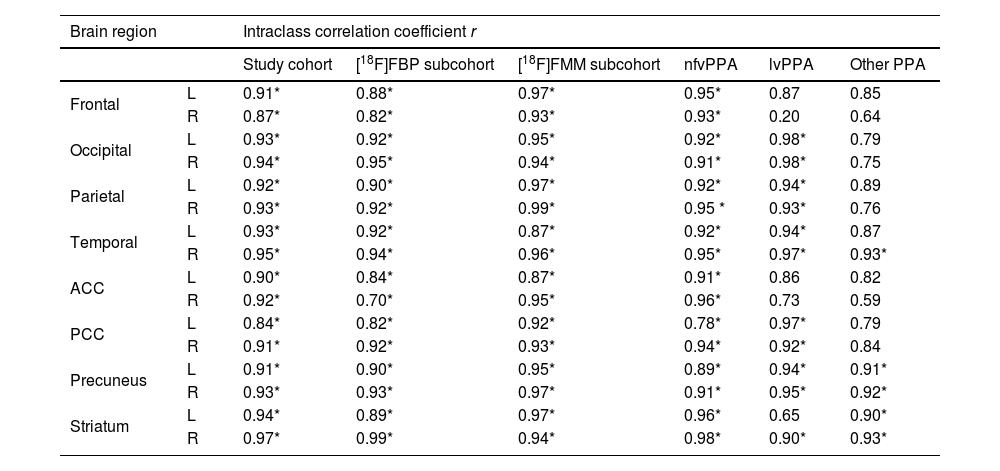
Regional interpatient correlation coefficients between SUVRs of FMFs and their corresponding [18F]FDG PET images are summarised in Table 4. Strong significant positive correlations >0.84 are obtained in all regions for the study cohort. The same occurs for the radiotracer-specific subcohorts. When dividing by PPA variant, the overall best results are obtained in the nfvPPA subcohort. However, strong positive correlations, albeit not always statistically significant, can also be seen in the other two PPA variant-specific subcohorts. Representative correlation charts of the frontal, parietal, and temporal regions for the whole study cohort are shown in Fig. 2.
Regional interpatient correlation coefficients of FMF and [18F]FDG PET. *Statistically significant p-value.
| Brain region | Intraclass correlation coefficient r | ||||||
|---|---|---|---|---|---|---|---|
| Study cohort | [18F]FBP subcohort | [18F]FMM subcohort | nfvPPA | lvPPA | Other PPA | ||
| Frontal | L | 0.91* | 0.88* | 0.97* | 0.95* | 0.87 | 0.85 |
| R | 0.87* | 0.82* | 0.93* | 0.93* | 0.20 | 0.64 | |
| Occipital | L | 0.93* | 0.92* | 0.95* | 0.92* | 0.98* | 0.79 |
| R | 0.94* | 0.95* | 0.94* | 0.91* | 0.98* | 0.75 | |
| Parietal | L | 0.92* | 0.90* | 0.97* | 0.92* | 0.94* | 0.89 |
| R | 0.93* | 0.92* | 0.99* | 0.95 * | 0.93* | 0.76 | |
| Temporal | L | 0.93* | 0.92* | 0.87* | 0.92* | 0.94* | 0.87 |
| R | 0.95* | 0.94* | 0.96* | 0.95* | 0.97* | 0.93* | |
| ACC | L | 0.90* | 0.84* | 0.87* | 0.91* | 0.86 | 0.82 |
| R | 0.92* | 0.70* | 0.95* | 0.96* | 0.73 | 0.59 | |
| PCC | L | 0.84* | 0.82* | 0.92* | 0.78* | 0.97* | 0.79 |
| R | 0.91* | 0.92* | 0.93* | 0.94* | 0.92* | 0.84 | |
| Precuneus | L | 0.91* | 0.90* | 0.95* | 0.89* | 0.94* | 0.91* |
| R | 0.93* | 0.93* | 0.97* | 0.91* | 0.95* | 0.92* | |
| Striatum | L | 0.94* | 0.89* | 0.97* | 0.96* | 0.65 | 0.90* |
| R | 0.97* | 0.99* | 0.94* | 0.98* | 0.90* | 0.93* | |
![Correlation charts with least squares line of the SUVRs of FMFs and [18F]FDG PET of the frontal (a: left; b: right), parietal (c: left; d: right), and temporal region (e: left; f: right) of patients with primary progressive aphasia.](https://static.elsevier.es/multimedia/22538089/0000004200000004/v1_202307170957/S2253808923000149/v1_202307170957/en/main.assets/gr2.jpeg?xkr=ue/ImdikoIMrsJoerZ+w997EogCnBdOOD93cPFbanNdV4B9vwZQjgKcZv3MP4CdsNwQlWjMJVGmnQkWYSILi5IRc4+iL8ZMUnY8gaseYuVXgVavzI461/ocLuOS9R6BleYDG2As1tvr1wDu7L3DlJx33EM9qFset8TOaxzCm/NbflcV73JvJ9qC98OeibM6uoDgkxGOnX5tYCI8jAtezElBoiyBS4smzqmFExEv7+4qmy1tXoA7uSoGiA9eZkafwfle0NK3Zbp8m4qLOBd96bHB80kc1rbqBObjSdXQHq90EdA+susDB/6uFiFxmSQa1 "Correlation charts with least squares line of the SUVRs of FMFs and [18F]FDG PET of the frontal (a: left; b: right), parietal (c: left; d: right), and temporal region (e: left; f: right) of patients with primary progressive aphasia.")
The FMF is a simple-to-acquire perfusion-like image that allows obtaining information about neurodegeneration and Aβ deposition (with the late-phase Aβ PET image) in the same session. In this study, the similarity of the FMF to the clinical gold standard for neurodegeneration [18F]FDG PET is evaluated in a cohort of patients with PPA. In previous studies, early-phase amyloid PET images were acquired during multiple minutes, having to select radiotracer-specific time windows either during acquisition or when reconstructing dynamic data acquired in list mode12,19. The FMF, in contrast, is an alternative that is more widely available and with a common time window for the three 18F-labeled amyloid-binding PET radiotracers.
As seen in the SUVR analyses, [18F]FDG PET images present overall higher values than FMFs, but the offset is consistent and statistically significant across all regions. This same pattern is seen in previous
studies evaluating early-phase amyloid PET images acquired with [18F]FBP12–15 and [18F]FBB19,20. Moreover, regional SUVR alterations are also consistent within subcohorts. When dividing by PPA variant, SUVRs also follow patterns which are consistent with those described in the literature3–5,9. However, no statistically significant differences were found between the ‘nfPPA’ and ‘lvPPA’ groups (the ‘Other PPA’ group was excluded in this analysis due to its heterogeneous composition).
Regarding correlation analyses, intrapatient analyses show very high r values. These are also comparable or higher than the within-subject correlation coefficients obtained by Hsiao et al.12 and Asghar et al.14, both using [18F]FBP and time windows of 0–2 and 2−5min, respectively. The similarity between the images as shown by the intrapatient analyses is also independent of the used radiotracer and the variant of the PPA where strong correlations are obtained.
Regional interpatient correlation coefficients are slightly lower than intrapatient values, while still being strong among the regions in the study cohort (r=0.92±0.03). With some exceptions, regional interpatient correlation coefficients are similarly high in both radiotracer-specific and variant-specific subcohorts. The lowest regional correlation coefficients are obtained in the right frontal region (r=0.20, ‘lvPPA’ subcohort) and the ACC (r=0.59, r=0.70 or r=0.73 in the ‘Other PPA’, [18F]FBP, ‘lvPPA’ subcohorts, respectively), which, while not usually affected in AD but being a relatively small region, may be considered altered by artifacts due to patient movement during the acquisition. In addition, it has been shown to present reduced metabolism in [18F]FDG PET and be affected by atrophy27–29. While still strong, some regional correlation coefficients are also statistically non-significant, which may be explained by the low number of patients once the study cohort is divided by PPA variant. In comparison to previous studies, regional correlation coefficients are comparable or higher12,13,15–20, even though the investigated study cohorts did not focus on patients with PPA in these cases. For example, in early-phase [18F]FBP PET, Hsiao et al.12 obtained r values between r=0.41 (orbital frontal region) and r=0.93 (superior temporal region) for a time window of 0−2min. Similarly, correlation coefficients reported by Myoraku et al.15 range between 0.61 and 0.94. Using [18F]FMM for the early acquisitions (0−10min), Schmitt et al.16 obtained correlations to [18F]FDG PET in cortical regions between r=0.76 and r=0.924. Boccalini et al.17 also showed high correlation coefficients (r>0.72) independently of the amyloid PET radiotracer using [18F]FBP and [18F]FMM. In the case of early-phase [18F]FBB, Daerr et al.19 obtained r values between 0.59 (left frontal and right sensorimotor regions) and 0.86 (right PCC) using a time window of 0–5min. In this study, FMFs were not acquired with [18F]FBB but regional correlation coefficients in the study group are generally higher and range between r=0.84 (left PCC) and r=0.97 (right striatum).
In addition to the perfusion-like image of the FMF, this protocol allows acquiring the standard late-phase amyloid PET image of the patient. In the case of PPA, it has been shown that amyloid positivity can help in the classification and identification of the underlying neuropathology. In a systematic review by Villarejo-Galende et al.6, the authors found that amyloid positivity was most commonly related to lvPPA (84.9%), while patients with nfPPA or svPPA rarely exhibited increased amyloid load. In the same way, Bergeron et al.7 found a prevalence of amyloid positivity in 86% of cases with lvPPA and only in 20% and 16% for nfvPPA and svPPA, respectively. In the present study group, this distribution can also be observed, where 100% of the lvPPA and ucPPA patients are amyloid positive, while the rest is mainly amyloid negative. The combination of cerebral perfusion and amyloid imaging in one acquisition protocol can therefore improve the diagnosis. Thus, while a positive amyloid PET scan does not imply a diagnosis of AD, in combination with a parieto-temporal hyperperfusion pattern in the FMF it may support a diagnosis of probable AD of patients with lvPPA or svPPA. In the same way, a negative amyloid scan in combination with a frontal hypoperfusion pattern in the case of a patient with nfvPPA may support a diagnosis of FTD. This has also previously been shown by Kuo et al.21 where the combination of early and late-phase amyloid PET was able to differentiate healthy controls, AD, and PPA patients.
In this study, one of the main limitations is the reduced study cohort for comparing the two images, while it is in line with previous studies of PPA exclusive cohorts4,6,21. Moreover, only 1 patient was diagnosed with svPPA and for group analyses is grouped with ucPPA patients. In this study, no FMFs were acquired with [18F]FBB and no healthy control group was available but should be included in future studies with larger sample sizes. Additionally, the visual comparability between FMF and [18F]FDG PET will be analysed in future studies. Finally, while changes to the cerebral metabolism/perfusion due to neurodegenerative diseases are slow (years), the time difference in the acquisition of FMFs and [18F]FDG PET images is not equal in all cases (up to 166 days) and might reduce the correlations slightly.
ConclusionsIn this study we demonstrated the comparability of the FMF to [18F]FDG PET in a study cohort of patients diagnosed with different variants of PPA. Quantitative measures and correlation analyses reveal the usefulness of the FMF that this static image of the first minute independently of the amyloid radiotracer is a viable alternative to dynamic early-phase amyloid PET and [18F]FDG PET imaging. In combination with amyloid PET imaging at the same time it could be an imaging biomarker for the diagnosis and classification of PPA.
FundingThis research did not receive any specific grant from funding agencies in the public, commercial, or not-for-profit sectors.
Conflict of interestThe authors declare they have no conflict of interest.
Ethical approvalThe study complies with the principles of the Helsinki Declaration and was approved by the hospital Ethics and Investigation Committee.
Informed consentWritten informed consent was obtained before image acquisition from the patients.
