


MicroRNAs (miRNAs) are non-coding RNAs that regulate gene expression post-transcriptionally. Accumulating evidence indicates that the miR-30 family takes part in the development of multiple tissues and organs, and is a potential contributor to various diseases, including autoimmune disorders such as systemic lupus erythematosus (SLE). The aim of this study was to evaluate the expression of miR-30e-5p, a member of the miR-30 family, and investigate its potential relationship to clinical characteristics and possible disease activity in an Egyptian SLE cohort.
MethodsSerum samples from 40 SLE patients and 37 age and gender matched healthy subjects were tested for miR-30e-5p expression level using the Taqman quantitative reverse transcription-polymerase chain reaction. Analysis was performed using the 2−ΔΔCT method.
ResultsThe mean age of the patients was 28.7±7.9 years, with a mean disease duration of 6.4±5.3 years. The median fold change in serum miR-30e-5p among our SLE cohort was significantly higher 1.748 (0.223–20.485) compared to the control group 0.877 (0.058–3.522) (P=0.02). Receiver operating characteristic curve analysis revealed that miR-30e-5p expression level can discriminate SLE patients from controls at a cut-off value ≥1.06 with the area under the curve (AUC)=0.676 (95% CI: 0.559–0.794, P=0.02), with 64.3% sensitivity and 61.5% specificity. There was no correlation between any of the demographic features, clinical manifestations (apart from serositis, P=0.013) or disease activity and miR-30e-5p levels.
ConclusionOur study demonstrated elevated miR-30e-5p expression levels in serum samples of SLE patients. Apart from serositis, it was not associated with any other disease characteristics.
Los microARN (miRNA) son ARN no codificantes que regulan la expresión de los genes después de la transcripción. Las pruebas acumuladas indican que la familia de miR-30 participa en el desarrollo de múltiples tejidos y órganos, y es un posible contribuyente a diversas enfermedades, incluidos los trastornos autoinmunes como el lupus eritematoso sistémico (LES). El objetivo de este estudio fue evaluar la expresión del miR-30e-5p, un miembro de la familia miR-30, e investigar su posible relación con las características clínicas y la posible actividad de la enfermedad en una cohorte egipcia de LES.
MétodosSe analizaron muestras de suero de 40 pacientes con LES y 37 sujetos sanos de edad y sexo similares para determinar el nivel de expresión de miR-30e-5p, utilizando la reacción en cadena de la polimerasa de transcripción inversa cuantitativa Taqman. El análisis se llevó a cabo empleando el método 2-ΔΔCT.
Los resultadosLa edad media de los pacientes fue de 28,7±7,9 años, mientras que la duración media de la enfermedad fue de 6,4±5,3 años. La mediana del cambio de pliegue del suero miR-30e-5p entre nuestra cohorte de LES fue significativamente mayor, 1,748 (0,223-20,485), en comparación con el grupo de control, 0,877 (0,058-3,522) (p=0,02). El análisis de la curva característica de funcionamiento del receptor reveló que el nivel de expresión del miR-30e-5p, puede discriminar a los pacientes con LES de los controles en un valor de corte ≥1,06, con el área bajo la curva (AUC)=0,676 (IC del 95%: 0,559-0,794; p=0,02), una sensibilidad del 64,3% y una especificidad del 61,5%. No hubo asociación entre ninguna de las características demográficas, manifestaciones clínicas (aparte de la serositis, p=0,013) o actividad de la enfermedad y los niveles de miR-30e-5p.
ConclusiónNuestro estudio demostró niveles elevados de expresión de miR-30e-5p en muestras de suero de pacientes con LES. Aparte de la serositis, no se asoció con ninguna otra característica de la enfermedad.
Systemic lupus erythematosus (SLE) is an obscure autoimmune disease characterized by its multisystem affection,1,2 with several factors including genetic determinants contributing to the disease development.2 Epigenetic changes such as DNA methylation, histone modifications, and noncoding RNAs play an important role in lupus pathogenesis.3 SLE patients have distinct miRNA signatures in peripheral blood mononuclear cells (PBMCs), plasma and different tissues compared to healthy individuals. MiRNAs’ dysregulation in SLE is associated with disease activity, organ system involvement, and autoantibody profiles,4,5 hence miRNAs are considered as potential diagnostic and prognostic disease biomarkers. Among the investigated miRNAs in SLE is the miR-30e member of the miR-30 family.6 The miR-30 family consists of six mature miRNA molecules (miR-30a, -30b, -30c-1, -30c-2, -30d, -30e). The encoding genes are located on chromosomes 1, 6, and 8. The seed sequence located near the 5′end is shared by these miRNAs but they have different compensatory sequences located near the 3′end. This enables miR-30 family members to target different genes and pathways.7 Previous studies have revealed that the miRNA-30 family has an important regulatory role in cell differentiation, cellular senescence and apoptosis,8–15 and are linked to several nervous, circulatory, gastrointestinal and respiratory disorders.16–19 Moreover, the miR-30 family is involved in immune system aberrations including tumorigenesis,16,20–23 and inflammatory disorders as Familial Mediterranean Fever (FMF).24 MiR-30e in particular is a multifunctional miRNA25 with reports linking it to cancers,26,27 and autoimmune diseases.6,28–30 Interestingly, the mature products from both arms of the miR-30e precursor [miR-30e-5p and miR-30e-3p] were previously verified,31 yet the 5′ product was later shown to be the predominant one.32 Previous reports demonstrated altered miR-30e-5p expression levels per se in several autoimmune diseases including SLE6,28 and myasthenia gravis.29,30
The aim of this study was to evaluate the miR-30e-5p expression pattern in serum samples in an Egyptian SLE cohort and determine its potential association with various disease parameters as well as disease activity.
Subjects and methodsStudy participantsForty Egyptian SLE patients attending the Rheumatology and Rehabilitation Outpatient Clinic at Kasr Al Ainy Hospitals, Cairo University, from June 2018 to January 2019 were included in this study. Patients fulfilled the Systemic Lupus International Collaborating Clinics (SLICC) 2012 criteria.33 Patients with other co-existing connective tissue, systemic autoimmune diseases, malignancy or infections at the time of sampling were excluded from the study. Demographic and cumulative clinical characteristics were recorded. Disease activity was evaluated using the Systemic Lupus Erythematosus Disease Activity Index-2K (SLEDAI-2K) at the time of assessment.34 Thirty seven age-and gender-matched healthy volunteers were recruited as a control group. Prior to enrollment in the study, an informed consent was obtained from all participants. The study adhered to the tenets of the Helsinki Declaration.
Serum separation and storageBlood samples were dispensed into a sterile serum tube. Tubes were left to clot at room temperature. Samples were centrifuged within 2h of collection for 10min at 3000rpm at 4°C. The upper serum was placed in another tube and centrifuged for 10min at 16,000×g at 4°C. The supernatant was then transferred to another tube.
RNA extractionTotal RNA was extracted from serum using MiRNeasy Mini kit (Qiagen, Germany) following the manufacturer's instructions. The NanoDrop 1000 Spectrophotometer (NanoDrop Technologies) was used to determine the concentration & purity of extracted RNA.
Reverse transcription (RT)TaqMan MicroRNA RT Kit (Applied Biosystems) was used for miR-30e-5p complementary DNA (cDNA) synthesis following the manufacturer's protocol. 5μl of extracted RNA was used in a 15μl reaction mix to synthesize the cDNA. The conditions for RT were as follows: 16°C for 30min at, 42°C for 30min, 85°C for 5min and 4°C on hold. The cDNA was stored at −20°C.
Quantitative Real Time Polymerase Chain Reaction (qRT-PCR) analysisThe expression level of miR-30e-5p was determined by TaqMan qRT-PCR on the step one real time PCR system using TaqMan MicroRNA Assay kit as well as TaqMan Universal Master Mix from Applied Biosystems following the manufacturer's protocol. The samples were normalized to miR-16 as previously reported.6,35 qPCR was performed under the following settings: 10min at 95°C, followed by 40 cycles at 95°C for 15s and at 60°C for 1min. Relative miR-30e-5p expression levels were calculated by 2−ΔΔCT as defined by Schmittgen et al.,36 where ΔCT of both patient and control groups=CT miR-30e gene–CT miR-16 gene. ΔΔCT values were obtained by subtraction of control CT values from CT values. Results were expressed as fold change.
Statistical methodsAll statistical calculations were using the computer program IBM SPSS (Statistical Package for the Social Science; IBM Corp, Armonk, NY, USA) release 22 for Microsoft Windows. Numerical data were expressed in terms of mean and standard deviation or median and range. Qualitative data were expressed in terms of frequencies and percentages. Pearson's Chi-square test or Fisher's exact test was used to determine the relation between qualitative variables. Comparison between quantitative variables was done using the Student t-test for normally distributed data or the non-parametric Mann–Whitney test for non-normally distributed data. Correlations between quantitative variables were done using Spearman-rho method. Receiver operator characteristic (ROC) analysis was used to determine the optimum cut off value for the studied diagnostic marker. Accuracy was represented using the terms sensitivity and specificity. All tests were two-tailed. P-values less than 0.05 were considered as statistically significant.
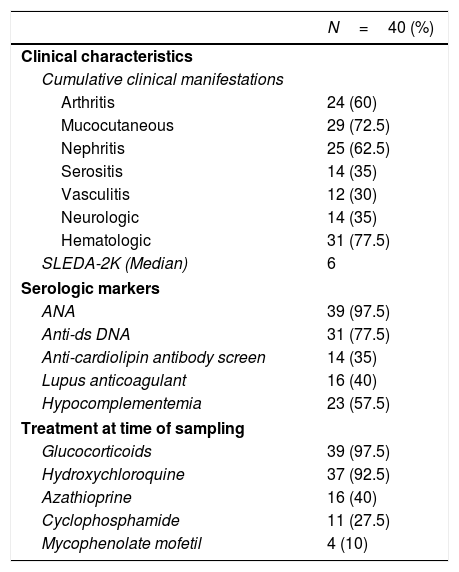
ResultsDemographic, clinical characteristics and laboratory parametersThis cross sectional study included a total of 77 female subjects (40 SLE patients and 37 normal controls). The mean age of the patients was 28.7±7.9 years and was comparable to the mean age of the controls 31.6±5.9 years (P=0.07). The SLEDAI-2K at the last visit ranged from 0 to 32, with a median score of 6. The patients’ cumulative clinical and serologic characteristics, and treatment received at the time of sampling are presented in Table 1.
Baseline characteristics of SLE patients.*.
| N=40 (%) | |
|---|---|
| Clinical characteristics | |
| Cumulative clinical manifestations | |
| Arthritis | 24 (60) |
| Mucocutaneous | 29 (72.5) |
| Nephritis | 25 (62.5) |
| Serositis | 14 (35) |
| Vasculitis | 12 (30) |
| Neurologic | 14 (35) |
| Hematologic | 31 (77.5) |
| SLEDA-2K (Median) | 6 |
| Serologic markers | |
| ANA | 39 (97.5) |
| Anti-ds DNA | 31 (77.5) |
| Anti-cardiolipin antibody screen | 14 (35) |
| Lupus anticoagulant | 16 (40) |
| Hypocomplementemia | 23 (57.5) |
| Treatment at time of sampling | |
| Glucocorticoids | 39 (97.5) |
| Hydroxychloroquine | 37 (92.5) |
| Azathioprine | 16 (40) |
| Cyclophosphamide | 11 (27.5) |
| Mycophenolate mofetil | 4 (10) |
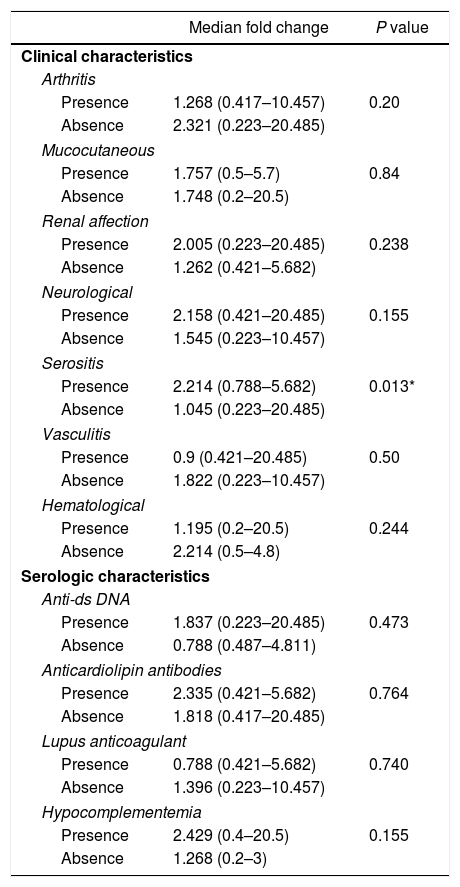
Among the demographic features studied, there was no significant correlation between the miR-30e-5p levels and patients’ age (r=0.085, P=0.593) or the age at onset (r=0.19, P=0.228). The median miR-30e-5p expression level was 1.748 (0.223–20.485) among SLE patients as opposed to 0.877 (0.058–3.522) in the control group (P=0.02). Patients with serositis expressed higher levels of miR-30e-5p with a median value of 2.214 (0.788–5.682) compared to those without serositis 1.045 (0.223–20.485) (P=0.013). There was no association between miR 30e-5p levels and any of the other included clinical manifestations (Table 2), or disease the SLEDAI-2K score (r=−0.045, P=0.778).
Association of miR-30e-5p expression levels with patients’ clinical and serologic characteristics.
| Median fold change | P value | |
|---|---|---|
| Clinical characteristics | ||
| Arthritis | ||
| Presence | 1.268 (0.417–10.457) | 0.20 |
| Absence | 2.321 (0.223–20.485) | |
| Mucocutaneous | ||
| Presence | 1.757 (0.5–5.7) | 0.84 |
| Absence | 1.748 (0.2–20.5) | |
| Renal affection | ||
| Presence | 2.005 (0.223–20.485) | 0.238 |
| Absence | 1.262 (0.421–5.682) | |
| Neurological | ||
| Presence | 2.158 (0.421–20.485) | 0.155 |
| Absence | 1.545 (0.223–10.457) | |
| Serositis | ||
| Presence | 2.214 (0.788–5.682) | 0.013* |
| Absence | 1.045 (0.223–20.485) | |
| Vasculitis | ||
| Presence | 0.9 (0.421–20.485) | 0.50 |
| Absence | 1.822 (0.223–10.457) | |
| Hematological | ||
| Presence | 1.195 (0.2–20.5) | 0.244 |
| Absence | 2.214 (0.5–4.8) | |
| Serologic characteristics | ||
| Anti-ds DNA | ||
| Presence | 1.837 (0.223–20.485) | 0.473 |
| Absence | 0.788 (0.487–4.811) | |
| Anticardiolipin antibodies | ||
| Presence | 2.335 (0.421–5.682) | 0.764 |
| Absence | 1.818 (0.417–20.485) | |
| Lupus anticoagulant | ||
| Presence | 0.788 (0.421–5.682) | 0.740 |
| Absence | 1.396 (0.223–10.457) | |
| Hypocomplementemia | ||
| Presence | 2.429 (0.4–20.5) | 0.155 |
| Absence | 1.268 (0.2–3) | |
Receiver operator characteristic (ROC) analysis was constructed to evaluate the efficiency of serum miR 30e-5p as a potential diagnostic biomarker for lupus patients. At a cutoff value ≥1.06, serum miR-30e-5p showed a sensitivity of 64.3% and a specificity of 61.5% with AUC 0.676 (95% CI: 0.559–0.794, P=0.02) (Fig. 1).
Discussion analysis for determination of the sensitivity and specificity of the studied miRNA in serum for discriminating SLE patients from controls.")
The obscure interplay of genetic, infectious and immunologic factors contributing to the pathogenesis and presentation of SLE further adds to its complexity and hampers targeted and personalized therapy.37 Among the reported genetic determinants implicated in the pathogenesis of SLE, aberrant miRNA-mediated regulation could be considered as a key player in the development of the disease and has been associated with distinct disease features.38 The aim of this study was to investigate the expression of miR-30e, a member of the miRNA 30 family characterized by its versatile functions25 including its role in autoimmune diseases.6,28–30 To the best of our knowledge, data about miR-30e in SLE is limited to the studies in the Korean6 and Indian populations28 therefore, we evaluated miR-30e-5p expression in serum samples in an Egyptian SLE cohort and investigated its potential association with the disease characteristics. Our study demonstrated significantly higher levels of miR-30e-5p expression among our patients as compared to the control group (P=0.02). A finding that is similar to that detected by Kim et al.,6 who reported elevated plasma levels of miR-30e-5p in a Korean SLE cohort. Similarly Mishra et al.28 demonstrated significantly increased miR-30e-5p expression (7 fold) in PBMCs of Indian SLE patients and serum of SLE mouse model with elevated expression of pro-inflammatory cytokines, type I interferons or type I interferons-inducible genes. MiR-30e-5p targets key negative regulators in innate immune responses including Toll-like receptor, Nod-like receptor and type I interferon signaling pathways.39,40 Mishra et al.28 reported a significant reduction of some targets of miR-30e-5p, such as TANK, TRIM38, SOCS1 and SOCS3 in SLE patients and socs1, socs3, atg5 and atg12 in SLE mice models, proposing that dysregulation of miR-30e expression may elevate innate immune responses, thus may be one of the underlying factors in autoimmune diseases including SLE. Moreover, the authors demonstrated that inhibition of miRNA-30e expression by introduction of stable inhibitor analogs including antagomir and lock nucleic acid inhibitor into SLE patients and SLE mouse model, respectively, significantly decreased SLE associated molecular signatures including type I interferon and proinflammatory cytokines.28 In view of the role of other members of miR30 family in SLE per se, Liu et al. demonstrated that in B cell lines, miR-30a specifically binds the 3’-UTR of Lyn, a key negative regulator of B cell activation. In addition, miR-30a overexpression reduced levels of Lyn in B cells from SLE patients promoting B cell hyperactivity, proliferation and IgG production.41 Additionally, Dai et al. demonstrated miR-30a up-regulation in renal biopsies of lupus nephritis patients.42 It is of note that miR-30s target some critical components of calcium/calcineurin signaling essential for normal cell physiology including TRPC6, PPP3CA, PPP3CB, PPP3R1, and NFATC3.43 Remarkably, studies suggest that abnormalities in the calcium-calcineurin pathway in SLE lead to breakage of B cell tolerance and induces differentiation of T cells toward the pathogenic Th17 subtype.44
In the current study, there was no association between miRNA-30e-5p with any of the investigated demographic features. Apart from serositis (P=0.013), there was no association with any of the other studied clinical features or with disease activity. On the other hand, Kim et al.6 reported that the expression levels of miR-30e-5p in plasma didn’t correlate with any disease manifestations. Interestingly, the role of miR-30 family in serosal inflammation and fibrosis has been demonstrated previously, including the significant downregulation of miR-30e-5p as well as miR-30a-5p, miR-30d-5p in FMF patients than healthy controls,24 and its association with peritoneal fibrosis following peritoneal hemodialysis.45 Moreover, miRNAs have been shown to affect mesothelial cells and are potential risk factors of the development of mesothelioma46; with miRNA-30e-5p in particular demonstrating distinct histopathologic mesothelial aberrations.47
To the best of our knowledge, our study is the first to evaluate the expression pattern of miR-30e-5p in serum samples of Egyptian SLE patients. The major limitation of the current work is the rather small number of enrolled participants, nevertheless, we found that the level of serum miR-30e-5p from lupus patients was significantly higher than that of controls. Significantly high levels of miR-30e-5p were demonstrated in patients with serositis. ROC curve analysis revealed the low accuracy of serum miR-30e-5p in differentiating our lupus patients from controls, thus, additional studies are required to evaluate the applicability of miR-30e-5p as a diagnostic biomarker. Given the fact that miRNA expression is influenced by genetic heterogeneity and exogenous influences as nutrition, exposure to certain environmental factors or medication,48,49 larger studies including patients with a different genetic background will be required to assess these issues. Measuring the concentration of a particular miRNA at a specific disease state may miss the dynamically altered miRNA therefore, immunosuppression naïve patients need to be recruited to demonstrate the expression of miRNA-30e-5p at the earliest stages of the disease and then throughout the disease course and in correlation with disease severity. Much remains to be established regarding the role of miR-30s including miRNA-30e-5p as diagnostic biomarkers as well as their role in SLE pathogenesis and establishing organ compromise. Future research addressing these issues might contribute to better understanding of the disease process and may pave the way toward identifying novel therapeutic targets.
Conflict of interestThe authors declare that they have no conflict of interest.
