


Assess the prevalence and types of digital technology use, as well as the extent to which patients use the internet and mobile devises. Evaluate the socioeconomic characteristics of patients and the possible relation to patterns of technology use in Colombia. Understand the nature of patient technology use in primary care for finding medical information.
MethodsA survey was applied to adult patients who attended primary health care centers systems in 6 Colombian cities. The survey inquired about demographic characteristics, insurance, access to services, cell phone use, internet access, and the use of such technology to access health-related services and information. Data was collected and managed using REDCap. Summary statistics on each survey item were calculated and the differences between discrete variables were analyzed using chi-square. Multivariate analyses were performed using logistic regression analysis for binary dependent variables.
ResultsA total of 1580 patients were surveyed across the six study sites. 93% of the patients reported they have a cell phone. Patients from urban healthcare centers showed a higher use of the Internet on their phone than less urban settings. Around half of the surveyed patients reported Internet use (49.7%). Among Internet users, 65% of participants use the Internet looking for health care information. Around one-third of patients use cellphones to arrange clinic visits. Around 24% of participants answered positively for both Whooley’s questions. Of those who screened positive on the Whooley questions, 43% reported being moderately anxious, 47% reported being very anxious. 51% reported having moderate pain; 52% reported having severe pain.
ConclusionsThe patterns of technology use identified in this study are essential for developing future health interventions based on ICT. The design of ICT clinical interventions must take into account the cellphone payment plans, availability of internet connection, advantages, and disadvantages of messenger services, including SMS as a possible alternative to people who do not have smartphones.
Evaluar la prevalencia y los tipos de uso de tecnología digital, al igual que el uso del internet y dispositivos móviles en pacientes. Evaluar las características sociodemográficas de pacientes y la posible relación a los patrones de uso de tecnología en Colombia. Entender la naturaleza del uso de tecnología en pacientes de atención primaria para búsqueda de información médica.
MétodosSe aplicó una encuesta a pacientes adultos que asistían a centros de atención primaria en 6 ciudades colombianas. La encuesta preguntaba acerca de las características demográficas, el seguro médico, el acceso a servicios, el uso de celular y de internet, y el uso de estas tecnologías para acceder a servicios e información concierne a la salud. Los datos se recolectaron y se manejaron utilizando REDCap. Las medidas de resumen de cada item de la encuesta fueron calculados y las diferencias entre las variables discretas fueron analizadas utilizando chi-cuadrado. Se realizaron análisis multivariados utilizando un análisis de regresión logística para las variables binarias dependientes.
ResultadosEn total se realizaron 1580 encuestas a pacientes en los seis sitios de estudio. 93% de los pacientes reportaron tener un celular. Los pacientes de centros de salud en zona urbana mostraron tener más uso de Internet en su celular que aquellos de zonas menos urbanas. Alrededor de mitad de los pacientes reportaron uso de Internet (49.7%). De los usuarios de Internet, 65% de los pacientes lo utilizan para buscar información concierne a la salud. Alrededor de un tercio de los pacientes utilizan el celular para agenda citas. Alrededor de 24% de los pacientes contestaron positivamente a las dos preguntas Whooley. De aquellos cuya tamización fue positiva a partir de las preguntas Whooley, 43% reportaron estar moderadamente ansiosos y 47% reportaron estar muy ansiosos; también 51% reportaron tener dolor moderado y 52% reportaron tener dolor severo.
ConclusionesLos patrones de uso de tecnología identificados en este estudio son esenciales para el desarrollo de futuras intervenciones basadas en tecnologías de información y comunicación (TIC). El diseño de intervenciones clínicas que utilizan TIC debe tener en cuenta los planes de pago de celulares, la disponibilidad de la conexión a internet, las ventajas y desventajas de los servicios de mensajería, incluyendo los SMS como alternativa para aquellas personas que no tienen celulares inteligentes.
Increasingly, health interventions, are employing digital information and communication technologies (ICT), enabling innovative models of healthcare.1 Digital health technology allows novel platforms for delivering clinical interventions that may be accessed anytime and anywhere. Digital technology facilitates home-based monitoring of patients with chronic diseases,2 improves adherence to treatments,3 provides remote support for medical emergencies,4 and deliver reliable, real-time health-related information to both healthcare providers and patients.5 The application of ICT in the healthcare arena includes diverse digital technologies, including digital therapeutic applications for mobile devices (apps), web-based screening systems and interventions, and electronic clinical decision support systems for providers. The use of digital technology in health care, assures the delivery of clinical interventions exclusively conducted by doctors and other health care providers but provides patients with new tools for self-empowerment that allow them to participate actively in their health care.6
Mobile technology-based tools are perhaps the best and most rapidly expanding type of ICT applied to diverse and broad areas of healthcare. The mobile platform allows for access to health care therapeutic resources as people live their daily lives, 24 h per day, seven days per week. The use of cell phones worldwide has been growing exponentially year after year. Over 61% of the world’s population use mobile devices as of 2020 In developing countries, such as Colombia, with a population of 49 million people,7,8 mobile phone penetration was 116.5% by 2015.9 At the end of 2019, Colombia had 65.1 cell phone lines, counting for 129.3 cell phone lines per every 100 inhabitants1.10 The broad public can benefit from access to digital health applications used in smartphones. Indeed, the digital health market is vast. In 2018, at least 50% of the more than 3.4 billion world users of smartphones and tablets downloaded applications related to health.11
However, the use of ICT applied to health care is not uniform among patients. Usage varies according to individuals’ demographic characteristics, the types of diseases/health care conditions they may have, their interests, as well as the objectives of the health care personnel and systems that may use ICT as prevention, diagnosis, and treatment tools.12 The application of digital health to mental health may be particularly important. In many cases, patients do not seek help for mental health problems due to the stigma of mental illness.13 In other cases, health professionals don’t have training in the detection of mental health problems.14 As such, ICT provides an opportunity for patients to seek information and help for mental health problems.15 In the case of Colombia, the application of digital health to mental health is particularly appealing, given the country’s poor mental health indicators,16 likely related to its long-standing history of violence and poor economic development as well as the limited mental health workforce in the vast majority of the territory.16,17
Despite the promise of digital ICT in developing countries, several barriers prevent the widespread adoption of ICT. These include limited access to technology in all regions of developing countries, limitations in technology infrastructure, poor internet penetration, and lack of apps developed in the local language.18 Additionally, the development and application of ICT solutions in health require solving the gap between the production of knowledge backed by scientific evidence and their subsequent application and use in practice in real scenarios. The research field of Implementation Science (I.S.) investigates the factors that influence the efficient and widespread use of scientific innovations in real-world settings, aiming to maximize the beneficial effects of health interventions at a system or population level.19 The project entitled “Scaling up Science-based Mental Health Interventions in Latin America” (DIADA project: Detección y atención integrada de la depresión y uso de alcohol en atención primaria), is an implementation research project, designed to create a new mental health service delivery model for Latin America, that centrally leverages empirically-supported digital health for mental health.20
As an initial step in the DIADA implementation process, it was necessary to understand the characteristics of users of ICT in health care centers in Colombia, along with their patterns of ICT use. The goals of the present study were to: (1) Assess the prevalence and types of digital technology use (e.g., Internet, cell phones, smartphones) among individuals in diverse regions of Colombia; (2) Investigate the extent to which patients in the primary care network in Colombia use the Internet, mobile devices, such as smartphones (e.g., iPhone, Android) and tablet computers (e.g., iPad), to answer clinical questions and find medical and health information; (3) Evaluate the socioeconomic characteristics of patients and their possible relation to patterns of technology use in Colombia and (4) Understand the nature of primary care patient’s mobile device use for finding medical information related to general health and mental health.
MethodsSurvey designThe DIADA research team designed a survey that collected demographic information from patients, as well as patients’ type of insurance and access to health services. The survey inquired about cell phone use, internet access, and the use of such technology to access health-related services and information. Some of the questions related to technology use were derived from a national survey about ICT in Bogotá, Colombia.21 The issues related to general health status, mental health status compared to depression, and quality of life were extracted from EQ-5D (Spanish version)22 and the two-question depression case-finding instrument (Whooley’s questions)2.23
Study data collectionStudy data were collected and managed using the REDCap (Research Electronic Data Capture) electronic data capture platform hosted at Pontificia Universidad Javeriana in Colombia.24 REDCap is a secure, web-based application designed to support data capture for research studies, providing: (1) an intuitive interface for validated data entry; (2) audit trails for tracking data manipulation and export procedures; (3) automated export procedures for seamless data downloads to common statistical packages, and (4) procedures for importing data from external sources.24
Once the survey was finalized, it was built in a digital format using the REDCap web version, from which the database was administered. Using the REDCap Android mobile application, the survey formulary was downloaded on tablets that were used by interviewers in each of the participating primary care systems. The app allowed the research team to collect data in places in which Internet connectivity was intermittent or non-existent and to synchronize the data upload once an internet connection was accessible. Data were uploaded to REDCap at least daily. The project administrator routinely monitored, through REDCap, the integrity and quality of the data before being exported for statistical analysis.
PopulationParticipants were adult patients (>18 years) who attended primary care health care systems in 6 Colombian cities in Colombia. Each of the patients was approached by a research assistant in the waiting room. Those who met inclusionary criteria and who agreed to participate in this anonymous survey were then asked to complete the survey (via the computerized assessment on a tablet) in the waiting room of the primary care setting.
Healthcare centersSix collaborating primary care centers in which the survey was deployed, were selected to span a diverse range of locations, including urban, rural, and suburban sites. The characteristics of the centers are described as follows.
Health care center-1 (HC1) is a private primary care center located in Bogotá D.C. capital of Colombia. Bogotá has around 9 million inhabitants. The center serves 620 patients each month. The center is located in the north of the city and generally serves patients with middle and upper socioeconomic levels. The majority of HC1 patients live in urban settings and have private healthcare insurance. The city location of the center is an economically and socially developed area of the city with highways, commercial development, and full public transportation.
Health care center-2 (HC2) is a public primary care center at the municipality of Duitama in Boyacá Department, 193 km Northwest from Bogotá D.C. Duitama has a population of 113,000 inhabitants. The HC2 serves around 10,500 patients each month. The majority of patients live in Duitama and rural and suburban areas around the city. Most of Duitama’s population have middle and low incomes. The health insurance is covered both by public and private systems.
Health care center-3 (HC3) is a public primary care center at the municipality of Santa Rosa in the Boyacá department, located 9.3 km north of Duitama. Santa Rosa has a population of 11,821 inhabitants. The HC3 attends around 930 patients each month. The patients come from the urban and surrounding rural areas of the town. The population served by HC3 has health insurance covered both by public and private systems. The Santa Rosa population generally has low and middle income levels.
Health care center-4 (HC4) is a public primary care center at the municipality of Armero-Guayabal in the Tolima Department, located 169 km northeast from Bogotá. Armero-Guayabal has a population of 11,700 inhabitants. The hospital attends around 250 patients each month, coming from the urban and surrounding rural areas of the town. The attended community by the HC4 have health insurance covered both by public and private systems. The Armero-Guayabal population generally has low and middle incomes.
Health care center-5 (HC5) is a public psychiatric specialized hospital at the municipality of Lerida in the Tolima Department, located 223 km northeast from Bogotá and 19 km south-east from Armero-Guayabal. Lerida has a population of 17,000 inhabitants. The HC5 attends in the outpatient clinic around 200 patients each month. The patients come from the urban and surrounding rural areas of the town. The attended population by the HC5 has health insurance covered both by public and private systems. The patients have low and middle incomes.
Health care center-6 (HC6) is a public primary care center at the municipality of Chaparral in the Tolima Department, located 255 km south-east from Bogotá. Chaparral has a population of 47,000 inhabitants. The HC6 serves around 320 patients each month. The patients come from the urban and surrounding rural areas of the town. The attended population have health insurance covered both by public and private systems. The patients have low and middle incomes.
Data analysisSummary statistics on each survey item were calculated, including the absolute and relative frequencies of each variable. Results were compared across study sites. The differences between discrete variables were analyzed using chi-square. Multivariate analyses were performed using logistic regression analysis for binary dependent variables: 1) Having a cellphone; 2) Type of phone (basic vs. smartphone), 3) Using cellphones for connecting the Internet, 4) Using a cellphone for a health care search, 5) Using cellphone for mental health search, 6) Internet use for healthcare search, and (7 Internet use for mental health care. Analyses were performed on STATA 14 and GraphPad Prism 8.04. The data is presented in frequency histograms.
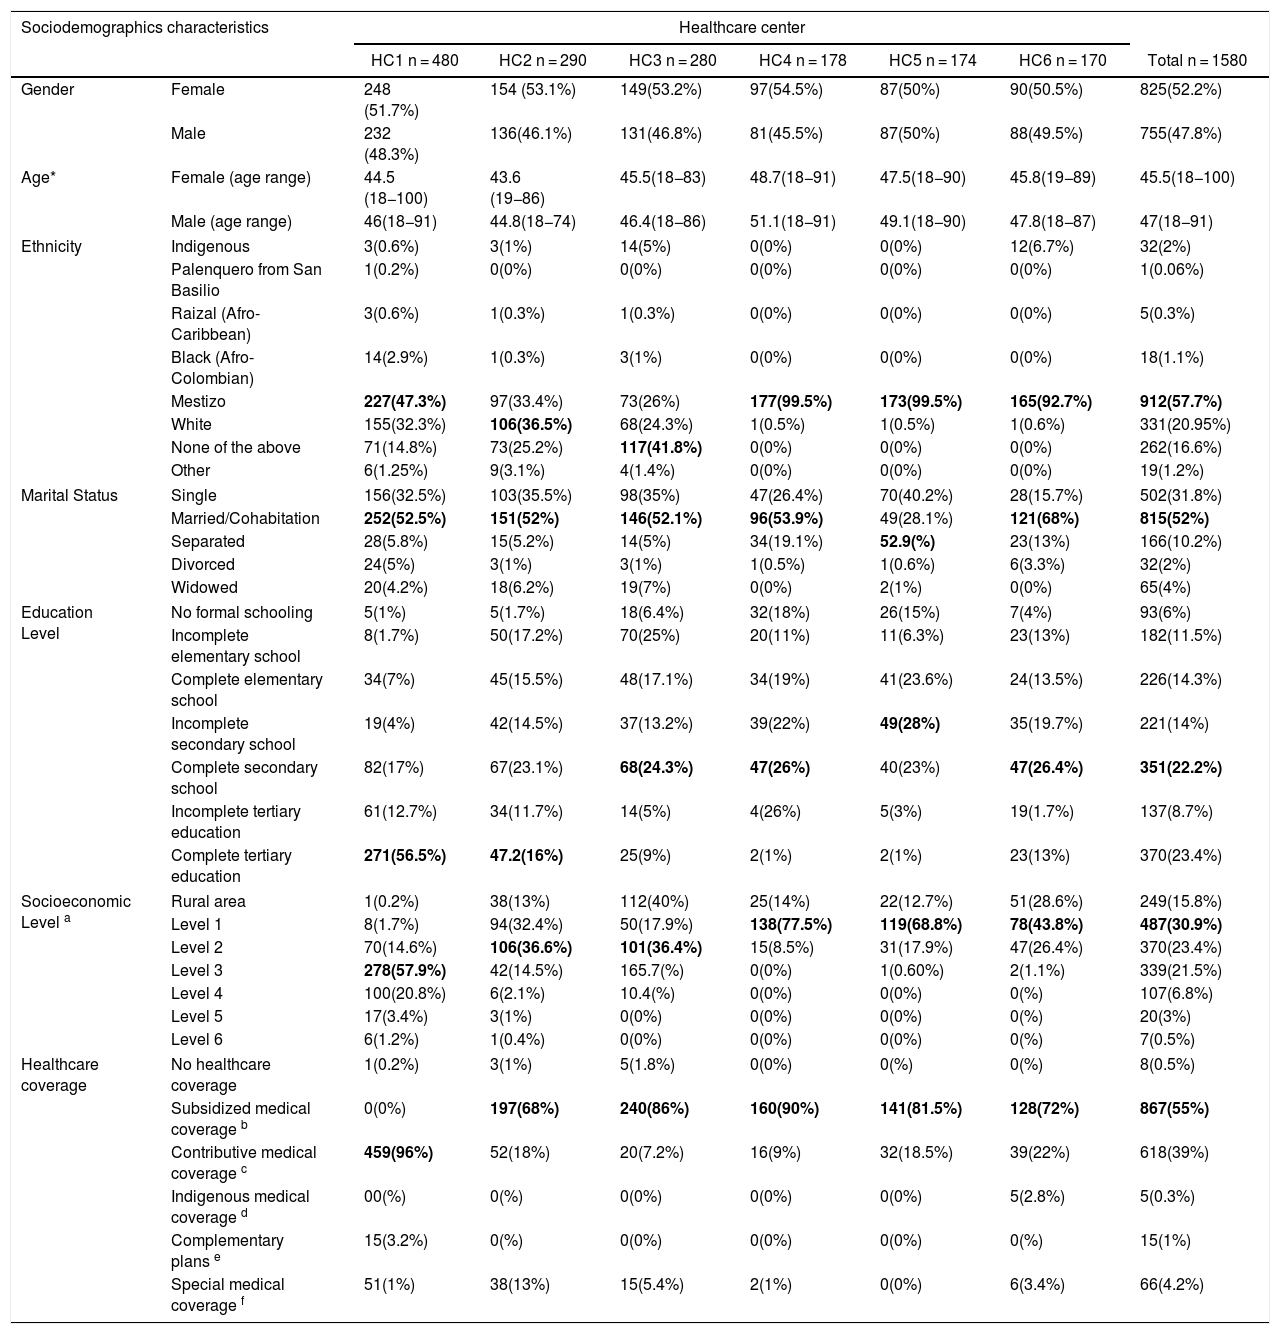
ResultsA total of 1580 patients were surveyed across the six study sites. The demographic description of the studied population is shown in Table 1.
Sociodemographic description of surveyed patients.
| Sociodemographics characteristics | Healthcare center | |||||||
|---|---|---|---|---|---|---|---|---|
| HC1 n = 480 | HC2 n = 290 | HC3 n = 280 | HC4 n = 178 | HC5 n = 174 | HC6 n = 170 | Total n = 1580 | ||
| Gender | Female | 248 (51.7%) | 154 (53.1%) | 149(53.2%) | 97(54.5%) | 87(50%) | 90(50.5%) | 825(52.2%) |
| Male | 232 (48.3%) | 136(46.1%) | 131(46.8%) | 81(45.5%) | 87(50%) | 88(49.5%) | 755(47.8%) | |
| Age* | Female (age range) | 44.5 (18−100) | 43.6 (19−86) | 45.5(18−83) | 48.7(18−91) | 47.5(18−90) | 45.8(19−89) | 45.5(18−100) |
| Male (age range) | 46(18−91) | 44.8(18−74) | 46.4(18−86) | 51.1(18−91) | 49.1(18−90) | 47.8(18−87) | 47(18−91) | |
| Ethnicity | Indigenous | 3(0.6%) | 3(1%) | 14(5%) | 0(0%) | 0(0%) | 12(6.7%) | 32(2%) |
| Palenquero from San Basilio | 1(0.2%) | 0(0%) | 0(0%) | 0(0%) | 0(0%) | 0(0%) | 1(0.06%) | |
| Raizal (Afro-Caribbean) | 3(0.6%) | 1(0.3%) | 1(0.3%) | 0(0%) | 0(0%) | 0(0%) | 5(0.3%) | |
| Black (Afro-Colombian) | 14(2.9%) | 1(0.3%) | 3(1%) | 0(0%) | 0(0%) | 0(0%) | 18(1.1%) | |
| Mestizo | 227(47.3%) | 97(33.4%) | 73(26%) | 177(99.5%) | 173(99.5%) | 165(92.7%) | 912(57.7%) | |
| White | 155(32.3%) | 106(36.5%) | 68(24.3%) | 1(0.5%) | 1(0.5%) | 1(0.6%) | 331(20.95%) | |
| None of the above | 71(14.8%) | 73(25.2%) | 117(41.8%) | 0(0%) | 0(0%) | 0(0%) | 262(16.6%) | |
| Other | 6(1.25%) | 9(3.1%) | 4(1.4%) | 0(0%) | 0(0%) | 0(0%) | 19(1.2%) | |
| Marital Status | Single | 156(32.5%) | 103(35.5%) | 98(35%) | 47(26.4%) | 70(40.2%) | 28(15.7%) | 502(31.8%) |
| Married/Cohabitation | 252(52.5%) | 151(52%) | 146(52.1%) | 96(53.9%) | 49(28.1%) | 121(68%) | 815(52%) | |
| Separated | 28(5.8%) | 15(5.2%) | 14(5%) | 34(19.1%) | 52.9(%) | 23(13%) | 166(10.2%) | |
| Divorced | 24(5%) | 3(1%) | 3(1%) | 1(0.5%) | 1(0.6%) | 6(3.3%) | 32(2%) | |
| Widowed | 20(4.2%) | 18(6.2%) | 19(7%) | 0(0%) | 2(1%) | 0(0%) | 65(4%) | |
| Education Level | No formal schooling | 5(1%) | 5(1.7%) | 18(6.4%) | 32(18%) | 26(15%) | 7(4%) | 93(6%) |
| Incomplete elementary school | 8(1.7%) | 50(17.2%) | 70(25%) | 20(11%) | 11(6.3%) | 23(13%) | 182(11.5%) | |
| Complete elementary school | 34(7%) | 45(15.5%) | 48(17.1%) | 34(19%) | 41(23.6%) | 24(13.5%) | 226(14.3%) | |
| Incomplete secondary school | 19(4%) | 42(14.5%) | 37(13.2%) | 39(22%) | 49(28%) | 35(19.7%) | 221(14%) | |
| Complete secondary school | 82(17%) | 67(23.1%) | 68(24.3%) | 47(26%) | 40(23%) | 47(26.4%) | 351(22.2%) | |
| Incomplete tertiary education | 61(12.7%) | 34(11.7%) | 14(5%) | 4(26%) | 5(3%) | 19(1.7%) | 137(8.7%) | |
| Complete tertiary education | 271(56.5%) | 47.2(16%) | 25(9%) | 2(1%) | 2(1%) | 23(13%) | 370(23.4%) | |
| Socioeconomic Level a | Rural area | 1(0.2%) | 38(13%) | 112(40%) | 25(14%) | 22(12.7%) | 51(28.6%) | 249(15.8%) |
| Level 1 | 8(1.7%) | 94(32.4%) | 50(17.9%) | 138(77.5%) | 119(68.8%) | 78(43.8%) | 487(30.9%) | |
| Level 2 | 70(14.6%) | 106(36.6%) | 101(36.4%) | 15(8.5%) | 31(17.9%) | 47(26.4%) | 370(23.4%) | |
| Level 3 | 278(57.9%) | 42(14.5%) | 165.7(%) | 0(0%) | 1(0.60%) | 2(1.1%) | 339(21.5%) | |
| Level 4 | 100(20.8%) | 6(2.1%) | 10.4(%) | 0(0%) | 0(0%) | 0(%) | 107(6.8%) | |
| Level 5 | 17(3.4%) | 3(1%) | 0(0%) | 0(0%) | 0(0%) | 0(%) | 20(3%) | |
| Level 6 | 6(1.2%) | 1(0.4%) | 0(0%) | 0(0%) | 0(0%) | 0(%) | 7(0.5%) | |
| Healthcare coverage | No healthcare coverage | 1(0.2%) | 3(1%) | 5(1.8%) | 0(0%) | 0(%) | 0(%) | 8(0.5%) |
| Subsidized medical coverage b | 0(0%) | 197(68%) | 240(86%) | 160(90%) | 141(81.5%) | 128(72%) | 867(55%) | |
| Contributive medical coverage c | 459(96%) | 52(18%) | 20(7.2%) | 16(9%) | 32(18.5%) | 39(22%) | 618(39%) | |
| Indigenous medical coverage d | 00(%) | 0(%) | 0(0%) | 0(0%) | 0(0%) | 5(2.8%) | 5(0.3%) | |
| Complementary plans e | 15(3.2%) | 0(%) | 0(0%) | 0(0%) | 0(0%) | 0(%) | 15(1%) | |
| Special medical coverage f | 51(1%) | 38(13%) | 15(5.4%) | 2(1%) | 0(0%) | 6(3.4%) | 66(4.2%) | |
The socioeconomic level (strata) in Colombia is a system that classifies urban geographical areas on a scale from 1 to 6, having one as the lowest income area and six as the highest. The system permits that the people living in upper layers (strata 5 and 6) pay more for public services like electricity and water than the groups in the lower strata.
SISBEN (Sistema de Selección de Beneficiarios para Programas Sociales) is a socio-economic classification survey, designed by the National Planning Department (DNP) to identify the poorest and most vulnerable households, families or individuals as potential beneficiaries of social programs, among which is health affiliation to the subsidized regime.
Contributive regime (CR) is Colombia’s compulsory health insurance for the population with salary income. The CR is mandatory for all formal workers who earn at least one minimum salary per month.
Ninety-three percent of the patients reported they have a cell phone, 52% of whom were women, 48% were men. Around half of the patients (56%) have a smartphone. And, 68% of the patients who reported they have smartphones are between 18–44 years old.
In contrast, 56% of the patients who use a basic (conventional) phone are older than 56 years old. This finding was consistent across study sites, without any difference among males and females (P = .68). The majority of patients (72.2%) have a prepaid phone plan, 22.5% have a monthly phone plan at a fixed price, 3.7% of the patients have a corporate phone plan or unlimited monthly phone plan, and 1.6% do not know their cell payment plan. Having a prepaid phone plan was predominant across the study sites.
Many of the patients reported trust in the competence of their cellphones. They said their phone is reliable or very reliable in 73% of the cases. In comparison, 27% of patients viewed their cell phone as somewhat reliable, unreliable, or very unreliable (P < .001), a tendency that is constant across sites, gender, and range of ages.
We also found that 75% of patients use their phones every day, 22% use it several times each week, and 3% use it less than once per week. Both genders use the phone with the same frequency (P = .43). Patients reported a preference for using messenger tools instead of text messaging (SMS) on cell phones. That is, in 73% of the cases, patients said they did not like to use text messaging. Instead, they preferred to use, daily or several times a week, messenger apps like WhatsApp, Facebook Messenger, or Viber (54% of patients) (P < .001). A total of 78% of the patients reported they have never used voice messaging. We did not find a difference in using messenger tools between gender or study sites (P = .25).
Forty-nine percent of patients reported they use their cellphones for connecting to the Internet. This proportion differed across study sites, with urban healthcare centers (such as HC1 showing significantly higher use of the Internet on their phone (75% of the patients use the phone for internet navigation). In comparison, less urban settings (such as HC4 or HC5) showed less use of the Internet on their phone (66% of patients don’t use their phones to navigate the web) (P < .001). Age is also relevant, in that 74% of patients that use their phone for surfing the web are between 18–44 years old (P < .001). Among those patients who connect to the Internet using their cellphone, 67% find their connection reliable or very reliable (See Fig. 1).
Cellphone uses for health care. LOW: less than one time a week.")
Around one-third of the patients use their cells for arranging clinic visits. However, only 9.6% use their phones for calling their doctor, with no differences by gender (P = .5) or study site (P = .5). One-fifth of participants (20%) reported using their mobile phones to find general health care information online.
Less than 2% of participants reported using their cell phones to look for apps related to depression or mental health care. And, only 2% of participants reported using their phone for information related to managing depression. 70% of these patients were between 18–44 years old, and 44% of them are from HC1.
Only 10% of patients use health-related apps on their phones. Around 90% of the health apps used by patients are fitness apps, and this did not differ by gender (P = .68). However, these apps were mostly used in HC1 and HC2 (P < .001). Around one-fourth of participants (32%) have apps that are puzzles and brain teasers, and we did not find any difference in this metric by gender (P = .4). However, these apps were mostly used again in HC1 and HC2 (P > .001).
Among health apps users, 20% of subjects have an app related to pregnancy and neonatal care, and 70% of those users were women (P < .01). Only 11% of the apps used by participants were for smoking cessation, 58% of whom were men (P = .002). 38% of the patients use an app specifically for a disease (Diabetes, hypertension, COPD), and 55% of that group were women (P = .05). Users of all types of apps were mainly between the ages of 18–44, the same age group that reported having smartphones. Fig. 2 shows the specific uses of mobile phones related to healthcare and mental healthcare.
Internet access
Around half of the surveyed patients reported that they use the Internet (49.7%), 26% of which are between 18–34 years old (P < .001). In HC1, more than 75% of participants use the Internet. In contrast, at HC2, only half of the patients are actively using it, and the lower proportion of use is in HC5, where only 21% of the surveyed use the Internet (P < .001). 52% of the Internet users were male compared to 48% of women users (P = .02).
The frequency of internet use was also of higher proportion among users of HC1, where around 75% of participants reported using it every day of the week (P < .001), about 58% of HC1 users were connected through their computer (Desktop or laptop). However, in about 60%–80% of the cases in the rest of the sites, participants reported connecting to the Internet in various ways, including community centers, community libraries, or internet café (P < .001) (See Fig. 2).
Following the same pattern for using cellphones and the Internet, younger participants use the Internet more than the older participants; 44% of daily users are between 18–44 years old (P = .007).
Internet uses for health careAmong Internet users, 65% of participants use the Internet looking for health care information, 47% are women, 53% men. The majority of Internet users for health care are in HC1 (79%) and HC2 (78%), compared to the semirural centers where they have a low proportion of internet users that look for health-related issues (P < .001). No difference was observed by age group in the use of the Internet to search for general healthcare information (P = .09).
Only 5.8% of the patients reported using the Internet for mental health care information, and no differences were observed by age (P = .77) or gender (P = .36). Approximately 46% of participants who searched the Internet for mental health information were from HC1.
Few people reported that their doctors recommend they use specific sites related to health (2.5%), most of them (55%) came from HC1 (P = .001) and we did not find differences on those recommendations by gender (P = .2), or age (P = .6). Only 0.5% of the people received from their doctor recommendations about internet mental health care resources. No participants received recommendations about mobile apps related to mental health.
Depression screening and health status of patientsAround 24% of participants answered positively for both of the Whooley’s questions.3 19% of participants responded positively for at least one of the depression screening questions (43% of positive screening). Among participants with a positive screening (any of the Whooley’s questions as positive), more positive screens were evident among women (57%) (P = .001) and at the HC5 center (66%) (P = .001). Fig. 3 shows the distribution of the screening answers by the center.

Cellphone uses for health and mental health.
Cellphones for general health care: 1: To call a doctor, n = 117. 2: To call to the pharmacy/drugstore, n = 135. 3: To make office appointments, n = 281. 4: To buy Medicines, n = 189. 5: To look for healthcare information at the internet, n = 201. 6: To ask my friends for healthcare information, n = 177. 7: To look for healthcare apps, n = 42. 8: None of the above, n = 947. Cellphones for Mental health: 1: Call a doctor, n = 21. 2: To call a mental health hotline, n = 9. 3: To call a friend asking for help, n = 37 4: to look at the internet for information that helps me to handle mental health symptoms, n = 34 5: To look for information about how to deal with depression, n = 28. 6: to contact someone trustable to tell her about how you feel, n = 87. 7: To look apps for mental health, n = 7. 8: None of the above, n = 1330.
In regards to mobility status, 82% of the patients pointed out that they do not have problems walking. 17% reported they have moderate problems walking, and 51.3% of these participants are females (P = .77). Only 1% of participants reported they have to stay most of the time at the bed. Among those who answer having troubles walking, we did not find any differences by site (P = .7), gender (P = .07) or age group (P = .07). About self-care, only 3.8% of the patients reported they have some problems with washing or dressing. We didn’t find any differences by site (P = .055), gender (P = .05) or age group (P = .05). Less than 1% indicated they were unable to wash or dress by themselves (3 patients from 18 to 34 years old group of age). Approximately 14% of participants reported they have moderate problems doing their usual activities (e.g., work, study, housework, family, or leisure activities), 73% of which are between 18–44 years old group of age. Only 1% of patients complain about being unable to do their daily activities.
Approximately 14% of the participants reported moderate pain. 6.8% referred to their pain as extreme, 34% of these patients were from the HC1 center (P < .001). 20% of the subjects reported feeling moderately anxious, and 2.7% reported feeling extremely anxious, and the majority of anxious patients came from HC1 (42%) and HC2 (33%) (P = .001). We didn’t find any differences by site, gender, or age group. (Differences by the center are showed in Fig. 4).

Health status.
WQ: Wholley questions. HT-M1: Health today mobility: “I have no problems in walking about”. HT-M2: “I have moderate problems in walking about” HT-M3: “I am unable to walk about”. HT-SC1: Health today selfcare: “I have no problems washing or dressing myself”. HT-SC2: “I have moderate problems washing or dressing myself”. HT-SC3: “I am unable to wash or dress myself”. HT-DA1: Health today daily activities “I have no problems doing my usual activities”. HT-DA2: “I have moderate problems doing my usual activities”. HT-DA3: “I am unable to do my usual activities”. HT-P1: Health today pain “I have no pain or discomfort”. HT-P2: “I have moderate pain or discomfort”. HT-P3: “I have extreme pain or discomfort”. HT-A1: Healt today anxiety “I am not anxious”. HT-A2: “I am moderately anxious”. HT-A3: “I am extremely anxious”. HC1: Javesalud. HC2: The Regional Hospital of Duitama. SRVH: Santa Rosa de Viterbo Hospital. HC4: Nelson Restrepo Martínez Hospital. HC5: Hospital Especializado Granja Integral. HC6: Hospital San Juan Bautista in Chaparral.
Of those who screened positive on the Whooley screening questions, 43% reported being moderately anxious, 47% reported being very anxious. 51% reported having moderate pain; 52% reported having severe pain. We did not find any difference among patients who tested positive in the depression screening, who were anxious or in pain, and their gender, age, or level of education.
The pain was pointed out by the patients as moderate or making subjects feel discomfort in 14% of the cases. 6.8% referred to pain as extreme, 34% of these patients are from HC1 center (P < .001). 20% of participants felt moderately anxious, and 2.7% answered feeling extremely anxious, the majority of anxious patients came from HC1 (42%) and HC2 (33%) (P = .001). We did not find any differences by gender or age group. (Differences by the site are showed in Fig. 4).
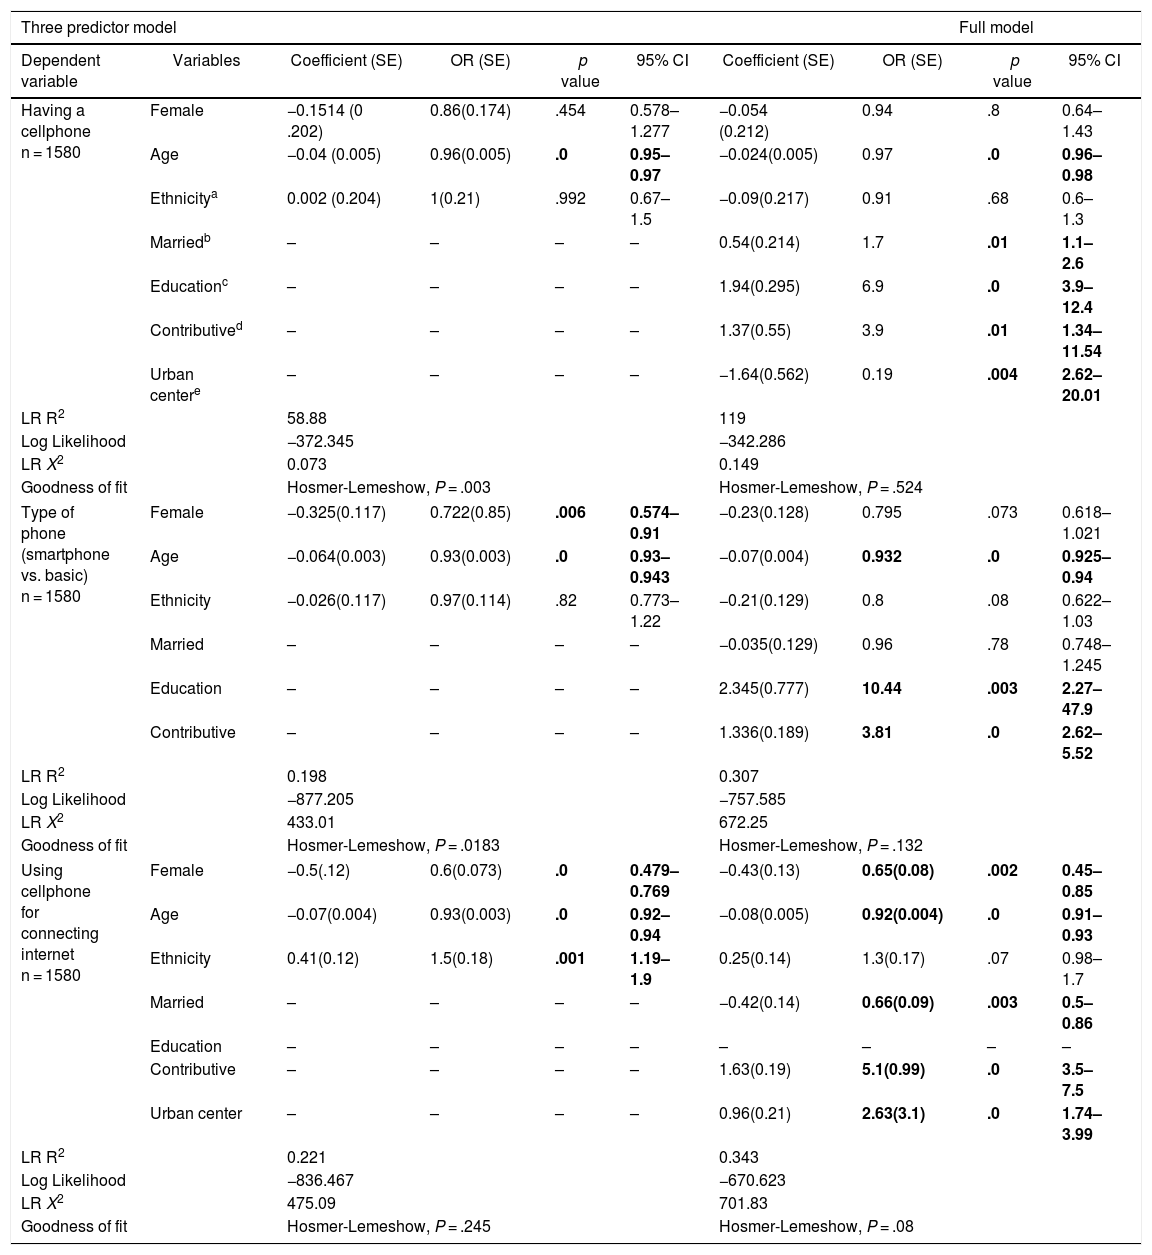
Table 2 describes a three predictor model and a full regression model using demographic variables. A user profile with a smartphone, and who uses the smartphone to connect to the Internet, is typically married, mainly female, having at least primary education, having contributive healthcare assurance and living in an urban center.
Multivariate models for cellphone type and internet connection.
| Three predictor model | Full model | ||||||||
|---|---|---|---|---|---|---|---|---|---|
| Dependent variable | Variables | Coefficient (SE) | OR (SE) | p value | 95% CI | Coefficient (SE) | OR (SE) | p value | 95% CI |
| Having a cellphone n = 1580 | Female | −0.1514 (0 .202) | 0.86(0.174) | .454 | 0.578–1.277 | −0.054 (0.212) | 0.94 | .8 | 0.64–1.43 |
| Age | −0.04 (0.005) | 0.96(0.005) | .0 | 0.95–0.97 | −0.024(0.005) | 0.97 | .0 | 0.96–0.98 | |
| Ethnicitya | 0.002 (0.204) | 1(0.21) | .992 | 0.67–1.5 | −0.09(0.217) | 0.91 | .68 | 0.6–1.3 | |
| Marriedb | – | – | – | – | 0.54(0.214) | 1.7 | .01 | 1.1–2.6 | |
| Educationc | – | – | – | – | 1.94(0.295) | 6.9 | .0 | 3.9–12.4 | |
| Contributived | – | – | – | – | 1.37(0.55) | 3.9 | .01 | 1.34–11.54 | |
| Urban centere | – | – | – | – | −1.64(0.562) | 0.19 | .004 | 2.62–20.01 | |
| LR R2 | 58.88 | 119 | |||||||
| Log Likelihood | −372.345 | −342.286 | |||||||
| LR X2 | 0.073 | 0.149 | |||||||
| Goodness of fit | Hosmer-Lemeshow, P = .003 | Hosmer-Lemeshow, P = .524 | |||||||
| Type of phone (smartphone vs. basic) n = 1580 | Female | −0.325(0.117) | 0.722(0.85) | .006 | 0.574–0.91 | −0.23(0.128) | 0.795 | .073 | 0.618–1.021 |
| Age | −0.064(0.003) | 0.93(0.003) | .0 | 0.93–0.943 | −0.07(0.004) | 0.932 | .0 | 0.925–0.94 | |
| Ethnicity | −0.026(0.117) | 0.97(0.114) | .82 | 0.773–1.22 | −0.21(0.129) | 0.8 | .08 | 0.622–1.03 | |
| Married | – | – | – | – | −0.035(0.129) | 0.96 | .78 | 0.748–1.245 | |
| Education | – | – | – | – | 2.345(0.777) | 10.44 | .003 | 2.27–47.9 | |
| Contributive | – | – | – | – | 1.336(0.189) | 3.81 | .0 | 2.62–5.52 | |
| LR R2 | 0.198 | 0.307 | |||||||
| Log Likelihood | −877.205 | −757.585 | |||||||
| LR X2 | 433.01 | 672.25 | |||||||
| Goodness of fit | Hosmer-Lemeshow, P = .0183 | Hosmer-Lemeshow, P = .132 | |||||||
| Using cellphone for connecting internet n = 1580 | Female | −0.5(.12) | 0.6(0.073) | .0 | 0.479–0.769 | −0.43(0.13) | 0.65(0.08) | .002 | 0.45–0.85 |
| Age | −0.07(0.004) | 0.93(0.003) | .0 | 0.92–0.94 | −0.08(0.005) | 0.92(0.004) | .0 | 0.91–0.93 | |
| Ethnicity | 0.41(0.12) | 1.5(0.18) | .001 | 1.19–1.9 | 0.25(0.14) | 1.3(0.17) | .07 | 0.98–1.7 | |
| Married | – | – | – | – | −0.42(0.14) | 0.66(0.09) | .003 | 0.5–0.86 | |
| Education | – | – | – | – | – | – | – | – | |
| Contributive | – | – | – | – | 1.63(0.19) | 5.1(0.99) | .0 | 3.5–7.5 | |
| Urban center | – | – | – | – | 0.96(0.21) | 2.63(3.1) | .0 | 1.74–3.99 | |
| LR R2 | 0.221 | 0.343 | |||||||
| Log Likelihood | −836.467 | −670.623 | |||||||
| LR X2 | 475.09 | 701.83 | |||||||
| Goodness of fit | Hosmer-Lemeshow, P = .245 | Hosmer-Lemeshow, P = .08 | |||||||
Definition of variables: Ages: comparison between two strata, <45 years old vs. >years old.
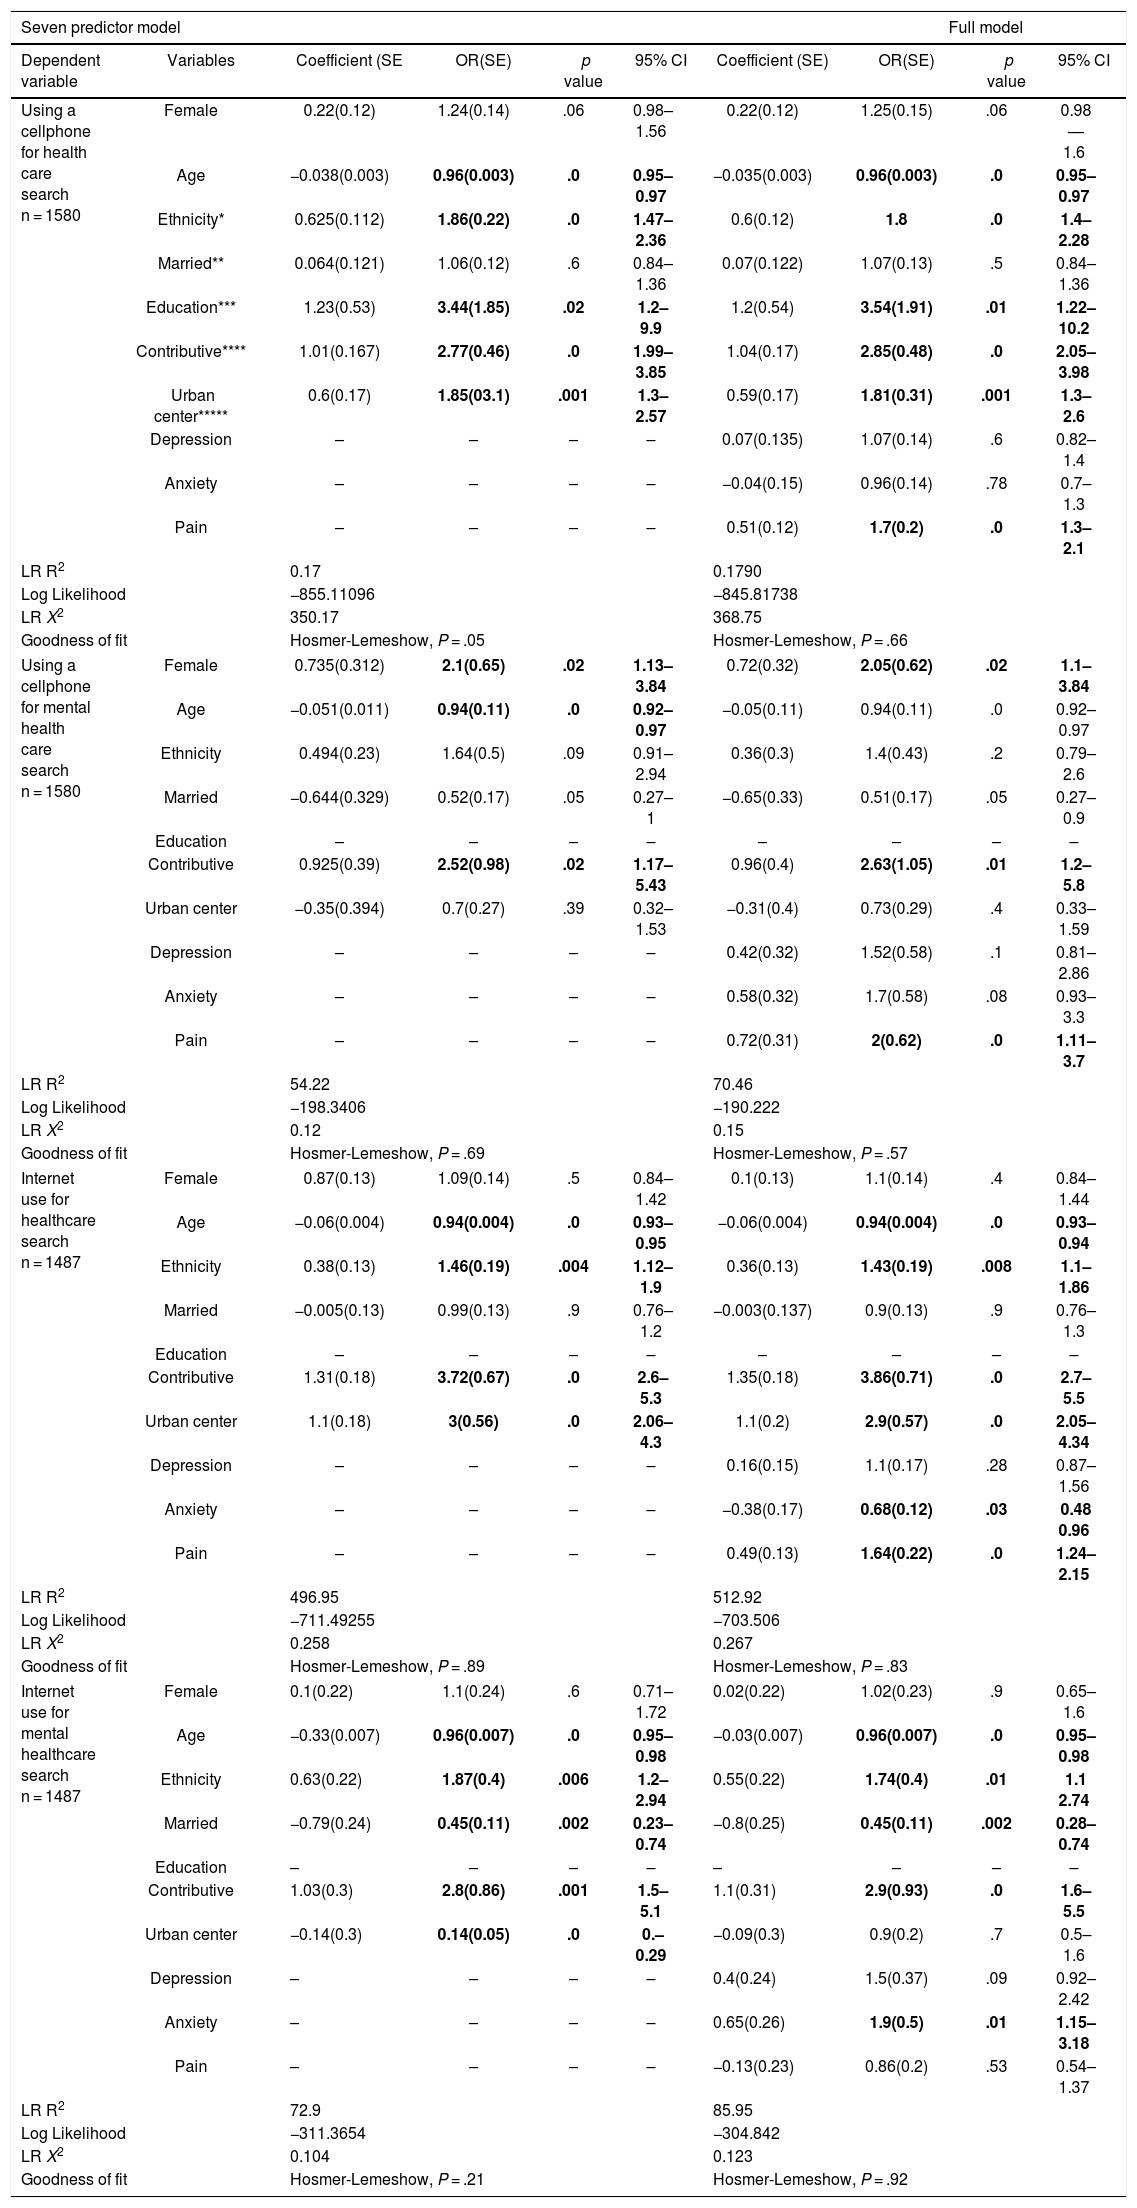
Table 3 describes the model predicting a relation with cellphone and Internet for health care searching. In general, the older the patient, the less likely they are to use a cell to search for health care information. Also, the pain was related to increased odds of searching for mental health care using a cellphone. Anxiety and pain were related to higher probabilities of using the Internet for searching for health care. However, only anxiety was associated with using the Internet to search for mental health care. Women were more likely than men to both use cellphones and the Internet to conduct health care searches.
Multivariate models for cellphone and internet use for health care searching.
| Seven predictor model | Full model | ||||||||
|---|---|---|---|---|---|---|---|---|---|
| Dependent variable | Variables | Coefficient (SE | OR(SE) | p value | 95% CI | Coefficient (SE) | OR(SE) | p value | 95% CI |
| Using a cellphone for health care search n = 1580 | Female | 0.22(0.12) | 1.24(0.14) | .06 | 0.98–1.56 | 0.22(0.12) | 1.25(0.15) | .06 | 0.98—1.6 |
| Age | −0.038(0.003) | 0.96(0.003) | .0 | 0.95–0.97 | −0.035(0.003) | 0.96(0.003) | .0 | 0.95–0.97 | |
| Ethnicity* | 0.625(0.112) | 1.86(0.22) | .0 | 1.47–2.36 | 0.6(0.12) | 1.8 | .0 | 1.4–2.28 | |
| Married** | 0.064(0.121) | 1.06(0.12) | .6 | 0.84–1.36 | 0.07(0.122) | 1.07(0.13) | .5 | 0.84–1.36 | |
| Education*** | 1.23(0.53) | 3.44(1.85) | .02 | 1.2–9.9 | 1.2(0.54) | 3.54(1.91) | .01 | 1.22–10.2 | |
| Contributive**** | 1.01(0.167) | 2.77(0.46) | .0 | 1.99–3.85 | 1.04(0.17) | 2.85(0.48) | .0 | 2.05–3.98 | |
| Urban center***** | 0.6(0.17) | 1.85(03.1) | .001 | 1.3–2.57 | 0.59(0.17) | 1.81(0.31) | .001 | 1.3–2.6 | |
| Depression | – | – | – | – | 0.07(0.135) | 1.07(0.14) | .6 | 0.82–1.4 | |
| Anxiety | – | – | – | – | −0.04(0.15) | 0.96(0.14) | .78 | 0.7–1.3 | |
| Pain | – | – | – | – | 0.51(0.12) | 1.7(0.2) | .0 | 1.3–2.1 | |
| LR R2 | 0.17 | 0.1790 | |||||||
| Log Likelihood | −855.11096 | −845.81738 | |||||||
| LR X2 | 350.17 | 368.75 | |||||||
| Goodness of fit | Hosmer-Lemeshow, P = .05 | Hosmer-Lemeshow, P = .66 | |||||||
| Using a cellphone for mental health care search n = 1580 | Female | 0.735(0.312) | 2.1(0.65) | .02 | 1.13–3.84 | 0.72(0.32) | 2.05(0.62) | .02 | 1.1–3.84 |
| Age | −0.051(0.011) | 0.94(0.11) | .0 | 0.92–0.97 | −0.05(0.11) | 0.94(0.11) | .0 | 0.92–0.97 | |
| Ethnicity | 0.494(0.23) | 1.64(0.5) | .09 | 0.91–2.94 | 0.36(0.3) | 1.4(0.43) | .2 | 0.79–2.6 | |
| Married | −0.644(0.329) | 0.52(0.17) | .05 | 0.27–1 | −0.65(0.33) | 0.51(0.17) | .05 | 0.27–0.9 | |
| Education | – | – | – | – | – | – | – | – | |
| Contributive | 0.925(0.39) | 2.52(0.98) | .02 | 1.17–5.43 | 0.96(0.4) | 2.63(1.05) | .01 | 1.2–5.8 | |
| Urban center | −0.35(0.394) | 0.7(0.27) | .39 | 0.32–1.53 | −0.31(0.4) | 0.73(0.29) | .4 | 0.33–1.59 | |
| Depression | – | – | – | – | 0.42(0.32) | 1.52(0.58) | .1 | 0.81–2.86 | |
| Anxiety | – | – | – | – | 0.58(0.32) | 1.7(0.58) | .08 | 0.93–3.3 | |
| Pain | – | – | – | – | 0.72(0.31) | 2(0.62) | .0 | 1.11–3.7 | |
| LR R2 | 54.22 | 70.46 | |||||||
| Log Likelihood | −198.3406 | −190.222 | |||||||
| LR X2 | 0.12 | 0.15 | |||||||
| Goodness of fit | Hosmer-Lemeshow, P = .69 | Hosmer-Lemeshow, P = .57 | |||||||
| Internet use for healthcare search n = 1487 | Female | 0.87(0.13) | 1.09(0.14) | .5 | 0.84–1.42 | 0.1(0.13) | 1.1(0.14) | .4 | 0.84–1.44 |
| Age | −0.06(0.004) | 0.94(0.004) | .0 | 0.93–0.95 | −0.06(0.004) | 0.94(0.004) | .0 | 0.93–0.94 | |
| Ethnicity | 0.38(0.13) | 1.46(0.19) | .004 | 1.12–1.9 | 0.36(0.13) | 1.43(0.19) | .008 | 1.1–1.86 | |
| Married | −0.005(0.13) | 0.99(0.13) | .9 | 0.76–1.2 | −0.003(0.137) | 0.9(0.13) | .9 | 0.76–1.3 | |
| Education | – | – | – | – | – | – | – | – | |
| Contributive | 1.31(0.18) | 3.72(0.67) | .0 | 2.6–5.3 | 1.35(0.18) | 3.86(0.71) | .0 | 2.7–5.5 | |
| Urban center | 1.1(0.18) | 3(0.56) | .0 | 2.06–4.3 | 1.1(0.2) | 2.9(0.57) | .0 | 2.05–4.34 | |
| Depression | – | – | – | – | 0.16(0.15) | 1.1(0.17) | .28 | 0.87–1.56 | |
| Anxiety | – | – | – | – | −0.38(0.17) | 0.68(0.12) | .03 | 0.48 0.96 | |
| Pain | – | – | – | – | 0.49(0.13) | 1.64(0.22) | .0 | 1.24–2.15 | |
| LR R2 | 496.95 | 512.92 | |||||||
| Log Likelihood | −711.49255 | −703.506 | |||||||
| LR X2 | 0.258 | 0.267 | |||||||
| Goodness of fit | Hosmer-Lemeshow, P = .89 | Hosmer-Lemeshow, P = .83 | |||||||
| Internet use for mental healthcare search n = 1487 | Female | 0.1(0.22) | 1.1(0.24) | .6 | 0.71–1.72 | 0.02(0.22) | 1.02(0.23) | .9 | 0.65–1.6 |
| Age | −0.33(0.007) | 0.96(0.007) | .0 | 0.95–0.98 | −0.03(0.007) | 0.96(0.007) | .0 | 0.95–0.98 | |
| Ethnicity | 0.63(0.22) | 1.87(0.4) | .006 | 1.2–2.94 | 0.55(0.22) | 1.74(0.4) | .01 | 1.1 2.74 | |
| Married | −0.79(0.24) | 0.45(0.11) | .002 | 0.23–0.74 | −0.8(0.25) | 0.45(0.11) | .002 | 0.28–0.74 | |
| Education | – | – | – | – | – | – | – | – | |
| Contributive | 1.03(0.3) | 2.8(0.86) | .001 | 1.5–5.1 | 1.1(0.31) | 2.9(0.93) | .0 | 1.6–5.5 | |
| Urban center | −0.14(0.3) | 0.14(0.05) | .0 | 0.–0.29 | −0.09(0.3) | 0.9(0.2) | .7 | 0.5–1.6 | |
| Depression | – | – | – | – | 0.4(0.24) | 1.5(0.37) | .09 | 0.92–2.42 | |
| Anxiety | – | – | – | – | 0.65(0.26) | 1.9(0.5) | .01 | 1.15–3.18 | |
| Pain | – | – | – | – | −0.13(0.23) | 0.86(0.2) | .53 | 0.54–1.37 | |
| LR R2 | 72.9 | 85.95 | |||||||
| Log Likelihood | −311.3654 | −304.842 | |||||||
| LR X2 | 0.104 | 0.123 | |||||||
| Goodness of fit | Hosmer-Lemeshow, P = .21 | Hosmer-Lemeshow, P = .92 | |||||||
The technology survey of the DIADA project was the first survey of the use of health technologies in Colombia designed to understand patients’ patterns of cellphone and internet use by comparing users’ demographic characteristics, their underlying health status, estimation of their mental health status (screening questions), and their preferences in searching for health-related information.
We found that less than 8% of patients attending healthcare centers do not have a cell phone, and more than half have a smartphone, which is consistent with reported cell phone penetration in Colombia.9 Having a smartphone gives the user access to the Internet and apps with the potential of supporting health care decisions.25 The percentage of use indicates that cellphones are a ubiquitous tool for health care information spread and also for clinical interventions.
However, the chances of getting health information support are related to the availability of internet connection, both for information searching and for complete app functionality. In the case of the surveyed patients, this capacity may be limited, given the fact that the majority of patients have a prepaid phone plan, which usually limits internet access. And, indeed, one of the reported potential barriers to adopting health care apps is not having a reliable communication channel.26 Nevertheless, the patients found their phones were very reliable, and they use their devices very frequently, both for messaging and for internet surfing, highlighting the opportunity for using cellphones as a tool for healthcare support. Increasing numbers of free Wi-fi spots are located in Colombia; the Ministry of Communication has installed more than 1500 places around Colombia by 2018, therefore establishing internet communication from a personal device is increasingly becoming a reduced barrier.27
SMS messages have been used for several healthcare programs in underserved areas,28 having mixed efficacy for health-related intervention delivery.29,30 In the surveyed sample, few patients use SMS, in contrast with messenger apps, like Whatsapp. Whatsapp is free if the phone is connected to Wi-fi or available if the user has data access, SMS are not always open or free. However, they are continuously available using the cellphone network. In the future development of phone-based health-related interventions, WhatsApp could be an alternative to SMS for providing therapeutic support and health information.31
Some prior literature has described that cellphone and health-related apps usage may be particularly relevant to younger people with higher socioeconomic status.32 A similar pattern was found in the survey, where the primary urban center (HC1) is leading the use of health-related apps. However, these apps are mainly associated with general health care, but not directly related to programs for caring for specific diagnoses or apps recommended by doctors.32,33 Younger people also tend to navigate the Internet using their cellphone more than using a desktop.34
The development of interventions delivered via digital technology must take into account age, literacy, and acceptability of the mobile phone as a useful tool.35,36 The surveyed population represents urban and semiurban settings with different patterns of technology use; thus, implying that the implementation of technology-based interventions may consider deployment strategies that are responsive to the needs and priorities of each sub-group of potential users.
The surveyed population had more than 40% positive screening for depression. However, very few people use digital technology for mental health searching. Some local situations could explain the patient’s apparent lack of interest. First, mental health care is not a top priority in the health care system in Colombia.37,38 Therefore, its importance could also be underrated by the patients. Second, online health information in Spanish is usually limited, and low quality,39,40 and English literacy in the country is still behind similar economies.41
Moreover, physicians don’t typically recommend the use of apps or internet sites to patients in Colombia, a trend that is similar in other countries.42,43 This lack of physician’s recommendation may suggest to patients that their doctors may not support the use of technology for healthcare intervention and monitoring.44 Future development in digital health, based on cellphones and the web, may consider taking into account not only the perspectives of the patient but also health care providers.45
Interestingly the full multivariate model identifies married women less than 45 years old, from urban centers with contributive health care coverage as more frequent users of the cellphones for internet connection than men. Gender differences have been described in younger populations, where males are more prone to use smartphones for game apps. In contrast, women use the cellphone mainly for multimedia applications and social networking services.46
The literature describes that women are more engaged than men in using the Internet for health-related information searching.47,48 However, we did not find any differences between gender. Yet, in this study, pain is related to increased chances of using a cellphone for health care and mental health care search. In other studies, pain and chronic pain patients are heavy users for information for self-management, encouragement, and comparing experiences of treatment.49 The same patterns of internet searches are present in younger people suffering from pain.50,51 The survey also shows that pain and anxiety are essential drivers for people’s internet searches, both for general healthcare and mental health services, a finding that corresponds with internet surfing patterns that locate anxiety as one of the most searched words in google.52
Limitations of the studyThe survey describes the patients that attend primary care centers. However, the average age of participants was around 45 years old; therefore, the user patterns in younger people were not wholly assessed. This population may have different health care interests, such as substance use, suicide ideation, bullying or sexual orientation, and sexual health.53 The sample in the survey, underrepresent minorities since indigenous and afro-descendant people are less likely to get medical attention in the Colombian health care system. Minorities may have different health interests and face eHealth barriers, such as limited access to computers and an internet connection, technology fears, and cognitive and physical disabilities.54 Although the survey identified participants’ general health status, it did not assess the specific health care issues for which the patients sought care in the health care center. Therefore the relation among ICT patterns of use cannot be related to medical history.
RecommendationsThe patterns of technology use identified in this study are essential for developing future health interventions based on ICT, which should aim to reduce age and education gaps, taking full advantage of cell phone availability and its capability for connecting to the Internet. The present characterization of the population allows us to identify the patterns of technology use in patients that attend a primary health care center and will enable us to understand their main capabilities using the technologies. It should be noted that the physical symptoms in this population were minimal. Still, more than a third of participants had a positive result in the depression screening suggesting that the development of the technology health interventions should take into account mental health as a fundamental element of patient care.
The design of ICT clinical interventions must take into account the cellphone payment plans, availability of internet connection, advantages, and disadvantages of messenger services, including SMS as a possible alternative to people who do not have smartphones. The medical interests of the users, such as pain, anxiety, and general health status, are also relevant. Clinicians should be aware of high-quality Internet health sites and health care phone apps that could be recommended to their patients. Profiling users in health care centers are relevant for future health care apps, an internet web sites design, including patient interest, socioeconomic, education, and ethnic background.
Conflicts of interestThe authors have no conflicts of interest to declare.
FundingThe investigation reported in this publication was financed by the National Institute of Mental Health (NIMH of the National Institutes of Health (NIH) via Grant# 1U19MH109988 (Multiple Principal Investigators: Lisa A. Marsch, PhD and Carlos Gómez-Restrepo, MD PhD). The content of this article is only the opinion of the authors and does not reflect the viewpoints of the NIH or the Government of the United States of America.
Cell Phone Penetration: number of SIM cards or mobile phone number in a country. The data is presented as a percentage, It can exceed 100% due to double counting, for example a person who owns more than one mobile phone line.
Please cite this article as: Suárez-Obando F, Gómez-Restrepo C, Castro-Diaz S, Paez-Rojas P, Uribe-Restrepo JM, Naslund JA, et al. Patrones del uso de tecnologías de información y comunicación digital en pacientes de centros de atención primaria en Colombia: Fase I del proyecto DIADA. Rev Colomb Psiquiat. 2021;50:111.
1. During the last month, have you often been bothered by feeling down, depressed or hopeless? (YES/NO) 2. During the last month, have you often been bothered by little interest or pleasure in doing thing? (YES/NO).
1. During the last month, have you often been bothered by feeling down, depressed or hopeless? (YES/NO) 2. During the last month, have you often been bothered by little interest or pleasure in doing things? (YES/NO).
articles

www.publicationethics.org.