


To determine whether there is a significant relationship between the shape of the time-intensity curve on dynamic gadolinium-enhanced magnetic resonance imaging (MRI) of ovarian tumours classified as indeterminate at ultrasonography and the type of lesion (benign, borderline, or malignant) to enable an accurate presurgical diagnosis.
Material and methodsWe used dynamic contrast-enhanced MRI to study 68 ovarian tumours that were classified as indeterminate at ultrasonography. We included only cases for which a definitive diagnosis (histologic diagnosis or ≥1 year stability on imaging tests) was available. Each case was classified as benign, borderline, or malignant.
To analyse the MRI studies, we marked regions of interest in the lesion and in the myometrium (as a reference). We obtained a curve defined by the relation between the intensity of enhancement and time and classified each tumour according to four predefined curve types. We also analysed semiquantitative parameters. Finally, we compared the results for each of the three groups of tumours.
ResultsWe found significant associations (P<.001) between the curves without early enhancement and benign and borderline lesions as well as between the curves with early enhancement and malignant lesions. Malignant lesions were significantly associated with the semiquantitative enhancement parameters: maximum (P=.002), maximum relative (P=.006), and relative (P=.018).
ConclusionsIn ovarian tumours classified as indeterminate at ultrasonography, dynamic contrast-enhanced MRI can be useful for classification as benign, borderline, or malignant because the malignant lesions are significantly associated with early enhancement curves.
Determinar si existe una relación significativa entre la morfología de la curva intensidad-tiempo del estudio de resonancia magnética (RM) dinámica con gadolinio de los tumores ováricos ecográficamente indeterminados y el tipo de lesión (benigna, borderline o maligna), para poder realizar un diagnóstico prequirúrgico correcto.
Material y métodosSe analizaron 68 tumoraciones ováricas ecográficamente indeterminadas, valoradas mediante RM con secuencia dinámica. Únicamente se incluyeron los casos con diagnóstico histológico o con estabilidad en pruebas de imagen tras al menos un año de seguimiento. Cada caso se clasificó en benigno, borderline o maligno.
Para su análisis, se marcaron regiones de interés en la lesión y en el miometrio (como referencia). Se obtuvo una curva definida por la relación entre la intensidad del realce y el tiempo, cuya morfología permitió clasificar cada tumour dentro de uno de los cuatro tipos de curva predefinidos. También se analizaron parámetros semicuantitativos. Finalmente, se compararon los resultados de cada uno de los tres grupos de tumores.
ResultadosSe demostró una relación significativa (P<,001) entre las curvas sin realce precoz con las lesiones benignas y borderline, y entre las malignas con curvas con realce precoz. Las lesiones malignas se asociaron de forma significativa con los parámetros semicuantitativos de realce: máximo (P=,002), relativo máximo (P=,006) y relativo (P=,018).
ConclusionesEn tumores ováricos ecográficamente indeterminados, la RM dinámica con contraste puede ser útil a la hora de clasificarlos como benignos, borderline o malignos, al mostrar las neoplasias malignas una asociación estadísticamente significativa con curvas con realce precoz.
Ovarian tumours are divided, according to how they behave, into benign, borderline and malignant. Malignant ovarian tumours are the seventh most common form of cancer in women,1 with a high associated mortality rate,2,3 and the leading indication for gynaecological oncological surgery.4 This makes it crucial to have an accurate pre-surgical diagnosis of these lesions.
In patients with an adnexal mass, ultrasound is usually the first test performed.5 However, it cannot always clarify the nature of the mass, in which case they are characterised as indeterminate adnexal tumours.5 The European Society of Urogenital Radiology (ESUR) recommends magnetic resonance imaging (MRI) for these patients.6
In some cases, as can happen when differentiating a borderline from a malignant lesion, conventional MRI sequences are not sufficient to categorise the adnexal tumour.7 With the importance of the preoperative diagnosis being as accurate as possible for planning the therapeutic approach (different in each case),8,9 in recent years there has been growing interest in adding advanced sequences such as diffusion and dynamic gadolinium-enhanced imaging to the usual study protocol5,10–18 in order to make the diagnosis more precise.
The main aim of this study was to assess the role of the dynamic sequence in categorising ultrasound-indeterminate ovarian tumours. We focused on a descriptive analysis based on the shape of the curves obtained (which relate the lesion enhancement and time), while also assessing semi-quantitative parameters (relative, maximum and relative maximum enhancement and area under the curve [AUC]). In particular, the aim was to assess the efficacy of this sequence for detecting malignant lesions, in order to optimise diagnosis by MRI and thus help plan the most appropriate surgical approach.
Material and methodsDescription of the sampleWe carried out a retrospective observational study based on a review of the pelvic MRI studies requested by the Gynaecology Department to complete investigation of an ultrasound-indeterminate adnexal mass, performed from November 2016 (there were no dynamic studies in our department prior to that date) to July 2019. Therefore, these cases were based on an initial gynaecological examination categorised by the IOTA (International Ovarian Tumor Analysis)19 score as "intermediate or inconclusive". We performed a search in the Department of Radiodiagnosis Information System using the following strategy: Genitourinary system – Genitalia – Ovary – Neoplasm, "Neoplasia-like" conditions. Only tests performed on females aged over 18 were included. In the case of bilateral lesions, we decided to analyse each mass separately. Once the search was completed, we first excluded lesions in which the vascularisation could not be analysed in the dynamic sequence, and then lesions for which we were unable to make a definitive diagnosis. The definitive diagnosis was established from the pathology result (reference standard) or, in cases where no surgical specimen was available, stability of the lesion on imaging tests (ultrasound or MRI) for at least one year. Last of all, each case was classified into one of the three established groups: benign, borderlineor malignant.
The entire study was carried out following the principles for medical research in humans, according to the criteria of the Declaration of Helsinki.20 Informed consent was not required from the patients; as this was a retrospective study on data obtained from MRI already performed, it did not involve any change in attitude to their diagnosis and management.
Technical descriptionThe studies prior to September 2017 were performed on a Philips Intera 1.0T MRI machine, and after that date a Philips Ingenia 1.5T. A pelvic phased-array antenna was used.
The study was carried out after at least three hours of fasting. No drugs were administered to combat the effect of peristalsis.
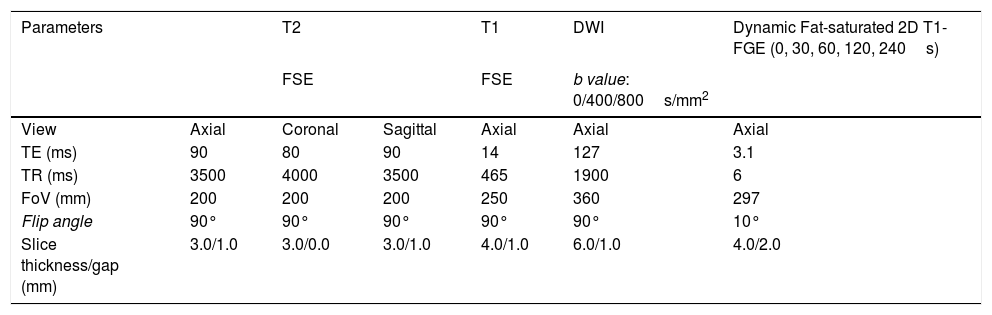
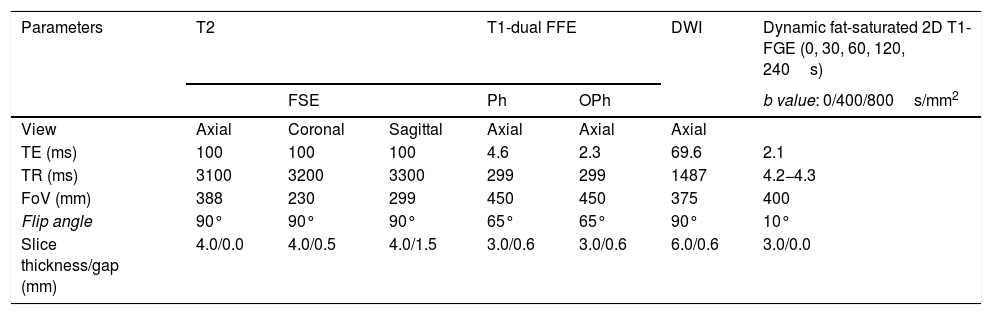
Tables 1 and 2 show the sequences included in the study protocol. For the dynamic study, images were acquired without contrast and then after administration of contrast at 30, 60, 120 and 240s (Fig. 1). For this study, intravenous gadoteric acid was used at a dose of 0.1mmol/kg at 4mL/s.
Study protocol performed on Philips Intera 1.0T MRI scanner.
| Parameters | T2 | T1 | DWI | Dynamic Fat-saturated 2D T1-FGE (0, 30, 60, 120, 240s) | ||
|---|---|---|---|---|---|---|
| FSE | FSE | b value: 0/400/800s/mm2 | ||||
| View | Axial | Coronal | Sagittal | Axial | Axial | Axial |
| TE (ms) | 90 | 80 | 90 | 14 | 127 | 3.1 |
| TR (ms) | 3500 | 4000 | 3500 | 465 | 1900 | 6 |
| FoV (mm) | 200 | 200 | 200 | 250 | 360 | 297 |
| Flip angle | 90° | 90° | 90° | 90° | 90° | 10° |
| Slice thickness/gap (mm) | 3.0/1.0 | 3.0/0.0 | 3.0/1.0 | 4.0/1.0 | 6.0/1.0 | 4.0/2.0 |
FOV: field of view; TE: echo time; FGE: fast gradient echo; TR: repetition time; FSE: fast spin echo.
Study protocol performed on Philips Ingenia 1.5T MRI scanner.
| Parameters | T2 | T1-dual FFE | DWI | Dynamic fat-saturated 2D T1-FGE (0, 30, 60, 120, 240s) | |||
|---|---|---|---|---|---|---|---|
| FSE | Ph | OPh | b value: 0/400/800s/mm2 | ||||
| View | Axial | Coronal | Sagittal | Axial | Axial | Axial | |
| TE (ms) | 100 | 100 | 100 | 4.6 | 2.3 | 69.6 | 2.1 |
| TR (ms) | 3100 | 3200 | 3300 | 299 | 299 | 1487 | 4.2−4.3 |
| FoV (mm) | 388 | 230 | 299 | 450 | 450 | 375 | 400 |
| Flip angle | 90° | 90° | 90° | 65° | 65° | 90° | 10° |
| Slice thickness/gap (mm) | 4.0/0.0 | 4.0/0.5 | 4.0/1.5 | 3.0/0.6 | 3.0/0.6 | 6.0/0.6 | 3.0/0.0 |
FOV: field of view; GRE: gradient echo; Ph: phase; FFE: Fast Field Echo; Oph: opposed-phase; TE: echo time; FGE: fast gradient echo; TR: repetition time; FSE: fast spin echo.

All the studies were analysed on the Philips Portal IntelliSpace workstation. The studies were processed and the results compiled by two radiologists: a consultant doctor with more than 20 years of experience and a second/third year resident doctor who had received specific training in this field. When analysing the dynamic sequences, they did not have access to the rest of the sequences of the MRI study or to that report, or to the patients' medical records, so they did not know the final diagnosis in each case.
Analysis of the dynamic sequenceTwo regions of interest were marked: one in the myometrium (as an internal reference, to overcome the limitation of lack of reproducibility)14,21 and another in the area of greatest enhancement of the solid part of the lesion (avoiding areas of necrosis or bleeding).
For descriptive analysis, each case was classified according to the shape of the curve obtained. For this study, we decided to use a classification based on four types of curve (Fig. 2): type 1 (no or very little enhancement); type 2 (progressive enhancement); type 3 (maximum early enhancement followed by plateau phase); and type 4 (maximum early enhancement followed by early washout).22 Lastly, for statistical analysis, the first two types were grouped as curves “without early enhancement” and the last two as “with early enhancement”, due to their respective associations with being benign and malignant. Many of the published papers on the role of the dynamic sequence, including those on ovarian tumours reviewed for this study,4,11,14,23–29 classify enhancement curves into only three types. In our study, types 3 and 4 curves would both come under the type 3 curves of the other studies, where they group together all curves with maximum early enhancement, whether they are followed by a plateau phase or early washout.

The last step was to collect the data necessary for the semi-quantitative analysis: maximum enhancement, considered as the maximum signal intensity of the lesion (arbitrary units of intensity); relative enhancement, as the increase in signal with respect to the phase without contrast (%); maximum relative enhancement, as “maximum signal” - “baseline signal”/“baseline signal” (%); and the AUC, which refers to the number of pixels of the lesion which have enhancement, in all the phases added together. Entry and exit velocities were not analysed due to the lack of standardisation in the injection times of the contrast medium.
Statistical analysisAll the statistical analyses were performed using the IBM SPSS Statistics software, version 21. The relationship between tumour type and curve types was analysed using the χ2 test, while the non-parametric Kruskal-Wallis test was used for the relationship between tumour type and the semi-quantitative values. Results with P<.05 were considered significant.
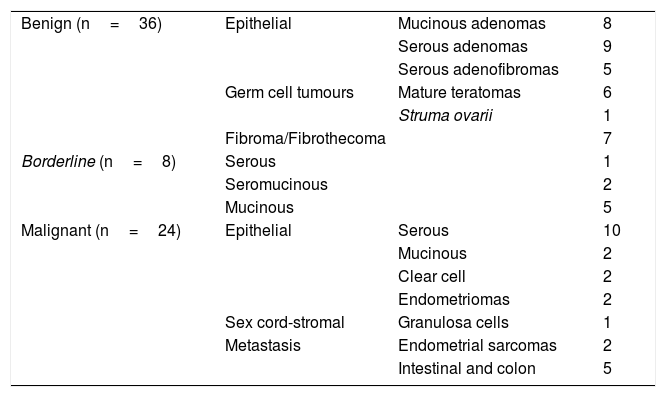
ResultsIn total, 62 pelvic MRI studies with dynamic sequence from November 2016 to July 2019 were preselected: 29 performed on the 1.0T machine and 33 on the 1.5T machine. The patients had a mean age of 55.4 (range 18–88). In 16 cases, bilateral ovarian tumours were identified, from which a total of 78 lesions were preselected (Fig. 3). We excluded seven lesions (all unilateral) because it was not possible to detect any area in which to analyse their vascularisation in which a non-cancer cause was finally confirmed: six endometriomas and one peritoneal inclusion cyst. Of the 71 lesions analysed, three lesions (unilateral), which at the time of analysis did not have a pathology result or meet the follow-up criteria, were excluded: two patients with suspected mature teratomas and one patient with suspected borderline tumour (diagnosed with another malignant neoplasm, for which the management of this lesion was postponed). Therefore, the final diagnosis was obtained in 68 lesions: 56 from pathology examination of the surgical specimen and 12 from their stability over time in imaging tests. From the images (both ultrasound and MRI), the latter were all suspected to be benign lesions: two serous adenomas, one mucinous adenoma, one adenofibroma, two fibromas and four mature teratomas. With regard to the nature of the lesions in the overall final sample: 36 tumours were benign, 8 borderline and 24 malignant (Table 3).

Breakdown of the types of tumour in the overall study sample.
| Benign (n=36) | Epithelial | Mucinous adenomas | 8 |
| Serous adenomas | 9 | ||
| Serous adenofibromas | 5 | ||
| Germ cell tumours | Mature teratomas | 6 | |
| Struma ovarii | 1 | ||
| Fibroma/Fibrothecoma | 7 | ||
| Borderline (n=8) | Serous | 1 | |
| Seromucinous | 2 | ||
| Mucinous | 5 | ||
| Malignant (n=24) | Epithelial | Serous | 10 |
| Mucinous | 2 | ||
| Clear cell | 2 | ||
| Endometriomas | 2 | ||
| Sex cord-stromal | Granulosa cells | 1 | |
| Metastasis | Endometrial sarcomas | 2 | |
| Intestinal and colon | 5 | ||
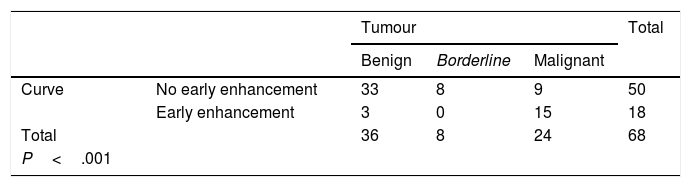
We obtained 15 type 1 curves, 35 type 2 curves, 16 type 3 curves and 2 type 4 curves. After grouping them together, a total of 50 curves (15+35) were included in the "without early enhancement" group, and 18 curves (16+2) were included in the "with early enhancement" group.
Curves "without early enhancement" were found in 91.67% of the benign tumours and 100% of the borderline tumours (Figs. 4 and 5), but in 37.5% of the malignant tumours. Curves "with early enhancement" were found in 62.5% of the malignant tumours (Fig. 6), but only 8.3% of benign tumours. The differences between the curves for the benign and borderline tumours and those of malignant tumours were significant (P<.001 in the χ2 test) (Table 4).
. These septa showed very poor uptake after contrast administration, as can be seen in the maximum enhancement map (B). After marking the region of interest, a type 1 curve (blue curve: lesion; orange curve: myometrium) is obtained on one of them (arrow) (C). Pathology examination of the lesion confirmed the diagnosis of ovarian mucinous cystadenoma.")
Example of a benign ovarian tumour. A 23-year-old woman with a tumour in the right adnexa to be investigated. The T2-weighted magnetic resonance imaging sequence shows a cystic lesion with thin septa (A). These septa showed very poor uptake after contrast administration, as can be seen in the maximum enhancement map (B). After marking the region of interest, a type 1 curve (blue curve: lesion; orange curve: myometrium) is obtained on one of them (arrow) (C). Pathology examination of the lesion confirmed the diagnosis of ovarian mucinous cystadenoma.
. After the administration of gadolinium, some areas of the lesion showed slight enhancement, as seen on the maximum enhancement map (B). One of the nodules (arrow) was marked as a region of interest, obtaining a curve (blue curve: lesion; orange curve: myometrium) which showed progressive enhancement; therefore, a type 2 curve (C). The patient was operated on and the diagnosis of a borderline mucinous adnexal tumour was confirmed.")
Example of a borderline ovarian tumour. A 62-year-old woman with a cystic abdominal-pelvic lesion attached to the left adnexa, with multiple thin septa and some nodules and locules of different intensities in the T2-weighted sequence (A). After the administration of gadolinium, some areas of the lesion showed slight enhancement, as seen on the maximum enhancement map (B). One of the nodules (arrow) was marked as a region of interest, obtaining a curve (blue curve: lesion; orange curve: myometrium) which showed progressive enhancement; therefore, a type 2 curve (C). The patient was operated on and the diagnosis of a borderline mucinous adnexal tumour was confirmed.
 also had multiple solid nodules (A). The maximum enhancement map showed the strong uptake of gadolinium by both the thick septa and the left nodules (B). One of the left mural nodules (arrow) was chosen as a region of interest, obtaining a curve (blue curve: lesion; orange curve: myometrium) with a maximum early enhancement followed by a plateau phase and, therefore, a type 3 curve (C). A bilateral adnexectomy was performed, with pathology examination confirming bilateral serous carcinoma.")
Example of a malignant ovarian tumour. A 60-year-old woman with bilateral ovarian tumours, both polycystic and multiseptated with thick septa; the left (larger) also had multiple solid nodules (A). The maximum enhancement map showed the strong uptake of gadolinium by both the thick septa and the left nodules (B). One of the left mural nodules (arrow) was chosen as a region of interest, obtaining a curve (blue curve: lesion; orange curve: myometrium) with a maximum early enhancement followed by a plateau phase and, therefore, a type 3 curve (C). A bilateral adnexectomy was performed, with pathology examination confirming bilateral serous carcinoma.
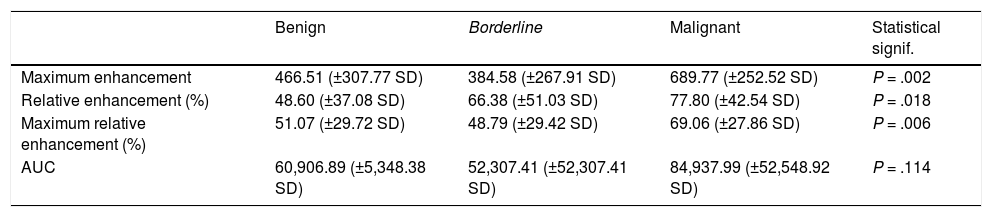
The Kruskal-Wallis test showed a statistically significant relationship between the malignant tumour group and the highest values of the following parameters: maximum enhancement (P = .002), maximum relative enhancement percentage (P = .006) and relative enhancement percentage (P = .018); in contrast, there was no statistically significant relationship between the AUC value and malignant tumours (P = .114) (Table 5). Maximum enhancement was the parameter that proved to be most reliable for the detection of malignant lesions, with a sensitivity of 70.8% and a specificity of 72.7% in tumours with a maximum enhancement greater than 568.45 (in arbitrary units of intensity).
Means and standard deviations of the values for the semiquantitative parameters in each group of tumours. Statistical significance (Kruskal-Wallis test) of the differences between the group of malignant tumours and the other two groups.
| Benign | Borderline | Malignant | Statistical signif. | |
|---|---|---|---|---|
| Maximum enhancement | 466.51 (±307.77 SD) | 384.58 (±267.91 SD) | 689.77 (±252.52 SD) | P = .002 |
| Relative enhancement (%) | 48.60 (±37.08 SD) | 66.38 (±51.03 SD) | 77.80 (±42.54 SD) | P = .018 |
| Maximum relative enhancement (%) | 51.07 (±29.72 SD) | 48.79 (±29.42 SD) | 69.06 (±27.86 SD) | P = .006 |
| AUC | 60,906.89 (±5,348.38 SD) | 52,307.41 (±52,307.41 SD) | 84,937.99 (±52,548.92 SD) | P = .114 |
The results of our study show that including the dynamic sequence in the MRI protocol for the study of an adnexal tumour helps to identify malignant ovarian tumours.
Dynamic study makes it possible to assess the changes in a lesion's signal intensity after the administration of gadolinium at different times, with this being related to tumour neoangiogenesis. That makes it more sensitive than other sequences in detecting malignant lesions30 as, being more neovascularised, they will show faster and more intense enhancement. Although the use of this sequence is increasingly standardised in the study of neoplasms in other locations (breast, prostate, etc31–33), that is not the case with the ovaries. However, there is increasing interest in its role in the categorisation of adnexal tumours.
The dynamic study allows quantitative (in relation to pharmacokinetic parameters) and semi-quantitative and/or descriptive analysis; the descriptive is based on analysis of the shape of the curve, which relates the intensity of enhancement with time.
Focusing on the main objective of our study, which was to assess the role of the type of curve in identifying malignant ovarian tumours and differentiating them from borderline, our results show a significant relationship between curves with early enhancement and malignant lesions, while borderline and benign lesions were associated with curves with a late enhancement pattern. These data seem to corroborate the results obtained in the few studies published to date.4,11,24–29 An important part of the literature in this regard are the studies and reviews by Thomassin-Naggara,4,11,14,23 which relate the curves with early enhancement and malignant tumours.
In terms of the semi-quantitative analysis, there is a lack of consensus among the published studies4,24–26,28,29,34–36 on which parameters should be given more importance. In our case, the results obtained show a significant relationship between the amplitude of the semi-quantitative parameters related to enhancement (maximum, relative and maximum relative) and the possibility of malignant adnexal lesions.
Although there are other studies that more specifically analyse the shape of the intensity-time curves and the semi-quantitative parameters of the dynamic study,24–26,28,29 only a few classify tumours as benign, borderline and malignant as we did. This differentiation is crucial when determining the treatment approach in each case: while benign tumours do not usually require surgical resection (except for individualised cases involving clinical manifestations, risk of torsion, the patient's express wish, etc), borderline and malignant tumours do.8,9 Moreover, borderline and malignant tumours require different types of surgery, the planning of which is facilitated by the MRI results, and may in some cases mean a change of hospital to perform the procedure.
Excluding the work of Singla et al.,29 with few cases and only two borderline tumours, only Li et al.26 considered the behaviour of borderline tumours as a separate tumour group. They found that the type of curve makes it possible to differentiate malignant lesions from borderline and benign lesions (83% sensitivity and 75% specificity); just as in our study, they found a statistically significant association between borderline lesions and curve types without early enhancement. In their semiquantitative analysis (mean time to enhancement, maximum slope and maximum enhancement), unlike our study, they did not find significant differences between malignant and borderline tumours.
It is also interesting that some of the above studies simultaneously assessed the value of diffusion-weighted sequences for this same task. However, they found that, although useful, they were less so than dynamic studies.11,29
The limitations of our study include the fact that it was retrospective, that it was carried out in a single centre and that two MRI machines with different intensity of magnetic field were used; this can affect the type of sample analysed, but we did not conduct a comparative study of the examinations performed on one and the other machine. Also, one of the main limitations was the fact that we performed a dynamic study with several acquisitions, which is an obvious disadvantage compared to the perfusion study: lower temporal resolution30 and therefore less accuracy when determining the type of curve and assessing semi-quantitative parameters such as "early enhancement" and "entry and exit velocities". However, it should be noted that the results obtained in both our study and that of Mansour25 show hardly any differences with respect to those involving perfusion4,11,24,26–29 in the value for the descriptive analysis of the type of curve. Another limitation of ours is the small number of borderline tumours; only eight of the 68 cases in our study.
ConclusionsThis study shows that when assessing ultrasound-indeterminate ovarian tumours, the dynamic sequence with gadolinium is very useful for categorising them as benign, borderline or malignant. The association of malignant tumours with the early enhancement curves and with semi-quantitative enhancement parameters allows us to differentiate these tumours from benign and borderline lesions.
Therefore, in this context, including this sequence in the MRI study protocol can be of great help in making a more reliable preoperative diagnosis.
Authorship- 1
Person responsible for the integrity of the study: SAC and JCGO.
- 2
Study concept: SAC and JCGO.
- 3
Study design: SAC and JCGO.
- 4
Data acquisition: SAC and MFC.
- 5
Analysis and interpretation of the data: SAC and JCGO.
- 6
Statistical processing: SAC and JCGO.
- 7
Literature search: SAC and MFC.
- 8
Drafting of the manuscript: SAC.
- 9
Critical review of the manuscript with relevant intellectual contributions: SAC, JCGO and MFC.
- 10
Approval of the final version: SAC, JCGO and MFC.
This review received no specific grants from public agencies, the commercial sector or non-profit organisations.
Conflicts of interestThe authors declare that they have no conflicts of interest.
Please cite this article as: Amado Cabana S, Gallego Ojea JC, Félez Carballada M. Utilidad de la resonancia magnética dinámica con contraste para caracterizar tumores ováricos ecográficamente indeterminados. Radiología. 2022;64:110–118.

