


Soft tissue tumours (STT) constitute a heterogeneous group of lesions frequently studied by Magnetic Resonance Imaging (MRI). It has not yet been clearly established whether the inclusion of apparent diffusion coefficient (ADC) diffusion-weighted imaging (DWI) maps would better determine tumour aggressiveness.
PurposeTo assess the diagnostic value of quantitative ADC DWI maps in the initial diagnosis of STT; and to determine whether the inclusion of DWI provides more valuable information than conventional sequences alone.
Material and methodsRetrospective study of patients with histologically proven STT. Conventional morphological MRI sequences and the DWI sequence were analysed. The ADC was quantified using a region of interest (ROI) that covered the largest sectional area (global ADC) and another that selected the area of greatest restriction (selected ADC). Differences in ADC values were analysed between both benign and malignant lesions and high and low-grade sarcomas. A multivariate analysis was performed to determine the ability of ADC to adequately diagnose the nature of STTs when associated with other morphological characteristics.
Results84 patients with STT, of which 40 were benign and 44 malignant. The malignant group included 10 low-grade sarcomas, 23 high-grade sarcomas, 4 non-sarcomatous neoplasms and 7 sarcomas with no histological grading. The ADC values were significantly higher in benign lesions for the selected ADC. Significantly higher selected ADC values were also obtained in low-grade sarcomas. In the multivariate analysis, the highest diagnostic precision values were obtained when morphological features and ADC were included, with a sensitivity, specificity, and area under the curve (AUC) of 84, 75 and 91%, respectively.
ConclusionThe inclusion of ADC DWI values improves the diagnostic accuracy of MRI for STTs, especially when used in combination with conventional MRI sequences.
Los tumores de partes blandas (TPB) constituyen un grupo heterogéneo de lesiones estudiadas con frecuencia mediante resonancia magnética (RM). Aún no se ha establecido claramente si la inclusión de mapas de imágenes potenciadas en difusión (DWI, diffusion-weighted imaging) con coeficiente de difusión aparente (ADC, apparent diffusion coefficient) ayudaría a determinar mejor la agresividad del tumor.
ObjetivosDeterminar el valor diagnóstico de los mapas cuantitativos del ADC en el diagnóstico inicial de los TPB; y determinar si la inclusión de la difusión proporciona información más valiosa que las secuencias convencionales por sí solas.
Materiales y métodosEstudio retrospectivo de pacientes con TPB confirmados histológicamente. Se analizaron las secuencias morfológicas convencionales de RM y la secuencia de difusión. El ADC se cuantificó utilizando una región de interés (ROI, region of interest) que abarcaba la mayor área seccional (ADC global) y otra que seleccionaba el área de mayor restricción (ADC seleccionado). Se analizaron las diferencias en los valores de ADC entre las lesiones benignas y malignas y los sarcomas de alto y bajo grado. Se realizó un análisis multivariante para determinar la capacidad del ADC para diagnosticar adecuadamente la naturaleza de los TPB cuando se asocia a otras características morfológicas.
Resultados84 pacientes con TPB, de los cuales 40 eran benignos y 44 malignos. Entre los malignos se incluían 10 sarcomas de bajo grado, 23 sarcomas de alto grado, 4 neoplasias no sarcomatosas y 7 sarcomas sin gradación histológica. Los valores ADC fueron notablemente superiores en las lesiones benignas para el ADC seleccionado. También se obtuvieron valores de ADC seleccionado notablemente superiores en los sarcomas de bajo grado. En el análisis multivariante, los valores más altos de precisión diagnóstica se obtuvieron cuando se incluyeron las características morfológicas y el ADC, con una sensibilidad, especificidad y área bajo la curva (ABC) del 84, 75 y 91%, respectivamente.
ConclusiónLa inclusión de los valores ADC de las imágenes de difusión mejora la precisión diagnóstica de la RM para los TPB, especialmente cuando se utiliza en combinación con secuencias de RM convencionales.
Soft tissue tumors (STT) are a heterogeneous group of lesions which normally manifest as a palpable mass. Many soft tissue tumors can be labelled benign according to their clinical characteristics, and their management is limited to clinical follow-up or direct excision. However, a significant percentage of these lesions are indeterminate or suspected of malignancy, and the next diagnostic step is completed with imaging techniques.1–3
MRI is the imaging modality of choice for characterizing STTs due to its multiplanar capacity, its high contrast, and high spatial resolution. Despite these advantages, between one-quarter and one-third of all lesions studied with conventional MRI sequences are indeterminate, so it is often necessary to perform a histological study.3,4
It would be desirable to minimize the number of lesions requiring histological analysis and perform biopsy efficiently and in the most representative area of the tumor, especially when it is malignant.5,6
In addition, the preoperative histological grading of sarcomas is often complicated by sample heterogeneity or its poor representativeness of the neoplasm histology. Therefore, it is necessary that imaging techniques, specifically MRI, are used to reliably determine the nature and degree of malignancy of STTs.7–9
The role of advanced MRI sequences, such as diffusion-weighted imaging (DWI) and dynamic contrast enhancement (DCE), has been assessed in the study of different pathologies, particularly in the field of STTs. These advanced sequences provide functional information and facilitate the acquisition of parametric maps, allowing an approximation of the cellular nature of the lesions.10,11
Different studies have addressed the role of DWI in the diagnosis of STT, but results clarifying its usefulness have been inconclusive. In many cases, these studies are single centred, with small patient samples and non-standardised protocols, making it difficult to determine the true diagnostic efficacy of DWI.12–19
Considering all, the main objective of this study is to evaluate the usefulness of DWI in differentiating not only benign from malignant lesions but also high- from low-grade sarcomas and to determine whether DWI adds value to conventional sequences in the initial diagnosis of STT.
MethodsStudy populationThis was a retrospective, multicentric, observational study of patients evaluated by MRI, with clinical suspicion of STT, who were subsequently analysed histologically, either through biopsy or surgery. This histological result was considered the reference standard. In the case of sarcomas, the histological grade (from I to III) was recorded according to the classification of the FNCLCC (Fédération Nationale des Centers de Lutte Contre le Cancer) and subclassified as low (histological grade I) and high grade (histological grade II and III).
The study received approval from the Ethics Committee (“Blinded”), and the need to obtain informed consent was waived.
A search was carried out through the internal databases from January 2015 to January 2021. Patients were evaluated with 10 MRI equipment from 7 different centres, ranging from tertiary hospitals to outpatient centres.
The inclusion criteria were MRI of the extremities for clinical suspicion of STT, availability of morphological and DWI sequences for diagnosis, and histological confirmation of the STT.
The exclusion criteria were biopsy or surgery prior to MRI, or neoadjuvant treatment prior to MRI.
Equipment and MRI sequencesAll scans were performed with high-field strength magnets (1.5T) from different commercial manufacturers, and with surface or dedicated limb coils depending on the individual characteristics of the patient.
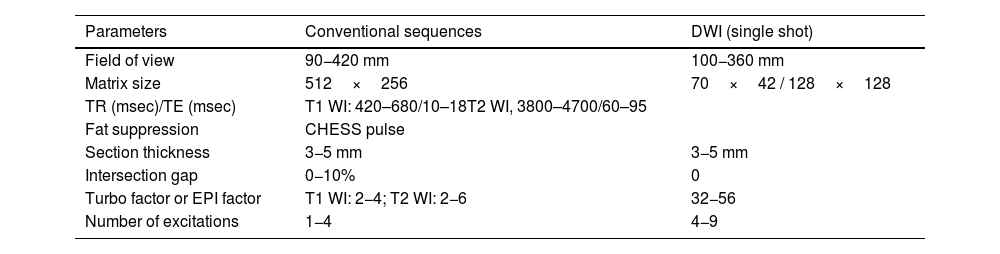
All studies met the following standard criteria: Morphological and liquid-sensitive MRI sequences at least in two planes to cover the entire length of the lesion; postcontrast sequences at least in two planes; DWI sequences with fat saturation and at least two b values (usually 50 and 800mm/s2). Table 1.
MR imaging parameters.
| Parameters | Conventional sequences | DWI (single shot) |
|---|---|---|
| Field of view | 90−420 mm | 100−360 mm |
| Matrix size | 512×256 | 70×42 / 128×128 |
| TR (msec)/TE (msec) | T1 WI: 420–680/10–18T2 WI, 3800–4700/60–95 | |
| Fat suppression | CHESS pulse | |
| Section thickness | 3−5 mm | 3−5 mm |
| Intersection gap | 0−10% | 0 |
| Turbo factor or EPI factor | T1 WI: 2−4; T2 WI: 2−6 | 32−56 |
| Number of excitations | 1−4 | 4−9 |
TR repetition time, TE echo time, EPI echoplanar imaging, CHESS chemical shift selective, DWI diffusion- weighted imaging.
Images were analyzed blindly (without knowledge of the histological diagnosis) by three MRI-specialist radiologists with 7, 9 and 12 years of experience in musculoskeletal MRI.
- a)
The first radiologist (R1) determined the following morphological characteristics of each STT: Size: largest diameter in cm, measured in the liquid-sensitive sequences. Depth: superficial or deep location related to deep peripheral muscular fascia, determined in the T2 turbo spin-echo (TSE) axial sequence. Perilesional oedema: hyperintense areas exceeding the margin of the lesion in the liquid-sensitive sequences. Peripheral nodular enhancement: rounded foci (greater than 2mm) of contrast uptake in the post Gadolinium injection T1 FS sequence at the limits of the lesion. Heterogeneity of the lesion in T2 TSE: at least one third of the area with changes in signal intensity. And areas of cystic necrosis: hypointense foci of at least 2mm, without enhancement in T1 FS post Gadolinium (Fig. 1).
 Long axis measurement (red line) and perilesional edema determination (white arrows) on coronal T2FS WI. (B) Deep tumor (white arrow) according to the relationship with the superficial fascia (orange dots), and heterogeneous lesion with at least one third of the area with changes in signal intensity. (C) Peripheral nodular foci enhancement (white arrows) on T1FS WI post gadolinium, and areas of cystic necrosis: hypointense foci of at least 2mm, without enhancement in T1 FS post Gadolinium (black arrows).") Figure 1.
Figure 1.Determination of STT morphological characteristics in an undifferentiated pleomorphic sarcoma in a 56-year-old woman. (A) Long axis measurement (red line) and perilesional edema determination (white arrows) on coronal T2FS WI. (B) Deep tumor (white arrow) according to the relationship with the superficial fascia (orange dots), and heterogeneous lesion with at least one third of the area with changes in signal intensity. (C) Peripheral nodular foci enhancement (white arrows) on T1FS WI post gadolinium, and areas of cystic necrosis: hypointense foci of at least 2mm, without enhancement in T1 FS post Gadolinium (black arrows).
- b)
DWI was evaluated by two radiologists (R2 and R3), independently. Based on the morphological sequences, the two radiologists drew in the picture archiving and communication system (PACS) station (Agfa Health care Impax 6, Mortsel, Belgium) a freehand or round region of interest (ROI) on the ADC map of the STT, proceeding in two ways: Including the largest lesion area in the axial plane, taking care not to exceed the edges of the lesion (total ADC). In areas of greatest diffusion restriction, with a minimum size of 1 cm2, and attempting to avoid areas of necrosis, calcification, or haemorrhage (selected ADC). The mean values (in mm2/s) and SD of the quantitative ADC map were recorded (Fig. 2).
. (A) High b value DWI (800s/mm2) with heterogeneous diffusion restriction (arrows). (B) ADC map with freehand ROI (red line) which includes the largest lesion area in the axial plane, taking care not to exceed the edges of the lesion (global ADC). (C) ADC map with circular ROI (red circle) in the greatest diffusion restriction zone, attempting to avoid areas of necrosis, calcification or hemorrhage (selected ADC).") Figure 2.
Figure 2.Undifferentiated pleomorphic sarcoma of the thigh in a 56-year-old woman (same as in Fig. 1). (A) High b value DWI (800s/mm2) with heterogeneous diffusion restriction (arrows). (B) ADC map with freehand ROI (red line) which includes the largest lesion area in the axial plane, taking care not to exceed the edges of the lesion (global ADC). (C) ADC map with circular ROI (red circle) in the greatest diffusion restriction zone, attempting to avoid areas of necrosis, calcification or hemorrhage (selected ADC).
 Long axis measurement (red line) and perilesional edema determination (white arrows) on coronal T2FS WI. (B) Deep tumor (white arrow) according to the relationship with the superficial fascia (orange dots), and heterogeneous lesion with at least one third of the area with changes in signal intensity. (C) Peripheral nodular foci enhancement (white arrows) on T1FS WI post gadolinium, and areas of cystic necrosis: hypointense foci of at least 2mm, without enhancement in T1 FS post Gadolinium (black arrows).")
. (A) High b value DWI (800s/mm2) with heterogeneous diffusion restriction (arrows). (B) ADC map with freehand ROI (red line) which includes the largest lesion area in the axial plane, taking care not to exceed the edges of the lesion (global ADC). (C) ADC map with circular ROI (red circle) in the greatest diffusion restriction zone, attempting to avoid areas of necrosis, calcification or hemorrhage (selected ADC).")
Morphological characteristics and quantitative parameters of DWI were correlated with the benign or malignant nature of the lesion and with neoplasm aggressiveness in cases of malignant lesions.
Quality of DWI was evaluated in consensus by both radiologists on a 4-point Likert scale: Grade 1: optimal images for diagnosis. Grade 2: presence of isolated and/or mild artefacts that do not interfere with the interpretation of the images. Grade 3: presence of moderate artefacts that do not impede the interpretation of the images. Grade 4: uninterpretable images that are not valid for the study.
Statistical analysisThe statistical analysis was carried out with SPSS v.20.0 (IBM, Armonk, New York). Student’s t test and Wilcoxon’s rank-sum test were used for the analysis of the quantitative variables, and the chi-square test or Fisher’s test for qualitative variables. In all cases, p<0.05 was considered statistically significant. The analysis of the interobserver agreement was conducted through the intraclass correlation coefficient (ICC). To determine the diagnostic accuracy of the ADC and multiparametric models, receiver operating characteristic (ROC) curve analysis was accomplished, and the areas under the curve (AUCs) were calculated. The relationship between the epidemiological variables of the sample and the morphological characteristics of the lesions with respect to their benign or malignant natures was evaluated using the chi-squared test and odds ratio (OR). The relationship between the malignant or benign nature of the lesion and the morphological variables, total ADC and selected ADC as continuous variables was analyzed by multivariate logistic regression with ROC curve analysis and the corresponding AUCs.
ResultsStudy populationA total of 84 lesions from 84 different patients (42 women and 42 men) were included in the final sample. Mean age of the patients was 54 years (range, 18–86 years) (Fig. 3).

The histological analysis was carried out either by biopsy (26 lesions) or surgical specimen (58 lesions).
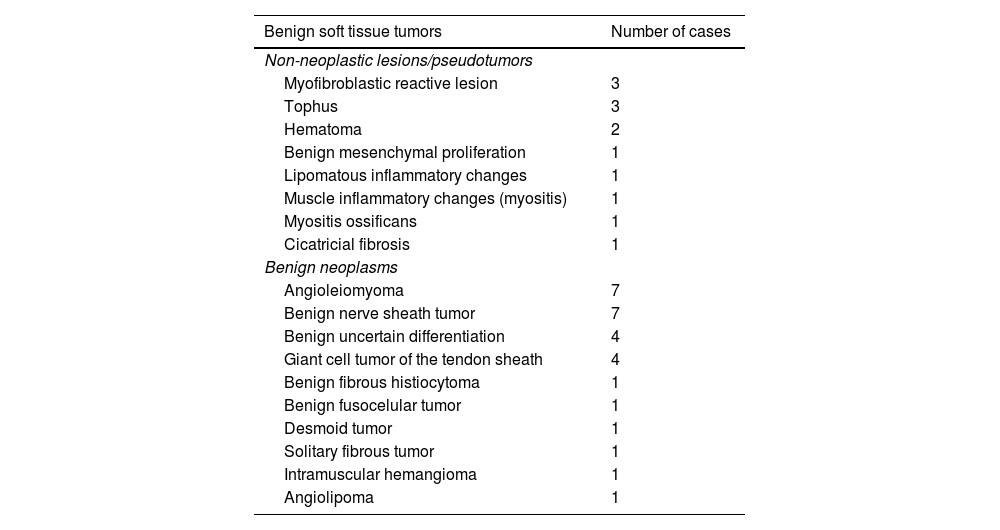
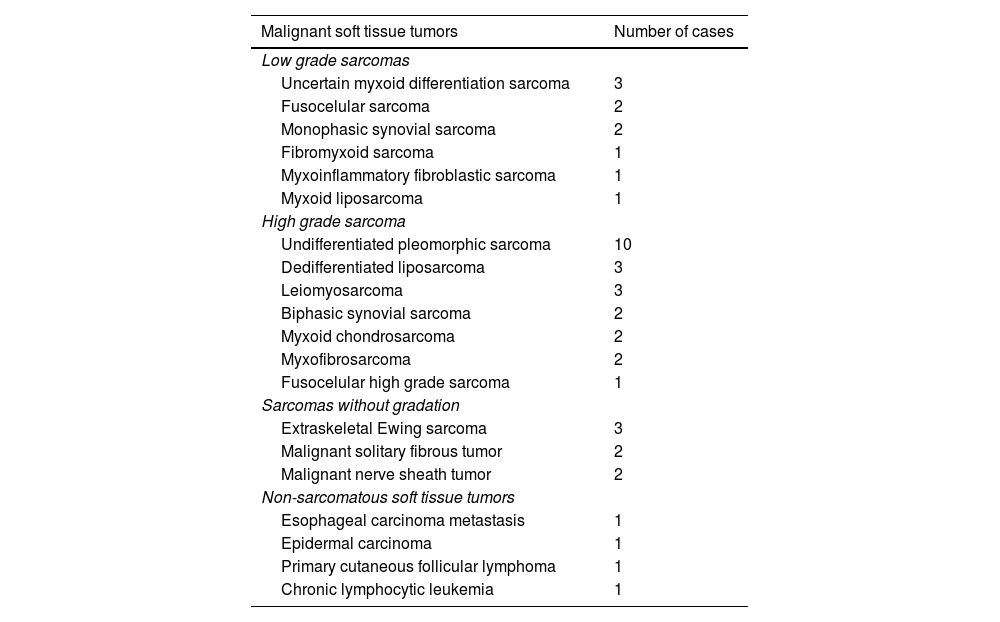
40 lesions were benign, and 44 were malignant tumors (Table 2). Most of the malignant tumors were sarcomas (40 of 44, 91%), and of these, 10 lesions (23%) were low-grade sarcomas. In addition, 23 lesions (52%) were high-grade sarcomas (8 grade II, and 15 grade III). A total of 7 sarcomas were not classified according to their histological grading, either because the histological grade was not included in the pathology report or because the classification was not appropriate according to the histology (Table 3).
Histologic types of malignant soft tissue tumors.
| Benign soft tissue tumors | Number of cases |
|---|---|
| Non-neoplastic lesions/pseudotumors | |
| Myofibroblastic reactive lesion | 3 |
| Tophus | 3 |
| Hematoma | 2 |
| Benign mesenchymal proliferation | 1 |
| Lipomatous inflammatory changes | 1 |
| Muscle inflammatory changes (myositis) | 1 |
| Myositis ossificans | 1 |
| Cicatricial fibrosis | 1 |
| Benign neoplasms | |
| Angioleiomyoma | 7 |
| Benign nerve sheath tumor | 7 |
| Benign uncertain differentiation | 4 |
| Giant cell tumor of the tendon sheath | 4 |
| Benign fibrous histiocytoma | 1 |
| Benign fusocelular tumor | 1 |
| Desmoid tumor | 1 |
| Solitary fibrous tumor | 1 |
| Intramuscular hemangioma | 1 |
| Angiolipoma | 1 |
Histologic typesof malignant soft tissue tumors.
| Malignant soft tissue tumors | Number of cases |
|---|---|
| Low grade sarcomas | |
| Uncertain myxoid differentiation sarcoma | 3 |
| Fusocelular sarcoma | 2 |
| Monophasic synovial sarcoma | 2 |
| Fibromyxoid sarcoma | 1 |
| Myxoinflammatory fibroblastic sarcoma | 1 |
| Myxoid liposarcoma | 1 |
| High grade sarcoma | |
| Undifferentiated pleomorphic sarcoma | 10 |
| Dedifferentiated liposarcoma | 3 |
| Leiomyosarcoma | 3 |
| Biphasic synovial sarcoma | 2 |
| Myxoid chondrosarcoma | 2 |
| Myxofibrosarcoma | 2 |
| Fusocelular high grade sarcoma | 1 |
| Sarcomas without gradation | |
| Extraskeletal Ewing sarcoma | 3 |
| Malignant solitary fibrous tumor | 2 |
| Malignant nerve sheath tumor | 2 |
| Non-sarcomatous soft tissue tumors | |
| Esophageal carcinoma metastasis | 1 |
| Epidermal carcinoma | 1 |
| Primary cutaneous follicular lymphoma | 1 |
| Chronic lymphocytic leukemia | 1 |
There were no statistically significant differences in the distribution of benign or malignant lesions according to the sex of the patients, but there was evidence of older age among patients diagnosed with malignant neoplasm (p=0.023).
Regarding the location of the lesions, a large proportion were in the thigh (42%), the arm (11%) or the foot (9%), with the rest distributed relatively homogeneously along the extremities; without differences between benign and malignant STT (p>0,05).
Morphological and anatomical characteristicsThe mean size of the lesions was 6.5cm (range, 2−28cm), with malignant lesions being significantly larger, with a mean diameter of 8.3cm (range, 3−28cm) versus 4.5cm (range, 2−19cm) for benign lesions (p<0.001).
79% of the STT were in the deep layers, without significant differences between the benign and malignant lesions; p>0,05. On the other hand, significant differences were observed in the presence of perilesional oedema (75% in malignant vs. 45% in benign lesions), intralesional nodular enhancement (77% vs. 35%, respectively) and cystic necrosis (57% vs. 20%) and in the heterogeneity of the T2 (73% vs. 35%) (p<0.001).
Quality of DWI sequences47 DWI cases (56%) were optimal for diagnosis, 28 had mild artefacts (33%) and 9 had moderate artefacts (11%). Only 3 examinations had to be excluded due to artefacts.
Influence of ADC quantification to differentiate benign and malignant lesionsThe mean of the total ADC values was 1497±580 mm2/s for benign lesions and 1348±521 mm2/s for malignant lesions for observer R1; and 1520±589 mm2/s and 1342±511 mm2/s, respectively, for observer R2. Malignant STT had a lower total ADC value than benign tumors, although the differences did not reach statistical significance (p=0.177).
The selected ADC values were 1335±596 mm2/s and 1035±439 mm2/s for benign and malignant lesions, respectively, for observer R1; and 1331±582mm2/s and 951±411 mm2/s for benign and malignant lesions, for observer R2. In this case, the values recorded by both observers of the selected ADC values for malignant neoplasms were significantly lower than those for benign lesions (p<0.05) (Fig. 4).
Interobserver agreement, for benign (0 on the left) and malignant (1 on the right) STT according to observer 1 (blue boxplot) and 2 (red boxplot), and its average (green boxplot).")
The ICC between both observers was 0.990 (95% CI: 0.985 to 0.994) and 0.986 (95% CI: 0.971 to 0.993) for the total ADC and selected ADC, respectively, which implies a high level of agreement. and a high degree of reliability for both measurements.
Morphological characteristics and ADC valuesA multivariate analysis was carried out to evaluate the relationship between the different covariates and the influence of the ADC value on the ability to correctly classify the lesions as benign or malignant. The most determining variables were age (older age indicating a greater probability of malignancy), size (the greater the diameter of the lesion, the greater the probability of malignancy), areas of peripheral nodular enhancement, cystic necrosis, STT heterogeneity, and the presence of perilesional oedema (Table 4).
Sensitivity, and specificity of each MRI feature for prediction of malignancy.
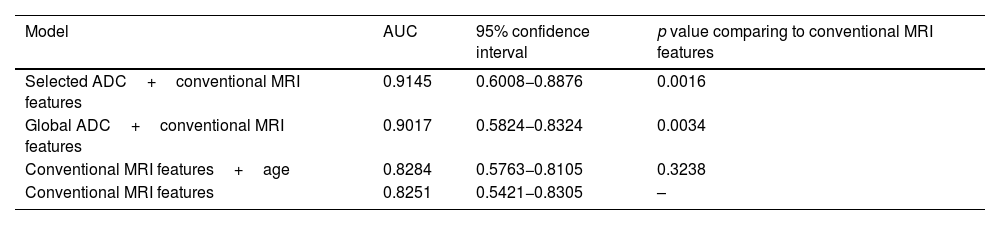
The ROC curves of this multivariate analysis showed that the diagnostic accuracy values were higher in models in which the ADC value was also added (Table 5). When the selected ADC was used combined with the main morphological characteristics, the sensitivity and specificity reached 84% and 75%, respectively, with an AUC of 91.45% (Fig. 5).
Area under the ROC curve (AUC) and multivariant linear regression.
| Model | AUC | 95% confidence interval | p value comparing to conventional MRI features |
|---|---|---|---|
| Selected ADC+conventional MRI features | 0.9145 | 0.6008−0.8876 | 0.0016 |
| Global ADC+conventional MRI features | 0.9017 | 0.5824−0.8324 | 0.0034 |
| Conventional MRI features+age | 0.8284 | 0.5763−0.8105 | 0.3238 |
| Conventional MRI features | 0.8251 | 0.5421−0.8305 | – |
, to the main morphological characteristics represented in model 3 (age, size, peripheral nodular enhancement, cystic necrosis, perilesional edema and T2 signal heterogeneity).")
ROC curve with multivariant models. The highest diagnostic accuracy for the discrimination between benign and malignant STT is obtained with models that add ADC values, both global or selected (red and green, respectively), to the main morphological characteristics represented in model 3 (age, size, peripheral nodular enhancement, cystic necrosis, perilesional edema and T2 signal heterogeneity).
The mean ADC was higher in the low-grade sarcomas than in the high-grade group, both for the total ADC and the selected ADC, and this was statistically significant for the selected ADC. Mean total ADC of low-grade sarcomas was 1380±428 mm2/s, and 1392±402mm2/s, for observer 1 and 2, respectively; while total ADC of high-grade sarcoma was 1212±497 mm2/s (observer 1), and 1258±431 mm2/s (observer 2), but the difference was not significant (p=0.240). On the other hand, the mean selected ADC value was significantly different between low-grade (1180±376 mm2/s, observer 1; and 1013±399 mm2/s, observer 2) and high-grade sarcomas (855±394 mm2/s, observer 1; and 887±315 mm2/s, observer 2; p<0,05).
DiscussionThe quantitative values of the ADC DWI maps were higher in benign lesions than in malignant ones, reaching statistical significance when the ROI was drawn in the selected area of the tumor, where there is visually greater diffusion restriction within the STT. Quantification of the ADC increased the diagnostic accuracy of MRI in the characterization of STTs when combined with morphological parameters. Additionally, low-grade sarcomas had higher ADC values than high-grade sarcomas, and this difference was statistically significant when the selected ADC was compared.
Although different studies have supported the role of ADC values in differentiating malignant from benign STTs, there is still no consensus on the ideal protocol for both acquiring the DWI sequences and measuring the ADC values.20–22
Based on these results, the use of the ADC value could be recommended through ROIs drawn to precisely select the areas of greatest restriction, avoiding blood, calcifications, areas of necrosis or myxoid foci within the tumor, thus evaluating the area that is most likely to reflect the true nature of the lesion. This is especially important for heterogeneous tumors and with areas of variable behaviour within the tumor itself.
In our study, the measurement of the ADC was carried out without separating the lesions according to their myxoid or fibrous components, given that the diagnostic dilemma that occurs most frequently in our clinical practice is the determination of the aggressiveness of the lesion. According to the imaging characteristics of STT, the histological origin of these lesions is often uncertain, so the use of DWI would be greatly limited if it was only used for lesions of clear histological lineage.
Like findings in the literature, our study showed a significant degree of overlap in ADC values between benign and malignant lesions.14,21–24 Due to the extensive overlap in ADC values, it is difficult to establish an optimal and exact cutoff point that reliably distinguishes the degree of aggressiveness of STT. However, based on our results, we can consider that the value of 1000 mm²/s would have the best diagnostic accuracy for distinguishing benign from malignant lesions; and values below 850mm²/s could suggest the diagnosis of more aggressive behaving tumors. These values are consistent with what has been previously described in the literature.13,14,24,25
Therefore, the combination of DWI information with other differentiating characteristics of benign and malignant lesions can be decisive in guiding the discrimination between them. This was demonstrated by the multivariate analysis of our study, where the discriminatory capacity of the model increased significantly when the ADC values, both total and selected, were examined together with age, perilesional oedema, postcontrast peripheral nodular enhancement, the presence of intralesional cystic necrosis and lesion heterogeneity, yielding AUC values of 89 and 91%, respectively. In particular, the use of the selected ADC in this multivariate analysis provided the best results, with sensitivity and specificity values of 84% and 75%, respectively.
Regarding the usefulness of DWI in discriminating high- and low-grade sarcomas, the only study we found was the work of Chhabra et al.,25 which presented a sample of 51 patients with soft tissue sarcomas. In line with our results, the selected ADC of these patients was significantly lower in grade II and III than in grade I sarcomas.
Our results also showed a significant overlap between the ADC values of high- and low-grade sarcomas, probably because the sarcoma samples included a high percentage of lesions with myxoid content, which limits the estimation of a numerical cut-off point for discriminating lesions with heterogenous biological structure.
Although artificial intelligence will play an increasingly important role in imaging diagnosis, it is still necessary to know the utility that DWI and its quantitative parameters can play in the clinical diagnosis of STTs.
The study has some limitations. First, it is a retrospective study and thus may be associated with patient selection bias. A significant number of patients had to be excluded due to the absence of DWI images, which makes the histological representation of the cohort somehow atypical, for example with very few lipomatous neoplasm. Moreover, a heterogeneous sample of patients was analysed, ranging from those admitted to tertiary hospitals to outpatients in primary health centre. Despite this, our cohort quite realistically simulated the routine work of our radiologists who contend daily with different levels of complexity cases and with patients referred from different steps of the health system.
Second, nonunified protocols were evaluated with MRI equipment from different companies. In most of our DWI sequences, two b values were used (usually 0, 800s/mm2), although a three b value scheme was not uncommon (normally 50, 400 and 800s/mm2). This heterogeneity among the protocols is consistent with the lack of standardization in DWI sequences seen in most studies.20–25 Our results serve to determine the validity of the ADC quantification with different manufacturers MRI equipment, and with non-standardised protocols.
Third, the sarcoma sample size was small, particularly low-grade sarcomas. Nevertheless, it seems that the ADC value could help in grading malignant lesions, although studies with a greater number of patients are necessary to verify this finding.
ConclusionsOur results support the value of the DWI sequence for the initial diagnosis of STT, justifying its routine inclusion in MRI studies of these tumors. The DWI sequence may be useful for differentiating between benign and malignant lesions and between high- and low-grade sarcoma tumors, increasing the diagnostic accuracy of MRI when added to conventional sequences.
FundingThis research did not receive funding.
Authorship- 1
Responsible for study integrity: ROP.
- 2
Study conception: ROP, NHA, TSY, TPC.
- 3
Study design: ROP, NHA, TSY, TPC.
- 4
Data acquisiton: ROP.
- 5
Data analysis and interpretation: ROP, BFR.
- 6
Statistical processing: ROP, TPC.
- 7
Literature search: ROP.
- 8
Drafting of the manuscript: ROP.
- 9
Critical review of the manuscript with intellectually significant contributions: ROP, NHA, TSY, TPC, CTL.
- 10
Approval of the final version: ROP, NHA, TSY, TPC, BFR, CTL.
The authors have no conflict of interest.
We would like to express our heartfelt gratitude to the entire team of nurses, imaging technicians, assistants, and secretaries at the Osatek Deusto MRI unit. Without their invaluable support and dedication, this work would not have been possible.

