


Calcification of the abdominal aorta is associated with increased cardiovascular morbidity, so a reliable method to quantify it is clinically transcendent. The 24-point scale (AAC-24) is the standard method for assessing abdominal aortic calcification on lateral plain films of the lumbar spine. The aim of this study was to determine the intraobserver and interobserver agreements for the AAC-24, taking into account the heterogeneity of the distribution of the calcifications in the design of the statistical analysis.
Material and methodsWe analyzed the intraobserver agreement (in plain films from 81 patients, with a four-year separation between observations) and the interobserver agreement (in plain films from 100 patients, with three observers), using both intraclass correlation and Bland–Altman plots.
ResultsThe intraobserver intraclass correlation coefficient was 0.93 (95% confidence interval [CI 95%]: 0.6–0.9), and the interobserver intraclass correlation coefficient was 0.91 (CI 95%: 0.8–0.9) with an increase in the coefficient in the tercile with the greatest discrepancy. The difference in means ranged from 0.3 to 1.2 points, and the distance between the limits of agreement ranged from 4.7 to 9.4 points. These differences increased significantly as the calcification progressed.
ConclusionsUsing the AAC-24 on lateral plain films of the lumbar spine is a reliable and reproducible method of assessing calcification of the abdominal aorta; both intraobserver and interobserver agreement are higher during the initial phases of calcification.
La calcificación de la aorta abdominal se asocia a un incremento en el riesgo de morbilidad cardiovascular, y disponer de un método de cuantificación de la misma es clínicamente trascendente. La escala de 24 puntos (AAC-24) es el método estándar para su evaluación en la radiología simple lateral de columna lumbar. El objetivo del estudio ha sido conocer el nivel de acuerdo intra e interobservador que aporta esta escala, teniendo en cuenta la heterogeneidad de la distribución de las calcificaciones en el diseño del análisis estadístico.
Material y métodosSe analizó la concordancia intraobservador (sobre radiografías de 81 pacientes, con una separación de 4 años) y la concordancia interobservador (sobre radiografías de 100 pacientes, con tres evaluadores), utilizando simultáneamente la correlación intraclase y el método gráfico de Bland–Altman.
ResultadosEl coeficiente de correlación intraclase fue de 0,93 (intervalo de confianza al 95% [IC95%]: 0,6-0,9) y 0,91 (IC95%: 0,8-0,9), intra e interobservador, respectivamente, con un incremento del coeficiente en el tercil de mayor discrepancia. La diferencia de medias osciló entre 0,3 y–1,2 puntos. La amplitud entre los límites de acuerdo, entre 4,7 y 9,4 puntos. Se observó un aumento significativo de las diferencias en relación con el aumento progresivo de la calcificación.
ConclusionesLa valoración de la calcificación de la aorta abdominal en radiología simple lateral de columna lumbar mediante la escala AAC-24 es un método fiable y reproducible, observándose un mayor grado de concordancia intra e interobservador en las fases iniciales de la calcificación.
The presence of calcifications in the aorta has been associated with an increase in the risk of cardiovascular morbimortality.1–4 Specifically, calcification of the abdominal aorta has been associated consistently with an increase of the risk of myocardial infarction,5 heart failure,6 peripheral disease7 and strokes,8 which makes it a variable of undeniable clinical interest.
Computed tomography (CT), which allows a volumetric quantification of the calcium deposits, is the reference pattern for the detection and assessing of the degree of abdominal aortic calcification.9,10 However, simple lateral radiology of the lumbar spine has proven useful in the diagnosis of aortic calcifications,7 it is a way cheaper modality than CT, entails less exposure to radiation and has shown good correlation with the presence and magnitude of calcification in the coronary arteries when assessed through CT.11,12 The semi-quantitative scale AAC-24 (Abdominal Aortic Calcification), is a 24-point scale developed by Kauppila et al.13 and used by the Framingham Study group,4,6 it is the routine evaluation modality used in the assessment of abdominal aorta calcified plaques obtained through simple X-rays or lateral densitometry of the spine.14,15 In comparison with the AAC-24 scale, the MACD (Morphological Atherosclerotic Calcification Distribution) index by Nielsen et al.,16 based on the morphology of the calcifications, seems to better identify the risk of mortality of cardiovascular origin.17 On the other hand, the AAC-24 scale has also been compared to the 8-point scale (AAC-8), developed by Schousboe et al.15 Although both are very well correlated,18 a prior study aimed at knowing the degree of concordance with both scales has proven that concordance with the AAC-8 scale despite being good did not reach the high level evidenced with the AAC-24.19
According to all the works published, the degree of agreement with the AAC-24 scale is almost perfect. It is not unusual to observe concordance figures over 0.90 both intra-observer (between 0.93 and 0.9813,20) and inter-observer (between 0.90 and 0.9613,21). Nevertheless, all these analyses were carried out using the interclass correlation coefficient (ICC) as the only statistic coefficient and we need to remember that one of the limitations of this coefficient is its strong dependence on the variability of data. That is it rises significantly with the presence of extreme values and, in general, in view of heterogeneous distributions, regardless of the degree of concordance obtained.22,23
Taking into account the heterogeneous and asymmetric distributions of the abdominal aorta calcifications observed in large population studies,4,24 we should ask if the high ICC values published could be biased by the heterogeneity of the distribution of the variable which could in turn limit the reliability of the measurements with the AAC-24 scale.
In view of these considerations, the main goal of our study is to know in detail the degree of reliability, specifically intra- and inter-observer agreement, in the evaluation of abdominal aortic calcifications using the AAC-24 scale. An additional goal is to know the distribution of the differences among the observers’ measurements.
Material and methodsPopulation and sampleThe general design corresponds to a descriptive transversal study nested in a cohort study. Our research has taken advantage of the device implemented by a population based prospective study, the Camargo Cohort,25 both in the participants and the X-rays selected. The subjects studied are, therefore, like in the cohort, men ≥50 years old and postmenopausal women. Briefly, the Camargo Cohort started in 2006 with the goal of knowing the incidence and prevalence of bone metabolic diseases in the general population and its participants live in the Valley of Camargo, Cantabria, Spain. The population is semi-metropolitan, it is assigned to two health centers and is made up of 31,000 inhabitants. All patients had to fill in a specific questionnaire on bone metabolism and general diseases including risk factors of osteoporosis and fractures, a general laboratory study of bone metabolism, a central densitometry, an ultrasound study of the calcaneus bone and a simple lateral X-ray of the thoracic and lumbar spine obtained through a routine proceeding at the Radiology Department of the Hospital Universitario Marqués de Valdecilla. All participants gave their informed written consent and the study was approved by the Cantabria Clinical Research Ethics Committee.
We followed the Walter and Eliasziw criteria for the calculation of sample sizes in reliability studies.26 Thus, for the analysis of intra-observer concordance, it was estimated that 80 individuals would be necessary to detect a 0.70 ICC, with a desired power of at least 98%. In the inter-observer concordance, the required sample was 100 subjects, to detect a 0.40 ICC, with a desired power of at least 92%. In both cases, significance was established at the 95% level. Once the two necessary sample sizes had been obtained, two systematic samplings were carried out with a random start, from the records of the Camargo Cohort participants.
Study technique and evaluation of variablesAccording to the AAC-24 scale, in the lateral lumbar spine X-rays, the aorta anterior and posterior walls were divided into four segments corresponding to the area located in front of vertebrae L1–L4. The segments evaluated were those between an imaginary line parallel to the surface of vertebral bodies and between them. Based on this scale, aortic calcification was scored as 0 (no calcification), 1 (calcification in one third or less of the aortic wall), 2 (calcification in more than one third, but in two thirds or less of the aortic wall) or 3 (calcification of more than two thirds of the aortic wall). It was estimated that there was aortic calcification when images of calcic density were observed in an area anterior and parallel to the lumbar spine, which could appear as diffused white dots, as a linear image of calcification of the anterior and/or posterior aortic wall or as a circumferential image, homogeneous or not, of calcic density. After the sum of both walls, the total score was between 0 and 24 (Fig. 1). At the initial stage of the study, the evaluators received a specific training in the use of the AAC-24 scale and the application of the Kiel et al. radiographic atlas,27 under the supervision of one of the authors (RLA), a radiologist with 18 years of clinical experience. To this end, they all evaluated 10 X-rays with different degrees of aortic calcification, which were later ruled out for analysis.
 were: Level L1=1 (1+0), level L2=0, level L3=4 (3+1), level L4=2 (0+2) that is an overall score of 7.")
Lateral lumbar spine simple X-ray with images of calcifications in the abdominal aorta of one participant in the study. The partial scores in the ACC-24 scale (anterior wall+posterior wall) were: Level L1=1 (1+0), level L2=0, level L3=4 (3+1), level L4=2 (0+2) that is an overall score of 7.
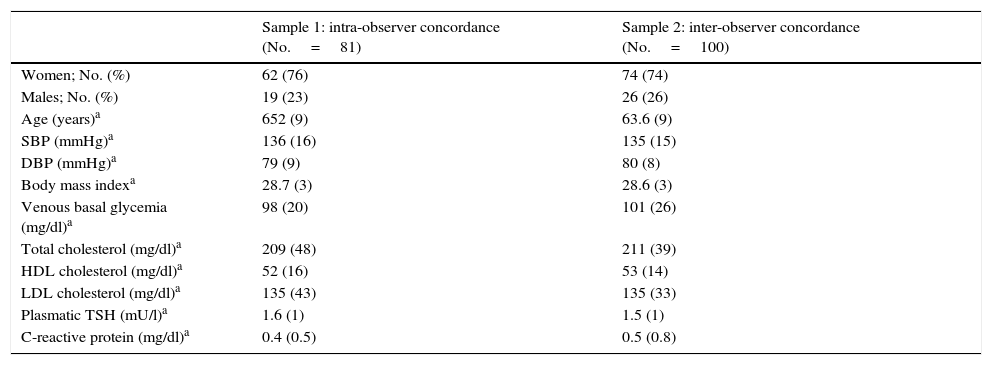
The intra-observer concordance analysis was performed with a four-year lapse between both measurements. One of the authors (EPR), also a researcher of the Camargo Cohort, evaluated the AAC-24 scale on 81 lateral lumbar spine X-rays. The first evaluation was made in 2010 [Obs2010] and the second in 2014 [Obs2014], using the same X-rays and unaware of the scores of the initial evaluation. For the analysis of inter-observer concordance, three of the authors (GAS [Obs1], PGV [Obs2] and EPR [Obs3], who are physicians and specialists in family and community medicine with 12, 35 and 22 years of clinical experience, respectively) evaluated consecutive and independently the AAC-24 scale in the lateral lumbar spine X-rays of 100 patients. The observers did not have access to the clinical information of the subjects evaluated at any time. The demographic aspects and the clinical characteristics of the subjects participating in the study are presented in Table 1.
Clinical features of the samples chosen for the assessment of the intra and inter-observer concordance.
| Sample 1: intra-observer concordance (No.=81) | Sample 2: inter-observer concordance (No.=100) | |
|---|---|---|
| Women; No. (%) | 62 (76) | 74 (74) |
| Males; No. (%) | 19 (23) | 26 (26) |
| Age (years)a | 652 (9) | 63.6 (9) |
| SBP (mmHg)a | 136 (16) | 135 (15) |
| DBP (mmHg)a | 79 (9) | 80 (8) |
| Body mass indexa | 28.7 (3) | 28.6 (3) |
| Venous basal glycemia (mg/dl)a | 98 (20) | 101 (26) |
| Total cholesterol (mg/dl)a | 209 (48) | 211 (39) |
| HDL cholesterol (mg/dl)a | 52 (16) | 53 (14) |
| LDL cholesterol (mg/dl)a | 135 (43) | 135 (33) |
| Plasmatic TSH (mU/l)a | 1.6 (1) | 1.5 (1) |
| C-reactive protein (mg/dl)a | 0.4 (0.5) | 0.5 (0.8) |
HDL, cholesterol: high-density lipoprotein cholesterol; LDL, cholesterol: low-density lipoprotein cholesterol; DBP, diastolic blood pressure; SBP, systolic blood pressure; TSH, thyrotropin.
The individual series have been characterized by the median and the interquartile range, mean and the standard deviation (SD) and the asymmetry and kurtosis coefficients. Four distributions were analyzed referred to arbitrarily as A1, B1, B2 and B3, which corresponded to the pairs of observations Obs2010/Obs2014, Obs1/Obs2, Obs1/Obs3 and Obs2/Obs3, respectively. In addition, we have obtained the terciles of a hypothetical distribution averaging the Obs1, Obs2 and Obs3 series. The verification of normalcy was performed using with the Kolmogorov–Smirnov test, and then a logarithmic transformation was made after verifying that the initial distributions moved away from normality. The level of intra- and inter-observer concordance has been calculated using an analytical method, the ICC in its (2.1) variant28,29 and a graphic method, the Bland–Altman method.30,31 Based on this methodology, the difference between each pair of measurement was analyzed graphically as opposed to its mean. In addition, the systematic error, the agreement limits at 95% and the repeatability coefficient (RC) were obtained.23,32
Finally, in order to characterize statistically the variability observed in the Bland–Altman charts, a heteroscedasticity analysis was performed.
The sample sizes were calculated using the software PASS 2008® (NCSS, Utah, USA), the Bland–Altman plots with MedCalc®8 (MedCalc Software, Ostend, Belgium), and the remaining calculations using with statistic package SPSS®15 (SPSS Inc., Chicago, IL, USA). A value of p<0.05 has been considered significant.
ResultsThe degree of calcification observed was greater in the posterior wall of the aorta and in the distal levels; L3 and L4 (Table 2). The medians ranged from 4 to 6 points, and the means, from the 4.5 to 6.7. When it comes to the degree of dispersion, the distributions showed some values of the interquartile range between 5 and 6.7, and when it comes to the degree of SD, between 3.9 and 5. The series were asymmetric, with a positive sign, presenting a disperse tail of scores to the right of the mean, in relation to the mid and high values of the scale. On the other hand when it comes to the degree of peakedness or kurtosis, the distributions were of negative signs, platykurtic, with a greater accumulation of cases in the tails when it comes to the normal distribution. The terciles corresponded with the following segments of the scale: 0–2.65 points (tercile 1), 2.66–6.55 points (tercile 2), and 6.56–24 points (tercile 3).
Parameters of central trend, dispersion and distribution in the initial 5 series.
| Scale AAC-24 | Obs2010 | Obs2014 | Obs1 | Obs2 | Obs3 |
|---|---|---|---|---|---|
| No.=81 | No.=100 | ||||
| Partial results | |||||
| Anterior walla | 2 [3] | 2 [4] | 2 [3] | 2 [4] | 2 [4] |
| Posterior walla | 4 [3] | 3 [4] | 2 [3] | 2 [4] | 3 [4] |
| Level L1a | 0 [1] | 0 [1] | 0 [1] | 0 [1] | 0 [1] |
| Level L2a | 1 [2] | 0 [1] | 0 [1] | 0.5 [2] | 0 [1] |
| Level L3a | 2 [2] | 2 [4] | 1.5 [2] | 2 [3] | 2 [4] |
| Level L4a | 3 [2] | 2 [3] | 1 [3] | 2 [4] | 2 [2] |
| Total results | |||||
| Median [IQR] | 6 [6] | 5 [5.6] | 4 [5] | 5 [6.7] | 4.5 [6] |
| Average (SD) | 6.7 (4.4) | 5.6 (4.4) | 4.5 (3.9) | 5.7 (5) | 5.4 (4.3) |
| Asymmetry coefficient | 0.4 | 0.6 | 0.8 | 0.7 | 0.6 |
| Kurtosis coefficient | −0.5 | −0.6 | −0.2 | −0.4 | −0.3 |
| Significance of the K-S test of normalityb | 0.07 | 0.03 | 0.02 | 0.07 | 0.02 |
SD: standard deviation: IQR: interquartile range.
In the four pairs of observations, the median of the differences between the scores (Fig. 2) was identical, with a value of 1. The distribution with the greatest range of differences was B1 (up to 9 points), whereas B2 and B3 (up to 6) and A1 (up to 4 points) presented less variability.

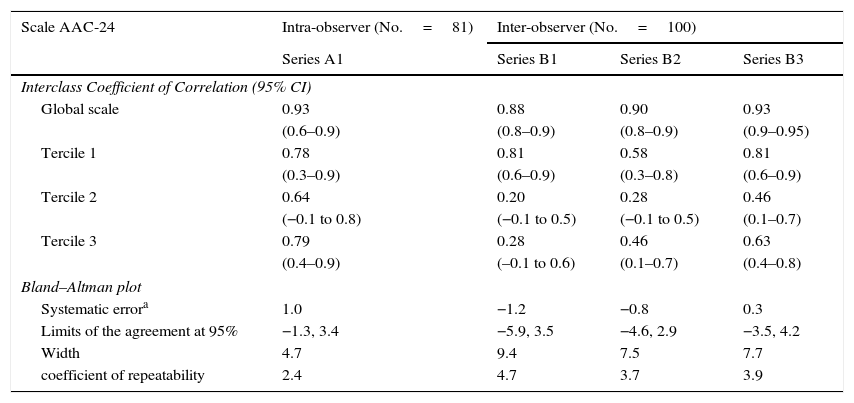
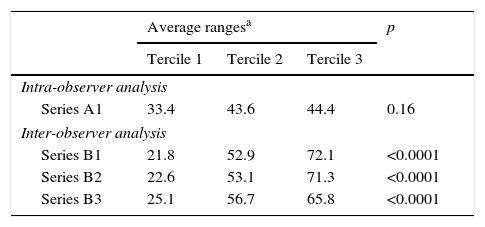
In the analysis of intra-observer concordance (Table 3), the ICC value was 0.93 (CI 95%: 0.6–0.9). The cloud of dots in the Bland–Altman plot presented a uniform distribution (Fig. 3), without any recognizable trends. In concordance with this, the analysis of heteroscedasticity failed to show any significant differences among the average ranges of the terciles of the AAC-24 scale (Table 4).
Concordance statistics: interclass coefficient of correlation and Bland–Altman plot.
| Scale AAC-24 | Intra-observer (No.=81) | Inter-observer (No.=100) | ||
|---|---|---|---|---|
| Series A1 | Series B1 | Series B2 | Series B3 | |
| Interclass Coefficient of Correlation (95% CI) | ||||
| Global scale | 0.93 | 0.88 | 0.90 | 0.93 |
| (0.6–0.9) | (0.8–0.9) | (0.8–0.9) | (0.9–0.95) | |
| Tercile 1 | 0.78 | 0.81 | 0.58 | 0.81 |
| (0.3–0.9) | (0.6–0.9) | (0.3–0.8) | (0.6–0.9) | |
| Tercile 2 | 0.64 | 0.20 | 0.28 | 0.46 |
| (−0.1 to 0.8) | (−0.1 to 0.5) | (−0.1 to 0.5) | (0.1–0.7) | |
| Tercile 3 | 0.79 | 0.28 | 0.46 | 0.63 |
| (0.4–0.9) | (–0.1 to 0.6) | (0.1–0.7) | (0.4–0.8) | |
| Bland–Altman plot | ||||
| Systematic errora | 1.0 | −1.2 | −0.8 | 0.3 |
| Limits of the agreement at 95% | −1.3, 3.4 | −5.9, 3.5 | −4.6, 2.9 | −3.5, 4.2 |
| Width | 4.7 | 9.4 | 7.5 | 7.7 |
| coefficient of repeatability | 2.4 | 4.7 | 3.7 | 3.9 |
CI: confidence interval.
Terciles of the scale AAC-24: tercile 1 (0–2.65 points); tercile 2 (2.66–6.55 points); tercile 3 (6.56–24 points).
Series A1: observations in 2010 and 2014.
Series B1: Obs1 and Obs2.
Series B2: Obs1 and Obs3.
Series B3: Obs2 and Obs3.

Analysis of heteroscedasticity.
| Average rangesa | p | |||
|---|---|---|---|---|
| Tercile 1 | Tercile 2 | Tercile 3 | ||
| Intra-observer analysis | ||||
| Series A1 | 33.4 | 43.6 | 44.4 | 0.16 |
| Inter-observer analysis | ||||
| Series B1 | 21.8 | 52.9 | 72.1 | <0.0001 |
| Series B2 | 22.6 | 53.1 | 71.3 | <0.0001 |
| Series B3 | 25.1 | 56.7 | 65.8 | <0.0001 |
Terciles of the scale AAC-24: tercile 1 (0–2.65 points); tercile 2 (2.66–6.55 points); tercile 3 (6.56–24 points).
Series A1: observations in 2010 and 2014.
Series B1: Obs1 and Obs2.
Series B2: Obs1 and Obs3.
Series B3: Obs2 and Obs3.
With respect to the degree of inter-observer concordance, the ICC for the three observers was 0.91 (0.8–0.9). In the analysis per pair of observers, the highest concordance corresponded to B3, with an ICC of 0.93 (0.90–0.95). The Bland–Altman plots showed a progressive increase of the differences in the scores, which was more evident the higher the mean of the scores in the abscissa axis was (Fig. 4). This increase in inter-observer error, and therefore in the variability of distribution, corresponded with the higher segments of the AAC-24 scale and it was confirmed in the analysis of heteroscedasticity, which showed a significant inequality of the variances among the terciles (Table 4). In connection to this, the width of the limtis of the agreement was greater than that observed in the intra-observer analysis, and in the specific case of B1, exactly twice the width of the limits of the agreement of A1 (9.4 and 4.7, respectively). The highest systematic error, with a value of −1.2 points, was observed in B1, while the lowest value corresponded to B3.

Lastly, we have evaluated ICC behavior in the different terciles of the AAC-24 scale. The values that the ICC adopted in the last tercile of the four distributions–the segment with the greatest variability in the scores–, were greater than the values that corresponded to the second tercile. Also we have observed a noticeable increase of ICC when considering the whole series when it comes to the values it adopted in the terciles. As an example, in the B2 series ICC values of 0.58 (first tercile), 0.28 (second tercile) and 0.46 (last tercile) were observed, while a value of 0.90 was obtained on the whole series (Table 3).
DiscussionIn the present study, coinciding with what has been published,4,24 the AAC-24 scale showed asymmetric and heterogeneous distribution, with a noticeable prevalence of low values on the scale and very elongated tails toward higher values. The greater degree of calcification observed in the L3–L4 levels with respect to the L1–L2 levels had been described before,13,21 and it possibly has some connection with the development of calcification, which would start more distally and advance to more proximal areas of the abdominal aorta.21 Similarly we have observed a greater presence of calcified plaques on the posterior wall with respect to the anterior wall of the abdominal aorta, which had also been documented before.20
Something that has not been conveniently clarified yet is the specific correlation between the score of the scale and the gradation of cardiovascular risk. It has been recently published that the calcic content of the plaque can be proportional to the risk of fracture only up to a certain extent from which the plaque becomes more stable, and that a certain number of small calcifications can indicate a greater risk of fracture than a few large, stable calcifications in the same area.14 However, the cut-off point of 5 on the AAC-24 scale is considered to be the «significant level of atherosclerotic load».33 In fact, Wilson et al.4 observed that a score of ≥5 was associated with an adjusted relative risk of 1.91 (1.5–2.5) of coronary disease, while the risk of cardiovascular disease was 1.70 (1.4–2.1), and that of cardiovascular mortality 2.26 (1.6–3.1). This value ≥5 points on the AAC-24 scale has also been associated to a greater degree of calcification of the coronary arteries, with an odds ratio of 6.42 (2.3–18).34 Lewitzky et al.7 verified that a score ≥4 on the AAC-24 scale is associated with an adjusted relative risk of 1.68 (1.1–2.5) of intermittent claudication and of 1.73 (1.1–2.6) of ischemic stroke.
Given that these cut-off points–according to what has been published are clinically significant it is necessary to ensure the reliability of the measurements when the AAC-24 scale is used. In this sense, the authors who developed this scale, when analyzing 100 X-rays of participants of the Framingham study, communicated some inter-observer ICC values for the total score of 0.93 in the initial X-rays and 0.96 in the follow-up X-rays (0.98 and 0.96, respectively, in the intra-observer analysis).13 Schousboe et al.15 observed an inter-observer ICC of 0.92 and Toussaint et al.20 reported an intra-observer ICC of 0.92 for the score of the anterior wall, 0.91 for the score of the posterior wall and 0.93 for the overall score. Lastly, Honkanen et al.21 found an inter-observer correlation of 0.90.
Our results are very similar to what has been published, 0.93 and 0.91, in intra- and inter-observer concordance, respectively. However, it must be considered that ICC has increased in the four distributions and it has done so noticeably, in direct correlation to the variability of the data. That is why we should speculate with the possibility that the high ICC values described in previous studies13,15,20,21 which were obtained from samples with very heterogeneous distributions of aortic calcification could be due to the same effect. In relation to this statistic artifact, some authors have pointed out that some ICC values that are even greater than 0.75–level traditionally considered as an indicator of good concordance, can be unacceptable with respect to certain research goals.35
The Bland–Altman method has allowed us to obtain information of great interest, such as the increase of variability in relation with the score increase on the scale. On the other hand, the main limitation of this method is that the estimation of the degree of agreement is subjective: accepting or rejecting a certain degree of concordance between two observers depends on the comparison of the limits based on the clinical practice.30 Although we have not found any published references about the joint use of the AAC-24 scale and the Bland–Altman method to compare our results we interpret the level of the A1, B2 and B3 distributions as a high level of concordance and on the contrary as less concordance than that observed in B1 since it has shown the greatest systematic error and the greatest width in the limtis of the agreement.
We have analyzed the 7 cases with the greatest difference in the scores that correspond to the points that are outside the limits of the agreement. Just as the linear calcium images on the aortic wall did not mean relevant discrepancies, the main source of variability in the score has been the images of circumferential calcification (Fig. 5), which indicates that is should be good to bring special attention to this image at the learning stage prior to the use of the scale.
 and linear (arrows in continuous line) type of calcifications in the abdominal aorta.")
The main strength of our study is that it made a thorough analysis, which had not been done before as far as we know, about the degree of agreement in the radiologic evaluation of abdominal aortic calcification using the 24-point scale and in the actual conditions of clinical practice. To this end several observers have participated and two statistic methods of concordance have been used. In this sense, we understand that ICC and the Bland–Altman method contribute complementary information: just like the former is an overall measure of concordance the latter sheds light about the distribution of the differences between the two measurements.
A limitation of the study is that the evaluation has been carried out with conventional X-rays. Although their technical quality has been the right one, we should expect a possible classification bias to the extent that the inferior quality of some films could have influenced the observers’ scores. Digitalized X-rays–with the advantages that it contributes (high image quality, good resolution, possibility of on-screen manipulation) could have minimized such possible bias.
In sum evaluating abdominal aortic calcification using the AAC-24 scale, in general terms, is reliable and can be reproduced both by one and several observers. Although it allows a high degree of concordance, it must be considered that it is different on both ends of the scale; that is, reliability is greater at the initial stages of abdominal aorta calcification and it is less reliable when the degree of calcification rises. The use of the AAC-24 scale must be preceded by a specific training paying special attention to the radiologic pattern of circumferential calcification, a presentation that was the main source of variability in the scores in our study.
Authors’ contribution- 1.
Manager of the integrity of the study: EPR and JMO.
- 2.
Study Idea: EPR, GAS and JMO.
- 3.
Study Design: EPR, GAS, JLH and RLA.
- 4.
Data Mining: GAS, PGV and RLA.
- 5.
Data Analysis and Interpretation: EPR, JLH, RLA and JMO.
- 6.
Statistical Analysis: EPR and JLH.
- 7.
Reference Search: GAS, PGV and RLA.
- 8.
Writing: EPR, GAS and PGV.
- 9.
Critical review of the manuscript with intellectually relevant remarks: JLH, RLA and JMO.
- 10.
Approval of final version: EPR, GAS, PGV, JLH, RLA and JMO.
The authors declare that no experiments with human beings or animals have been performed while conducting this investigation.
Data confidentialityThe authors declare that in this article there are no data from patients.
Right to privacy and informed consentThe authors declare that in this article there are no data from patients. Thank you.
Conflict of interestThe authors declare no conflict of interests.
FinancingThis study has been financed by the Instituto de Salud Carlos III, Spanish Ministry of Science and Innovation (FIS PI 11/01092).
Please cite this article as: Pariente-Rodrigo E, Alessia Sgaramella G, García-Velasco P, Hernández-Hernández JL, Landeras-Alvaro R, Manuel Olmos-Martínez J. Fiabilidad en la evaluación radiológica de la calcificación aórtica abdominal mediante la escala de 24 puntos. Radiología. 2016;58:46–54.

