


To develop prognosis prediction models for COVID-19 patients attending an emergency department (ED) based on initial chest X-ray (CXR), demographics, clinical and laboratory parameters.
MethodsAll symptomatic confirmed COVID-19 patients admitted to our hospital ED between February 24th and April 24th 2020 were recruited. CXR features, clinical and laboratory variables and CXR abnormality indices extracted by a convolutional neural network (CNN) diagnostic tool were considered potential predictors on this first visit. The most serious individual outcome defined the three severity level: 0) home discharge or hospitalization ≤ 3 days, 1) hospital stay >3 days and 2) intensive care requirement or death. Severity and in-hospital mortality multivariable prediction models were developed and internally validated. The Youden index was used for the optimal threshold selection of the classification model.
ResultsA total of 440 patients were enrolled (median 64 years; 55.9% male); 13.6% patients were discharged, 64% hospitalized, 6.6% required intensive care and 15.7% died. The severity prediction model included oxygen saturation/inspired oxygen fraction (SatO2/FiO2), age, C-reactive protein (CRP), lymphocyte count, extent score of lung involvement on CXR (ExtScoreCXR), lactate dehydrogenase (LDH), D-dimer level and platelets count, with AUC-ROC = 0.94 and AUC-PRC = 0.88. The mortality prediction model included age, SatO2/FiO2, CRP, LDH, CXR extent score, lymphocyte count and D-dimer level, with AUC-ROC = 0.97 and AUC-PRC = 0.78. The addition of CXR CNN-based indices did not improve significantly the predictive metrics.
ConclusionThe developed and internally validated severity and mortality prediction models could be useful as triage tools in ED for patients with COVID-19 or other virus infections with similar behaviour.
Desarrollar modelos de predicción de pronóstico para pacientes con COVID-19 que acuden a urgencias, basados en la radiografía de tórax inicial (RXT), parámetros demográficos, clínicos y de laboratorio.
MétodosSe reclutaron todos los pacientes sintomáticos con COVID-19 confirmada, que ingresaron en urgencias de nuestro hospital entre el 24 de febrero y el 24 de abril de 2020. Los parámetros de la RXT, las variables clínicas y de laboratorio y los índices de hallazgos en RXT extraídos por una herramienta diagnóstica de inteligencia artificial en esta primera visita se consideraron potenciales predictores. El desenlace individual más grave definió los tres niveles de gravedad: 0) alta domiciliaria u hospitalización de 3 días o inferior, 1) hospitalización más de 3 días y 2) necesidad de cuidados intensivos o muerte. Se desarrollaron y validaron internamente modelos de predicción multivariable de gravedad y mortalidad hospitalaria. El índice de Youden se utilizó para la selección del umbral óptimo del modelo de clasificación.
ResultadosSe registraron 440 pacientes (mediana de 64 años; 55,9% hombres); el 13,6% de los pacientes fueron dados de alta, el 64% hospitalizo más de 3 días, el 6,6% requirió cuidados intensivos y un 15,7% falleció. El modelo de predicción de gravedad incluyó saturación de oxígeno/fracción de oxígeno inspirado (SatO2/FiO2), edad, proteína C reactiva (PCR), linfocitos, puntuación de la extensión de la afectación pulmonar en la RXT (ExtScoreRXT), lactato deshidrogenasa (LDH), dímero D y plaquetas, con AUC-ROC = 0,94 y AUC-PRC = 0,88. El modelo de predicción de mortalidad incluyó edad, SatO2/FiO2, PCR, LDH, ExtScoreRXT, linfocitos y dímero D, con AUC-ROC = 0,97 y AUC-PRC = 0,78. La adición de índices radiológicos obtenidos por inteligencia artificial no mejoró significativamente las métricas predictivas.
ConclusiónLos modelos de predicción de pronóstico desarrollados podrían ser útiles para clasificar en urgencias a los pacientes con COVID-19 u otras infecciones víricas con comportamiento similar.
The COVID-19 pandemic is posing a large challenge for health systems, forcing a balance to be found between resource management and safe decision-making with a lower than needed scientific evidence. Clinical presentation of the disease varies from mild symptoms to a bilateral bronchopneumonia with hypoxemia. An Acute Respiratory Distress Syndrome or the involvement of other vital organs may complicate the clinical course and compromise the life of the patient. Uncertainties make necessary the development of specific disease models in order to identify patients by prognosis and severity, requiring hospital or even intensive care. Thoracic imaging has served as a diagnostic tool in emergency department (ED) as it may reveal suggestive COVID-19 patterns of lung involvement.1–5 However, studies on the utility of the chest X-ray (CXR) for predicting health outcomes are limited6–9 and the prognostic studies have mainly been based on chest CT.10–12
Considering the higher use of CXR, its larger availability and safer use to control the spread of the virus when compared with CT, we aimed to develop two multivariable prediction models for severity and mortality estimations in COVID-19 taking into consideration the radiological, demographic, clinical and laboratory variables registered on the emergency evaluation.
Material and methodsThe institutional review board approved this retrospective study. This research did not receive any specific grant from funding agencies in the public, commercial, or not-for-profit sectors.
It followed the Transparent Reporting of a multivariable prediction model for Individual Prognosis or Diagnosis: the TRIPOD statement.13 The risk of bias and applicability was assessed with the Prediction model Risk of Bias Assessment Tool (PROBAST).14
PatientsAll consecutive symptomatic adult patients visiting the ED of our university hospital between 24 February and 24 April 2020 were included if CXR was performed and Severe Acute Respiratory Syndrome - Coronavirus 2 (SARS-CoV-2) RNA was detected in nasopharyngeal swab or sputum/bronchoalveolar lavage. Patients with simultaneous final diagnosis other than COVID-19 were excluded. Emergency physicians triaged these patients. Oligosymptomatic patients with normal CXR and laboratory parameters, oxygen saturation >95%, absence of chronic diseases and <65 years old were discharged at home. Patients admitted at the hospital were treated with standard of care drugs in force at the time and they were discharged if afebrile for at least 3 days with respiratory symptoms and laboratory parameters improvement (Flowchart of the study in Fig. 1).
Chest X-ray review
Initial CXR readings on admission were distributed among five radiologists with an average of 11 years of experience in thoracic imaging, blinded to the rest of parameters and outcome. The following items were described (Fig. 2):
- •
Absence (level 0) or presence and density of opacities: only low-density (level 1) or consolidation (+/- low density) (level 2). Lung opacities were considered “low-density” if the attenuation did not conceal the underlying vessels and “consolidation” if the opacification of the parenchyma obscured the underlying vessels.
- •
Distribution of opacities: peripheral (in the outer third of the lungs) / central (in the inner two thirds of the lungs) prevalence / both without clear prevalence; unilateral / bilateral; upper (suprahillar) / medium (hilar) / lower fields (infrahilar). For determining the distribution and extent of involvement each lung was divided in upper, medium and inferior field, with a maximum of six fields. The affected lobes were not recorded since a high percentage of the radiographs were portable (27.7%).
- •
Extension degree and score of lung involvement: the extent was graded as mild (if size opacity was less than 1 field); moderate (1-2 fields involved); extensive (3-4 fields involved) and very extensive (5-6 fields involved). A numerical value was assigned to each field depending on the percentage with increased attenuation: 0 (0%), 1 (≤50%), and 2 (>50%). A total score of the lung involvement extent (ExtScoreCXR) was reached by adding up the six field scores, obtaining a value from 0 to 12. The ExtScoreCXR was created by the authors after considering it by consensus a simple, fast, reproducible and optimal method of semi-quantification of the lung involvement extent. The extent score from the division into lung fields has also been used by other authors in patients with COVID-19.6–8,15
- •
The imaging variables were agreed upon by the radiologists from the X-ray of the first 80 cases detected. House-made repository software was used to record all the variables in a structured shared database, with description and imaging reminders aiming to reduce variability between readers and mandatory fill-in fields to optimize data collection.
: Division of lung fields. Upper fields (suprahillar area) limited by the line that passes under the aortic arch; medium fields (hilar area) and inferior fields (infrahilar area) separated by the line that divides the rest of the lungs into two halves (frequently this line crosses the bifurcation of the right inferior lobar artery). A1: Unilateral central and peripheral low-density opacities (arrow), without predominance. A2: Medium and lower right fields involved ≤ 50%; ExtScoreCXR = 2. B1: Central right low-density opacity (arrow) and peripheral left consolidation (larger arrows). Peripheral predominance. B2: Medium right and left fields with ≤50% of involvement and upper left field with >50% of involvement; ExtScoreCXR = 4. C1: Bilateral low-density opacities (arrows) and consolidations (larger arrows) without predominance. C2: Upper fields and lower left field with ≤50%, medium fields and right lower right field with >50% of involvement; ExtScoreCXR = 9.")
Chest X-ray features. Up: examples of distribution, density of opacities and extent score. Down (the same CXR): Division of lung fields. Upper fields (suprahillar area) limited by the line that passes under the aortic arch; medium fields (hilar area) and inferior fields (infrahilar area) separated by the line that divides the rest of the lungs into two halves (frequently this line crosses the bifurcation of the right inferior lobar artery). A1: Unilateral central and peripheral low-density opacities (arrow), without predominance. A2: Medium and lower right fields involved ≤ 50%; ExtScoreCXR = 2. B1: Central right low-density opacity (arrow) and peripheral left consolidation (larger arrows). Peripheral predominance. B2: Medium right and left fields with ≤50% of involvement and upper left field with >50% of involvement; ExtScoreCXR = 4. C1: Bilateral low-density opacities (arrows) and consolidations (larger arrows) without predominance. C2: Upper fields and lower left field with ≤50%, medium fields and right lower right field with >50% of involvement; ExtScoreCXR = 9.
Demographics, institutionalization, comorbidities, clinical manifestations, peripheral oxygen saturation (SatO2), laboratory data -C reactive protein (CRP), lactate dehydrogenase (LDH), lymphocyte count, platelet count, and D-dimer- were recorded. We calculated SatO2/FiO2 to avoid data loss from patients with SatO2 obtained under oxygen therapy. FiO2 is the fraction of inspired oxygen and changes depending on the oxygen flow rate delivered to each patient; for room air it is 0.21.
Computational Imaging (Artificial Intelligence Data)Probability indices of lung abnormal findings were extracted from CXR by a Convolutional neural network (CNN)-based diagnostic tool, QUIBIM Precision CXR v2.0.0 (QUIBIM S.L) with CE mark class IIa. The algorithm includes an ensemble of deep learning models that estimate the probability of different thoracic findings and the probability of abnormality in CXR. A value of 0 would mean no probability of belonging to that pathological finding and a value of 1 would mean total certainty of belonging to that pathological group. See supplementary material about the CNN-tool on Appendix 1. Indices for “consolidation”, “lung opacity” and “abnormal CXR” were incorporated into the final model to assess whether they improved its predictive accuracy
Outcome variablesThree severity levels were defined: home discharge or hospitalization ≤ 3 days (level 0), hospital stay >3 days (level 1), need for intensive care unit (ICU) stay or death due to COVID-19 (level 2). Both days of hospitalization and days to death were registered. The median of follow-up was 91 days (range 64-124 days).
Univariable analysisCorrelations between the lung involvement extension on CXR (degrees and score) and the days with symptoms, the SatO2/FiO2 and the variable outcomes were investigated. Spearman, Kendall, Rank or Point biserial tests were used depending on the type of the studied variables. For interpreting the strength of a relationship based on its r-value (using the absolute value of the r-value to make all values positive) we applied the following rule of thumb: r < 0.1 none, 0.1 < r < 0.3 weak, 0.3 < r < 0.5 moderate, 0.5 < r < 0.8 strong and r > 0.8 very strong.
Prognostic predictive modelsDifferent prognostic predictive models were developed using three types of classifiers or ensemble methods (Gradient Boosting, Random Forest and Support Vector Machine) and applying a stratified cross-validation with the 80% of the population. These classifiers have been chosen because they are intrinsically suited to solve classification problems with two or more classes. For instance, Support Vector Machine is a linear model that scales relatively well to high dimensional data and is less prone to over-fitting. Both Random Forest and Gradient Boosting are ensemble models that consist in training multiple weak learners and merge their results to build a “strong learner”. They differ on two key points: the way the training sets for each base model are defined and the order in which the weak learners are trained. In particular, Random forest creates random train samples from the full training set based on a random selection of both observations and features (bootstrapping). A weak learner is trained in parallel on each of the derived training sets. In the case of Gradient Boosting, the method consists in fitting several weak learners sequentially, where, at each iteration, more weight is added to the observations with the worst prediction from the previous iteration. Since each weak learner is built upon the results from the preceding one, the computation cannot be parallelized and the computation can be longer.
An internal validation was performed with an unseen dataset corresponding to the remaining 20% to assess model generalizability and robustness.
The model hyperparameters were obtained by performing a grid search strategy, a method for hyperparameters optimization that methodically builds and evaluates a model for each combination of algorithm parameters specified in a grid.
In order to avoid redundant information, prevent the models from becoming unstable in the presence of strong feature dependencies and to improve their interpretability, features with high correlation (>80%) were identified with a Spearman’s rank-order correlation matrix (Fig. 3). From each pair of high correlated features, the one with the larger p-value in the univariate statistical test was excluded from the models. Following this criterion, the extent degrees and the distribution of the opacities in the medium lung field were discarded.

Three models were developed with different predictive variables, the first one containing the epidemiological (age, sex, institutionalization and comorbidities) and all the above mentioned radiological features. The clinical (symptoms and SatO2/FiO2) and all the above mentioned laboratory parameters were incorporated into the first model to build the second model, and finally the CNN-derived based data were incorporated into the second model to build the third model. A partial under-sampling methodology followed by a synthetic minority over-sampling technique (SMOTE) was used to address the data imbalance problem, very common in Machine Learning environments.16 Features were standardized accordingly.
As a method for dimensionality reduction and to evaluate the impact of each feature, the variable importance was calculated. This importance is a measure of by how much removing a variable decreases accuracy, and vice versa — by how much including a variable increases accuracy. The default method to compute variable importance is the mean decrease in impurity (or gini importance) mechanism: At each split in each tree, the improvement in the split-criterion is the importance measure attributed to the splitting variable, and is accumulated over all the trees in the forest separately for each variable. Note that this measure is quite like the R^2 in regression on the training set. If a variable has very little predictive power, removing it may lead to an increase in accuracy due to random noise.
Sensitivity, specificity, PPV, NPV, AUC-ROC and precision-recall curves (AUC-PRC) were obtained for each model. The Youden index was used for the optimal threshold selection of the classification model, by maximizing the highest sensibility and NPV for critically ill (or dead) patients and the highest specificity and PPV for the mild severity (or alive) ones. The optimal thresholds were defined on the training data set. A weighted micro-average statistical approach is used to obtain the values per severity level after threshold optimization of the classification model with the Youden index. A macro-average will compute the metric independently for each class and then take the average (hence treating all classes equally), whereas a micro-average will aggregate the contributions of all classes to compute the average metric, which is particularly useful when the dataset varies in size. In order to test for a potential overestimation of the diagnostic model performance, the metrics were obtained by evaluating the same thresholds on the internal validation data set. DeLong's test for two correlated ROC curves17 was used to compare the performance of the models.
The following Python and Machine Learning libraries were used to perform the data visualization and statistical analysis in the study: Pandas, Numpy, SciPy, Matplotlib and Scikit Learn.
ResultsPatientsFrom 445 registered patients, 5 were excluded (1 acute appendicitis, 1 cholangitis, 1 diverticulitis, 1 ictus stoke and 1 cardiac failure). A total final population of 440 was enrolled in the study.
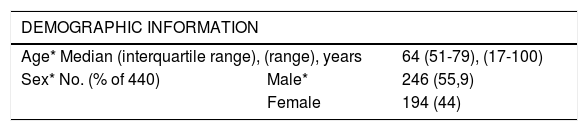
Demographics, comorbiditiesThe median age was 64 years (range 17-100) and 55.9% were male. 79% suffered ≥1 comorbidities; the most frequent were hypertension, dyslipidaemia and diabetes (Table 1).
Characteristics of COVID-19 patients. Demographic variables and comorbidities investigated as potential predictors. * Predictors in the final prognostic prediction models.
| DEMOGRAPHIC INFORMATION | ||
|---|---|---|
| Age* Median (interquartile range), (range), years | 64 (51-79), (17-100) | |
| Sex* No. (% of 440) | Male* | 246 (55,9) |
| Female | 194 (44) | |
| COMORBIDITIES | No. (% of 440) |
|---|---|
| Hypertension | 191 (43,4) |
| Dislypemia | 125 (28,4) |
| Diabetes | 93 (21,1) |
| Institutionalization | 75 (17) |
| Cardiovascular disease | 56 (12,7) |
| Immunosuppression | 46 (10,5) |
| Corticotherapy and other immunosuppressors | 16 (3,6) |
| Advanced chronic kidney disease/Dialysis | 13 (2,9) |
| Hematological neoplasm / disease | 10 (2,3) |
| Solid organ trasplant | 8 (1,8) |
| Human immunodeficiency virus | 1 (0,2) |
| Chronic kidney disease (total) | 43 (9,8) |
| Obesity | 42 (9,5) |
| Cerebrovascular disease | 36 (8,2) |
| Neoplasm | 32 (7,3) |
| Asthma | 25 (5,7) |
| Dementia | 19 (4,3) |
| Current smoker | 16 (3,6) |
| Obstructive sleep apnea | 16 (3,6) |
| Ex-smoker | 15 (3,4) |
| Hypothyroidism | 13 (2,9) |
| Atrial fibrillation | 13 (2,9) |
| Chronic obstructive pulmonary disease | 9 (2) |
| NUMBER OF COMORBIDITIES | No. (% of 440) |
|---|---|
| None | 92 (20,9) |
| 1 | 87 (19,8) |
| 2 | 68 (15,4) |
| 3 | 54 (12,3) |
| ≥ 4 (4-8) | 139 (31,5) |
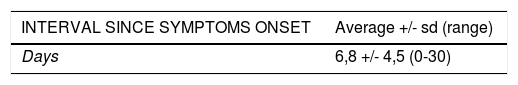
Upon their arrival to ED the average of days with symptoms was 6.8 (range 0-30) and the most common symptoms were by this order fever and cough. The average oxygen saturation was 93.7% (range 55-100%). There was loss of ≥1 laboratory parameters in 67 patients because they had not been performed (Table 2).
Clinical presentation of COVID-19 patients. Clinical and laboratory variables investigated as potential predictors. Gastrointestinal symptoms: diarrhea, vomiting or abdominal pain. SatO2/FiO2: Peripheral oxygen saturation /inspiratory oxygen fraction (room air or oxygen therapy). * Predictors in the definitive prognostic prediction models.
| INTERVAL SINCE SYMPTOMS ONSET | Average +/- sd (range) |
|---|---|
| Days | 6,8 +/- 4,5 (0-30) |
| SYMPTOMS Total No. 441 | No. (%) |
|---|---|
| Fever | 361 (82) |
| Cough | 287 (65,2) |
| Dyspnea | 178 (40,4) |
| General dyscomphort/Asthenia | 171 (38,9) |
| Gastrointestinal symptoms | 103 (23,4) |
| Myalgias | 72 (16,4) |
| Headache | 47 (10,7) |
| Hyposmia/Dysgeusia | 32 (7,3) |
| OXYGEN SATURATION | Average +/- sd (range) |
|---|---|
| Sat 02 (air room) | 93,7 +/- 5,6 (55-100) |
| Sat 02 /Fi O2* | 443,5 +/-34,4 |
| LABORATORY DATA | Average/ Min / 25% / Median / 75% / Max |
|---|---|
| Lactic dehydrogenase (U/l) * | 306 / 16 / 218,2 / 265,5 / 349,7 / 2146 |
| C reactive protein (mg/l) * | 81 / 0,3 / 15,5 / 44,6 / 117,2 / 655,5 |
| Lymphocytes count (x103µ/l) * | 1,2 / 0,06 / 0,7 / 1 / 1,4 /12,3 |
| Platelets count (x103µ/l) * | 203,7 / 32 / 150 / 193 / 242 / 716 |
| Dimer D (ng/l) * | 1390 / 83 / 350 / 608 / 1015 / 38282 |
13.6% patients were discharged at home or hospitalized ≤ 3 days; 64% patients were hospitalized (4-54 days, average 17 days); 6.6% required intensive care (2-65 days, average 18 days in ICU) and 15.7% died (0-51 days after admission, average 10 days).
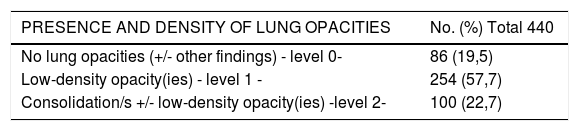
Chest X-ray reviewThe median time between CXR and Real-Time reverse transcription Polymerase Chain Reaction (RT-PCR) was 1 day (range 0-30). 65.9% of patients with pending RT-PCR result showed suggestive COVID-19 lung involvement on CXR, anticipating the definitive diagnosis. The ExtScoreCXR was 3.3 +/- 3.07 (average +/- SD) (Table 3).
Lung involvement on CXR, distribution and extension. CXR features investigated as potential predictors. ExtScoreCXR: Extent score of lung involvement on CXR. * Predictor in the final prognostic prediction models.
| PRESENCE AND DENSITY OF LUNG OPACITIES | No. (%) Total 440 |
|---|---|
| No lung opacities (+/- other findings) - level 0- | 86 (19,5) |
| Low-density opacity(ies) - level 1 - | 254 (57,7) |
| Consolidation/s +/- low-density opacity(ies) -level 2- | 100 (22,7) |
| DISTRIBUTION/LOCATION OF LUNG OPACITIES | No. (%) Total 354 |
|---|---|
| Bilateral | 212 (59,9) |
| Unilateral | 142 (39,8) |
| Peripheral (only or predominantly) | 182 (51,1) |
| Peripheral and central (without predominance) | 116 (32,5) |
| Central (only or predominantly) | 56 (15,7) |
| Lower fields | 290 (81,4) |
| Medium fields | 259 (72,7) |
| Upper fields | 178 (50) |
| EXTENT DEGREES OF LUNG OPACITIES | No. (%) Total 440 |
|---|---|
| No lung opacities (+/- other findings) - level 0- | 86 (19,5) |
| Mild | 66 (15) |
| Moderate | 111 (25,2) |
| Extensive | 101 (22,9) |
| Very extensive | 76 (17,3) |
| SCORE OF LUNG INVOLVEMENT EXTENSION * | Average +/- sd (range) |
|---|---|
| Punctuation (ExtScoreCXR) | 3,3 +/- 3,07 (0-12) |
From 76 patients initially discharged at home 24% were admitted in a second visit to ED. The first CXR of these patients was normal in 7 and showed very slight or difficult to interpret opacities in 11; in the second visit all presented progression of the lung involvement.
Computational Imaging (Artificial Intelligence Data)Probability indices - average +/- standard deviation (range)- for “consolidation”, “lung opacity” and “abnormal CXR” obtained from CXR of the population studied were 0,39 +/-0,19 (0-0,84); 0,47 +/-0,25 (0-0,98) and 0,98 +/-0,13 (0-1) respectively.
Univariable analysis. Lung involvement extension in CXRThe lung involvement extent -degrees and score- showed poor correlation with days of symptoms duration (r = 0.198 and r = 0.176, respectively, p-value<0.001), strong negative correlation with SatO2/FiO2 (r=-0.53 and r=-0.57, respectively, p-value<0.001), strong-moderate correlation with the severity level (r = 0.536 and r = 0.491, respectively, p-value<0.001), poor correlation with days of hospitalization (r = 0.240 and r = 0.246, respectively, p-value<0.001), no significant correlation with ICU stay days, and poor-moderate correlation with mortality (r = 0.277 and r = 0.310, respectively, p-value <0.001).
Prognostic prediction modelsThe SatO2/FiO2 (33%), the CNN-based index for lung consolidation (13%), the LDH (12%), the ExtScoreCXR (9%), the age (9%), the lymphocyte count (9%), the CRP (7%), the CNN-based index for lung opacities (3%), the D-dimer level (3%), and the platelets count (2%) were, in this order, the most important predictors of severity level outcome for the most severe group of patients (Fig. 4). The values in parenthesis correspond to the variable importance in the developed model.
: oxygen saturation/inspired oxygen fraction (SatO2/FiO2) (33%), convolutional neural network (CNN)-based index for lung consolidation on chest X-ray (CXR) (13%), lactate dehydrogenase (LDH) (12%), extent score of lung involvement on CXR (ExtScoreCXR) (9%), age (9%), lymphocyte count (9%), C-reactive protein (CRP) (7%), CNN-based index for lung opacities on CXR (3%), D-dimer level (3%) and platelets count (2%); and mortality (down): age (54%), SatO2/FiO2 (14%), the lymphocyte count (10%), LDH (8%), CNN-based index for lung consolidation on CXR (7%), platelets count (4%) and D-dimer level (3%). Those with an importance of less than 0.01 are excluded from the model.")
Importance of model predictors obtained for the severity level (up): oxygen saturation/inspired oxygen fraction (SatO2/FiO2) (33%), convolutional neural network (CNN)-based index for lung consolidation on chest X-ray (CXR) (13%), lactate dehydrogenase (LDH) (12%), extent score of lung involvement on CXR (ExtScoreCXR) (9%), age (9%), lymphocyte count (9%), C-reactive protein (CRP) (7%), CNN-based index for lung opacities on CXR (3%), D-dimer level (3%) and platelets count (2%); and mortality (down): age (54%), SatO2/FiO2 (14%), the lymphocyte count (10%), LDH (8%), CNN-based index for lung consolidation on CXR (7%), platelets count (4%) and D-dimer level (3%). Those with an importance of less than 0.01 are excluded from the model.
The ROC and the PRC curves of the internal validation performed with an unseen dataset for the severity level prognostic predictive models built with three different combinations of features are shown in Fig. 5. The curves per severity level are obtained after applying a one-vs-all classification methodology. An improvement of the AUC-ROC and AUC-PRC is observed for both the most and least critically ill patients, as more features are included in the model. In particular, the larger effect is obtained when adding the clinical and laboratory parameters (micro-average AUC-ROC = 0.94, micro-average AUC-PRC = 0.88). The addition of the CNN-based indices increases the AUC-PRC value of the patients belonging to the extreme severity levels but has the opposite effect on the mid-severity level ones, resulting in a worsening of the predictive metrics (micro-average AUC-ROC = 0.91, micro-average AUC-PRC = 0.82) (Table 4).
 and the PRC (down) curves of the internal validation performed with an unseen dataset for the severity predictive models built with three different combinations of parameters. (A: epidemiological and radiological parameters, B: epidemiological, radiological, clinical and laboratory parameters, C: epidemiological, radiological, clinical, laboratory and CNN-based parameters). The curves per severity level are obtained with a one-vs-all classification methodology: home discharge or hospitalization ≤ 3 days (level/class 0, in light blue), need for hospital stay >3 days (level/class 1, in orange), need for ICU stay or death due to COVID-19 (level/class 2, in blue). The dashed lines represent the micro-average (magenta) and macro-average (dark blue) curve statistics which take into account the single level contributions. The corresponding values of AUC are shown. Precision = true positive / (true positive + false positive). Recall (sensitivity) = true positive / (true positive + false negative).")
The ROC (up) and the PRC (down) curves of the internal validation performed with an unseen dataset for the severity predictive models built with three different combinations of parameters. (A: epidemiological and radiological parameters, B: epidemiological, radiological, clinical and laboratory parameters, C: epidemiological, radiological, clinical, laboratory and CNN-based parameters). The curves per severity level are obtained with a one-vs-all classification methodology: home discharge or hospitalization ≤ 3 days (level/class 0, in light blue), need for hospital stay >3 days (level/class 1, in orange), need for ICU stay or death due to COVID-19 (level/class 2, in blue). The dashed lines represent the micro-average (magenta) and macro-average (dark blue) curve statistics which take into account the single level contributions. The corresponding values of AUC are shown. Precision = true positive / (true positive + false positive). Recall (sensitivity) = true positive / (true positive + false negative).
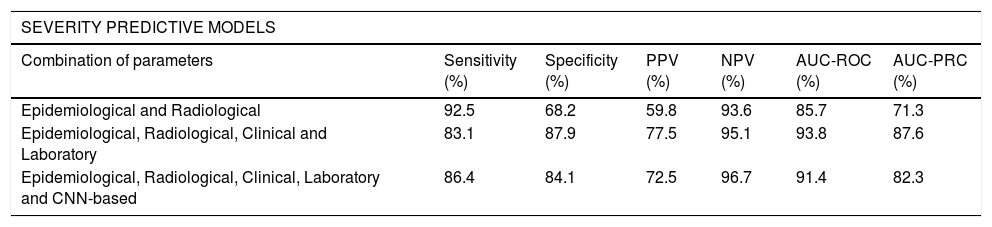
Metrics of the severity and mortality predictive models. Performance metrics of the internal validation performed with an unseen dataset for each of the selected severity and in-hospital mortality predictive models built with three different combinations of parameters. The Youden index was used for the optimal threshold selection of the classification models. RF: Random Forest, GB: Gradient Boosting.
| SEVERITY PREDICTIVE MODELS | ||||||
|---|---|---|---|---|---|---|
| Combination of parameters | Sensitivity (%) | Specificity (%) | PPV (%) | NPV (%) | AUC-ROC (%) | AUC-PRC (%) |
| Epidemiological and Radiological | 92.5 | 68.2 | 59.8 | 93.6 | 85.7 | 71.3 |
| Epidemiological, Radiological, Clinical and Laboratory | 83.1 | 87.9 | 77.5 | 95.1 | 93.8 | 87.6 |
| Epidemiological, Radiological, Clinical, Laboratory and CNN-based | 86.4 | 84.1 | 72.5 | 96.7 | 91.4 | 82.3 |
| MORTALITY PREDICTIVE MODELS | |||||||
|---|---|---|---|---|---|---|---|
| Combination of parameters | Model Architecture | Sensitivity (%) | Specificity (%) | PPV (%) | NPV (%) | AUC-ROC (%) | AUC-PRC (%) |
| Epidemiological and Radiological | RF | 71.8 | 90.3 | 59.5 | 92.2 | 86.7 | 69.3 |
| Epidemiological, Radiological, Clinical and Laboratory | GB | 90.0 | 93.7 | 69.2 | 98.3 | 96.5 | 77.9 |
| Epidemiological, Radiological, Clinical, Laboratory and CNN-based | GB | 90.0 | 92.1 | 64.3 | 98.3 | 97.1 | 83.4 |
Regarding the clinical outcome of mortality, the best model is achieved with a Gradient Boosting classifier with the inclusion of the selected epidemiological, radiological, clinical, and laboratory parameters and the CNN-based indices (AUC-ROC = 0.97, AUC-PRC = 0.83). The age (54%), the SatO2/FiO2 (14%), the lymphocyte count (10%), the LDH (8%), the CNN-based index for lung consolidation on CXR (7%), the platelets count (4%) and the D-dimer level (3%) were, in this order, the most weighted predictors of in-hospital mortality (Fig. 4). A decrease in these metrics is observed when the CNN-based indices are removed from the model (AUC-ROC = 0.97, AUC-PRC = 0.78) but an improvement on the PPV and specificity of the model is achieved by means of threshold optimization with the Youden index (Table 4). In this case, the age (43%), the SatO2/FiO2 (20%), the CRP (15%), the LDH (7%), the ExtScoreCXR (6%), the lymphocyte count (6%) and the D-dimer level (3%) were, in this order, the most weighted predictors. There were no statistically significant differences in terms of the AUC-ROC between the models with and without CNN-based indices (p-value = 0.315), suggesting that the addition of the AI parameters does not offer a significant additional improvement on the model performance. Fig. 6 shows the ROC and the PRC curves of the internal validation performed with an unseen dataset for a selection of three classification mortality models built with three different combinations of features.
 and the PRC (down) curves of the internal validation performed with an unseen dataset for the in-hospital mortality predictive models (SVM: Support Vector Machine (blue), RF: Random Forest (green), GB: Gradient Boosting) (orange) built with three different combinations of parameters (A: epidemiological and radiological parameters, B: epidemiological, radiological, clinical and laboratory parameters, C: epidemiological, radiological, clinical, laboratory and CNN-based parameters). The corresponding values of AUC are shown.")
The ROC (up) and the PRC (down) curves of the internal validation performed with an unseen dataset for the in-hospital mortality predictive models (SVM: Support Vector Machine (blue), RF: Random Forest (green), GB: Gradient Boosting) (orange) built with three different combinations of parameters (A: epidemiological and radiological parameters, B: epidemiological, radiological, clinical and laboratory parameters, C: epidemiological, radiological, clinical, laboratory and CNN-based parameters). The corresponding values of AUC are shown.
In this study, the presence and extent of lung involvement on the initial CXR of COVID-19 patients has a prognostic value. In the univariable analysis the ExtScoreCXR showed moderate correlation with the severity level and mortality, and in the first developed multivariable models based on age, gender and radiological features, the ExtScoreCXR was the strongest predictor of severity and the second predictor of in-hospital mortality after age. However, the addition of other parameters usually registered at admission significantly improved the predictive accuracy of the models. These results demonstrate the greatest usefulness of CXR score as a prognostic tool in COVID-19 when considered together in a model with the SatO2/FiO2, the age, the LDH, the lymphocyte count, the CRP, the D-dimer level and the platelets. The distribution and the density of opacities were not strong enough to remain predictors in the definitive models and the indices of CNN-based diagnostic tool did not improve significantly the predictive metrics, probably because the extension was not quantified. On the other hand, despite a careful analysis of the imaging, overlapping of structures, slight or indeterminate opacities and normal CXR are not uncommon (31.8% in our series). Therefore the integration of the ExtScoreCXR into a prognostic model attempts the safe decision-making, avoiding discharge at home of patients requiring hospital care and unnecessary hospitalizations or CT overuse.
We also confirmed the strong negative correlation between lung involvement extent and SatO2/FiO2. It supports the widely accepted indication of CT pulmonary angiography in case of oxygen desaturation or dyspnea and normal or mild lung involvement on CXR,18 looking for extended slight lung opacities not visible on CXR or pulmonary thrombosis/embolism.19 In concordance with this, in both developed prognostic models the SatO2/FiO2 showed to be a strong predictor.
In the literature, COVID-19 CXR opacification rating scores in ED were predictive of risk for hospital admission and intubation in patients aged 21-506 and of time to intubation, independent of comorbidities.8 The extent of lung involvement was also associated to worse outcomes in severe acute respiratory syndrome.20,21
The most reported predictors of severe prognosis in patients with COVID-19 included age, sex, features derived from CT, CRP, LDH, and lymphocyte count11,22 and the most published predictors of mortality are older age23–25 and D-dimer level.22,23 These predictors coincide with most of those we have observed in the multivariable analysis and included in the predictive models.
Days with symptoms, clinical presentation, institutionalization, comorbidities and the rest of CXR features did not show enough predictive power (variable importance <1%) to be included in the models. The number of days with symptoms on arrival of patients to ED was not related to the lung involvement extension. In other series neither a significant difference was identified between the severe and non-severe patients, regarding the median days from symptom onset to hospital admission.26 Tobacco, comorbidities as obesity, hypertension, diabetes, cardiovascular disease, respiratory diseases, cancer history and the presence of fever, dyspnea, haemoptysis and unconsciousness, were also associated to a worse prognosis in some publications,25,27–29 but not in our study. There is probably a data collection bias from the medical records, especially obesity may be underreported. But apparently, the comorbidities and symptoms have a lower relative predictor weight with respect to the definitive variables of the models. The larger impact of the SatO2/FiO2, the ExtScoreCXR and the laboratory parameters raises the need of performing these tests to all COVID-19 patients with respiratory symptoms or persistent systemic symptoms. This prognostic approach could early identify patients who would benefit from more specific treatment or hospitalization.
The National Early Warning Score 2 (NEWS2), based on vital signs, is the most used score in ED. Its predictive accuracy in COVID-19 patients is higher than other clinical risk scores.30,31 Nevertheless, the models developed in this study exceed this accuracy with an AUC-ROC = 0.94 and an AUC-ROC = 0.97 for severity and mortality respectively, as expected because the addition of other relevant variables. A specific COVID-19 risk score was developed to predict clinical illness at admission with ten variables including the CXR abnormality as predictor, but without extent assessment; it showed an AUC-ROC of 0.88.29 Another multivariable model including CXR at admission was constructed to predict critical illness in hospitalized COVID-19 patients.7 The predictors that remained in the model were male gender, obstructive lung disease, symptom duration > 7 days, neutrophil count, CPR, LDH, distribution of lung disease and CXR score, with an AUC-ROC = 0.77. The CPR, the LDH and the lung involvement extension on CXR are also included in our final model but there are no further coincidences in the rest of predictors. This is probably explained by the different model development methodologies including a different feature selection strategy, as they used a univariable statistical test and we based our selection on the correlation between parameters and with respect to the clinical outcome. Other discrepancies include the data pre-processing steps, as we included a combination of some over- and under-sampling techniques as well as data standardization; and the consideration of different model architectures, as they employed a multivariable logistic regression, which relies on transformations for non-linear features. In order to overcome this issue, we tested three different model architectures: Support Vector Machine, Random Forest and Gradient Boosting, which can handle non-linear features as well as their interactions, and perform well in a large feature space.
As potential sources of bias, the severity level is a decision-based clinical outcome, unlike mortality. In order to reduce this bias we grouped at level 0 not only home discharge from the ED but also hospitalization ≤ 3 days. In addition, the follow-up of at least 2 months included patients who returned to the hospital. In these cases all the variables collected were also those obtained from the first visit to the ED but the event considered as outcome was the most severe. In fact, the proportion of the most severe patients (22%) was within the range published in longer series (15-36%).32,33
Regarding the proposed method to quantify the extent of lung involvement (ExtScoreCXR), we have not analyzed interobserver agreement. On the other hand, a good interobserver agreement was demonstrated with the use of Brixia, a more complex score designed for COVID-19 patients,9 and coincidentally we have used the same score as other authors, who have recently published its good correlation with Brixia score.15
The internal validation was performed with 88 cases. However, it has been reported that a minimum sample size of 100 is recommended in order to achieve a robust validation.34 An external validation with cases from other hospitals is desirable to assess the generalizability and the potential use of the developed models in daily clinical practice.
In conclusion, the developed multivariable prognosis prediction models showed a high predictive accuracy that could allow triage of symptomatic COVID-19 patients at ED to improve the decision-making. The application to estimate the severity level and the in-hospital mortality is available on http://upv.datahub.egi.eu:30054/hulafecovid19models. It should be validated at different ED for both COVID-19 and other viral infections with similar behaviour.
Authors contributions- 1
Guarantor of integrity of the entire study: L.M.B.
- 2
Study concepts and design: P.C.B., L.M.B., L.C.A.
- 3
Literature research: P.C.B., L.M.B.
- 4
Clinical studies: P.C.B., C.F.E., A.C.O., C.F. M.N., L.T.O.
- 5
Data analysis: L.C.A.
- 6
Statistical analysis: L.C.A.
- 7
Bibliographic search: P.C.B., L.C.A.
- 8
Manuscript preparation: Pilar Calvillo-Batllés, Leonor Cerdá-Alberich
- 9
Manuscript editing Pilar Calvillo-Batllés, Leonor Cerdá-Alberich, Luis Martí-Bonmatí.
- 10
Review and approval of the final version: all authors.
The authors declare that they have no conflicts of interest.
Acknowledgments to all the personnel working at University and Polytechnic La Fe Hospital for their dedication during the COVID-19 pandemic and specially to Carlos Baeza, José Sánchez, Ignacio Gómez, Ana Gil, Rodrigo Blanco, Pau Lozano, Alberto García, Marta Montero, Pilar Estellés, Javier Millán and Cristina Aguado.
The following is Supplementary data to this article:
Please cite this article as: Calvillo-Batllés P, Cerdá-Alberich L, Fonfría-Esparcia C, Carreres-Ortega A, Muñoz-Núñez CF, Trilles-Olaso L, et al. Elaboración de modelos predictivos de la gravedad y la mortalidad en pacientes con COVID-19 que acuden al servicio de urgencias, incluida la radiografía torácica. Radiología. 2022;64:214–227.

