


Bibliometric indicators have been devised to quantify scientific production and to try to evaluate its impact in the community. In general, bibliometric indicators can be classified according to whether the unit of analysis is the author (individual or group) or journal. The most widely used indicators for authors are those that measure an individual author’s production, such as the Crown index or the h-index and its derivatives (e-index, h5-index, and the absolute or Ab-index, among others). The bibliometric indicators devised to try to evaluate journal quality are associated with Journal Citation Reports (e.g., impact factor, field-weighted citation impact, Eigenfactor, and article influence) or with Scopus (Scimago Journal Rank (SJR), source normalized impact per paper (SNIP), and CiteScore). This article describes the main bibliometric indicators, explains how they are calculated, and discusses their advantages and limitations.
Los indicadores bibliométricos surgen para cuantificar la producción científica e intentar evaluar su impacto en la comunidad. De forma general, se pueden dividir en indicadores bibliométricos de autores (individuales y de colaboración) y de revista. Los más extendidos dentro del primer grupo son los que miden la producción individual del autor, como el índice de Crown y el índice h y derivados (índice e, índice h5 y el absoluto o Ab-index, entre otros). Los indicadores bibliométricos creados para intentar valorar la calidad de la revista son los asociados al Journal Citation Reports (como factor de impacto, el impacto ajustado a un campo de investigación, eigenfactor y la influencia por artículo) o asociados a Scopus [Scimago Journal Rank (SJR), el impacto por artículo normalizado por la fuente de cita (SNIP) y CiteScore). El objetivo de este artículo es presentar los principales indicadores bibliométricos, explicar cómo se calculan y discutir sus ventajas y limitaciones.
Bibliometrics was defined by Alan Pritchard in 1969 as the application of mathematical and statistical methods to scientific publications, and to the authors who produce them, to evaluate and classify scientific activity;1 later, Eugene Garfield described it as "the quantification of bibliographic information which can be analysed".2 Thanks to this analysis, we are able to study the size, growth and distribution of scientific documents and to analyse the structure and dynamics of the groups that produce and consume said documents.3,4
To quantitatively express the bibliographic characteristics of a document or set of documents, bibliometric indicators (BI) are used. These indicators are numerical data representing different features of scientific activity linked to both the production and use of information.5 BIs are calculated in an objective and reproducible way6 from a large volume of data available in international reference databases.7
The three main databases that offer bibliometric analysis and citation searches are Scopus, Web of Science and Google Scholar.8 Each has its own metrics in addition to certain standard metrics like the h-index.
Scopus was created by Elsevier in 2004.9 It has indexed more than 20,000 science, technology, medicine, social science, art and humanities journals. It also includes books and conference proceedings. Its own metrics are SCImago Journal Rank (SJR) and Source Normalized Impact by Paper (SNIP).
The Web of Science is on the Clarivate Analytics Web of Knowledge (WOK) platform.10 It indexes about 11,000 journals selected according to the number of citations they receive. Its most important metric is the well-known impact factor.
Google Scholar11 is a free search engine, which indexes the full texts of many articles along with an index of citations that helps give an idea of each one's impact.12 It also includes other publication formats such as books, theses, technical reports, patents and books of abstracts from scientific congresses.
Other journal databases (although they do not incorporate metric indexes or perform citation reports) are Medical Literature Analysis and Retrieval System Online or MEDLARS Online (MEDLINE)13 (which includes Public Medline (PubMed) Central) with over 25,000 indexed journals and Excerpta Medica Database (EMBASE),14 which includes around 9000 journals.
Assuming that the result of a research study is new knowledge which is being disseminated through the publications, BI are valid for evaluating scientific production and its impact on the community.15 They can therefore be used to plan and rationalise the financial resources allocated to the research.16
The aim of this article is to describe the main BIs, explain how they are calculated and discuss their advantages and limitations.
Types of bibliometric indicatorOne of the most widely used general classifications divides BIs into qualitative (related to the quality of a journal, such as the impact factor) and quantitative (can be measured numerically, such as the h-index).3 However, to obtain a qualitative index, quantitative criteria must be used, as it is calculated by "counting" the number of citations. To avoid confusion about how they are calculated and what exactly they measure, in this article we use a classification system that divides the BIs according to whether they apply to authors/research groups or journals.
Author or group indicatorsThere is a growing interest in objectively evaluating the effective contribution of a researcher or a research group and, with that, its actual scientific impact, in order to establish the differences. With this in mind, six categories have been established: indicators of scientific activity; indicators of scientific production and impact; indicators of collaboration; indicators of dissemination; indicators of production; and indicators of health service impact.17 The most widely used are the indicators of scientific production and of collaboration.
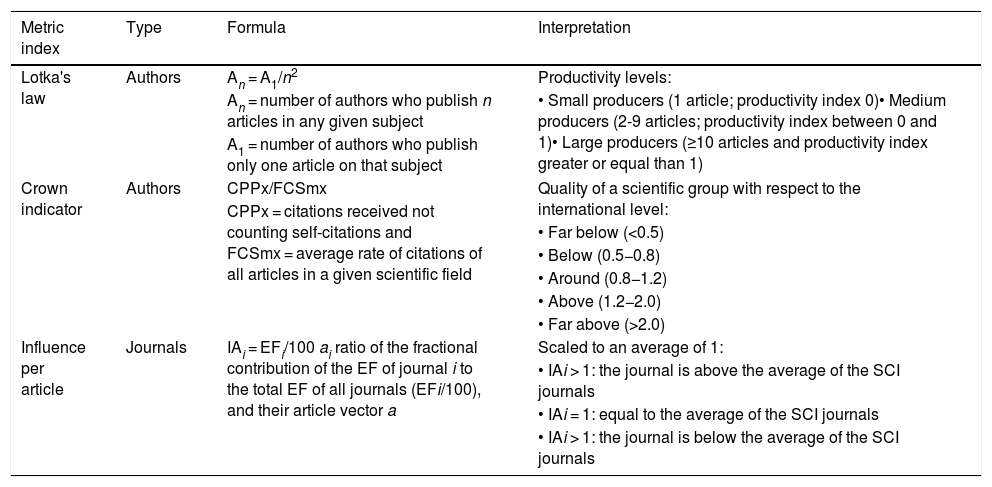
Indicators of scientific production1. Total number of publications. Can be applied to both authors and groups and simply considers the number of articles they have produced. The index is governed by Lotka's law of scientific productivity, which establishes that the number of authors who publish n papers on a subject is inversely proportional to the square of those n published articles18,19 (Table 1). One limitation is that it does not take into account the number of authors, where the journals it is published in are indexed, the citations it has received or the type of article (same treatment whether original article or scientific letter). It is therefore a biased measurement of productivity and does not analyse the actual impact a scientific study makes.
Formulas and interpretation of some metric indices.
| Metric index | Type | Formula | Interpretation |
|---|---|---|---|
| Lotka's law | Authors | An = A1/n2 | Productivity levels: |
| An = number of authors who publish n articles in any given subject | • Small producers (1 article; productivity index 0)• Medium producers (2-9 articles; productivity index between 0 and 1)• Large producers (≥10 articles and productivity index greater or equal than 1) | ||
| A1 = number of authors who publish only one article on that subject | |||
| Crown indicator | Authors | CPPx/FCSmx | Quality of a scientific group with respect to the international level: |
| CPPx = citations received not counting self-citations and FCSmx = average rate of citations of all articles in a given scientific field | |||
| • Far below (<0.5) | |||
| • Below (0.5−0.8) | |||
| • Around (0.8−1.2) | |||
| • Above (1.2−2.0) | |||
| • Far above (>2.0) | |||
| Influence per article | Journals | IAi = EFi/100 ai ratio of the fractional contribution of the EF of journal i to the total EF of all journals (EFi/100), and their article vector a | Scaled to an average of 1: |
| • IAi > 1: the journal is above the average of the SCI journals | |||
| • IAi = 1: equal to the average of the SCI journals | |||
| • IAi > 1: the journal is below the average of the SCI journals |
2. Crown indicator. This indicator, also known as field normalised citation score,20 addresses the variability between the number of citations according to the scientific area and the years of publication (an old article will have more citations than one just published).21,22
It is calculated by dividing the average number of citations received by the articles of a researcher or research group (excluding self-citations) in a field of interest during a period of time, by the average number of citations received by all the articles published in scientific journals of that field in that same time20–23 (Table 1).
Its main advantage is that it can compare the impact of production on researchers from different disciplines.24 However, one limiting problem is the inadequate classification of an article in a field, which happens frequently in radiology: a radiological article published in a general journal will not be assigned to the field of imaging and will not contribute to the calculation of the index in that field.25 It is also affected by the size of the research group, as the more researchers involved, the greater the number of publications for the group. It is therefore better to use it to compare research groups with a similar number of members.20
3. H-index and its variants. The h-index, proposed by Hirsch in 2005, is one of the best-known author productivity indicators, but it can also be used to analyse the production of departments or research groups, and to compare the average h-index of all universities or faculties in a country with similar research fields.26 It is defined as the number [h] of articles published by the author, out of their total number [N] of published articles, with at least [h] citations each, while the rest [N-h] of their published articles have been cited less than [h] times each26 (Fig. 1). This explains why the increase in the h-index is increasingly slow in the scientific life of an author and why it does not provide information on citations of the articles which are above the index and which may have a large impact.27 To solve that, the information provided by the h-index can be complemented by the e-index, which considers the extra citations of the articles counted for the h-index; that is, if an author has an h-index of 5, the e-index is calculated with citations over the number of 5 for the 5 articles that count for the h-index, making it possible to assess the rate of citation of those articles.28 It has been shown that there is a relationship of exponential growth between the h-index and academic grade.29

H-index. The figure shows how an author's h-index goes up from 10 to 11. At time A, the author has an h-index of 10. Note how the "n" articles which have "n" or more citations coincide at 10. The author has published 14 articles of which 10 have had at least 10 citations, while the remaining four have been cited less than 10 times. At a later point B, article 10 has had one more citation. If that were all, it would still be true that only 10 of the articles have 10 or more citations, and the author's h-index would remain the same. However, in that time, article 11 has also been cited twice more and reached 11 citations. That means the author now has n = 11 articles with 11 or more citations and their h-index has gone up to 11. Note that the h-index will now remain the same regardless of the citations that those 11 articles continue to receive. To go up to 12, one of the three remaining articles (12, 13 or 14) will need to be cited until one of them reaches 12 citations. Finally, if we imagine that the author is never going to publish any more articles beyond these 14, their maximum h-index will never go above 14.
The h-index has two main limitations. The first is its temporal nature, as it does not give a real measure of an author's current production or dynamic information on their productivity; an author may have a high h-index thanks to old articles.27 This limitation can be addressed with variants of the h-index such as:
- •
Author impact factor or h5-index: restricted to citations of articles published in the last five years.30
- •
M-quotient: divides the h-index by the number of years since the author published their first article, so researchers can be compared at different points in their careers.31
- •
Contemporary h-index(hc): multiplies the citations of an article by four and divides the product by the number of years since the article was published.27 This gives more value to the citations of the more recent articles over the older ones, which makes it possible to differentiate two researchers with the same h-index, but scientific careers of different lengths.
The second limitation of the h-index is that the greater the number of authors, the more difficult it is to quantify their real contribution in each article and they are all scored equally. This limitation can be addressed with the weighted h-index (w), which gives more value to the first author and the corresponding author than to the rest of the co-authors, who are scored in decreasing order.27 Additionally, the h-index does not take into account collaboration between authors from different groups. For example, an author can be in multiple groups and "accumulate" h-index without having an important position in the author list. The collaboration index or A index takes this fact into account by assigning relative values to the co-authors of an article, dividing scores according to a group ranking system.32,33 More recently, an absolute index (Ab-index) has been described, which reflects the individual scientific contribution in their field of research, adjusted by age groups and number of authors: when the number of authors increases, the score for each decreases, with the loss suffered by the first author greater with respect to the rest.34
The h-index may vary depending on the database consulted: for example, an author's h-index in Scopus (which collects data from 1996 on) may be lower than the one in Google Scholar, which calculates it over a longer period of time.27
Indicators of collaborationCollaboration between authors is considered the most common form of interaction between scientists35 and usually culminates in the joint publication of results.36
The collaboration indicators evaluate this interaction between researchers and can be calculated by author, institution and country of affiliation.
Collaboration between researchers can take different forms, depending on who is involved in that collaboration and their degree of involvement.37 For example, a novice researcher can carry out joint work with another more consolidated researcher (whose contribution may only be supervising the work). Collaboration can also be established between colleagues with a similar academic status and between institutions or organisations, as in national or international multicentre studies.
Of the collaboration indicators, the most widely used are the collaboration rate (or signature/work index), which measures the number of publications with multiple authorship, and the collaboration patterns, which allow individuals or institutions who produce the most joint publications to be identified.
Analysis of the collaboration indicators can also detect "honorary authorship" (including as co-authors department managers or heads for their position, but without them having done the work) or "acknowledgement authorship" (including technical support staff, i.e. in statistics, as author).35
Journal indicatorsIn general, it can be said that a scientific journal has scientific rigour if it meets a series of formal aspects such as periodicity of publication, definition of the editorial committee and publication of instructions to authors and reviewers. It is also important that it states whether or not review of the articles follows a peer review process (at least two subject matter experts). Although blind evaluation was traditionally considered a quality criterion, it is currently a controversial issue, as some journals do not anonymise the reviewers, while others do not even anonymise the authors, who will then know who is reviewing them.38,39 In addition to scientific rigour, there needs to be a way to assess the influence a given journal has within the scientific community, and that is what BIs are used for.
Impact factorIn 1955, Garfield founded the Institute for Scientific Information (ISI) in which he devised an index to measure the quality of scientific journals.7 This indicator first became known as an impact factor (IF) in 1963. In 1964 the ISI developed the Science Citation Index (SCI), which is one of the institutes's databases, but relevant in the field of medicine, as it includes the rigorously selected science and technology journals. Based on the SCI, the ISI began to calculate the IF of each of the journals included, at first sporadically and then annually from 1975, gaining importance when the results were published in the Journal Citation Reports (JCR). The scientific information indexed in the SCI is available online at the Web of Knowledge (WOK)10 and, within that, at the Web of Science (WOS).
ISI was sold to Thomson Scientific & Healthcare Corporation in 1992 (Thomson ISI), which in turn was sold to the Onex Corporation and Baring Private Equity Asia in 2018, a part of which is currently Clarivate Analytics.40
To calculate the IF of a journal in a specific year, citations and articles published in ISI (Clarivate) journals during the previous two years are taken into account27 (Fig. 2).
. To calculate the 2019 IF of a journal indexed in the Science Citation Index (SCI), you have to divide the number of citations in 2019 of articles published in this journal in 2017 and 2018 by the number of articles published in that journal over those same two years. They only compute the citations that come from journals included in the SCI for SCI journals, so only they have an official IF, which is what the Journal of Citation Report (JCR) publishes.")
Impact factor (IF). To calculate the 2019 IF of a journal indexed in the Science Citation Index (SCI), you have to divide the number of citations in 2019 of articles published in this journal in 2017 and 2018 by the number of articles published in that journal over those same two years. They only compute the citations that come from journals included in the SCI for SCI journals, so only they have an official IF, which is what the Journal of Citation Report (JCR) publishes.
The journals indexed in the SCI are classified into different disciplines, so it shows the journals most frequently cited in a particular field. Specifically, radiological journals are grouped under the category "Radiology, Nuclear Medicine, Medical Imaging". Within each specialist area, the journals are distributed into quartiles (Q1, Q2, Q3 and Q4) according to their IF, which establishes the scientific importance of each one in its field.41
As this is the first quantitative and objective journal index, the IF is the most accepted and widespread metric index within the scientific community.4
The IF takes into account self-citations within a journal, although Clarivate does not rate the author's self-citations from different journals.
The IF has several limitations. On the one hand, it evaluates and classifies journals, not the articles they publish or their authors.42 An author can publish in IF journals without afterwards obtaining any citation. On the other hand, not all the articles within the same journal count for the calculation of the IF, but there are no defined criteria for that.43
It also has an accessibility bias related to the language of publication. An article written in Spanish has less circulation and so less likelihood of being cited than one published in English.6
Temporal bias is another aspect that limits the application of the IF, as it is restricted to a two-year window. Lastly, the IF does not always imply more citations, because only citations from journals included in the SCI are computed in the calculation: a single citation to an article from a journal included in the SCI has an effect on its IF, while many citations to another article, but from journals not included in the SCI, do not.43 This is a problem for journals which, having scientific quality but a limited scope, ask to be included in the SCI, as the basic criterion of the ISI to index a new journal is the number of citations that come from their journals.44
In an attempt to mitigate these limitations, in 2015 the ISI created a new database in the WOS: the Emerging Sources Citation Index (ESCI),45 which includes journals in the process of being evaluated to become part of the WOS. By incorporating all the publications under evaluation, it gives them visibility and promotes greater clarity in the selection process.
Other indices included in the JCR1. "Field normalized citation score"/"Journal-to-field impact score" One of the limitations we have seen in the IF is that it does not allow us to compare journals within the same discipline, as there are subjects with less diffusion for which it is difficult to obtain an impact factor. To counter that situation, a centre for scientific and technological studies at the University of Leiden in the Netherlands proposed the Field normalized Citation Index (FNCI) to compare scientific production in different fields of research.46 It measures the average number of articles cited in a specific journal and compares this number with that of other journals in the same field of research.23
2. Eigenfactor (EF) and the Article Influence Score (AIS). The aim of these indices is to assess not only the number of citations, but the relative importance of a publication according to the type of citations it receives. More than the IF, the EF47 measures the influence of the journal on the scientific community, as it takes into account the quality of the journal from which the citation comes.48 As in the IF, the calculation is influenced by both the size of a publication (that is, the number of articles the journal publishes annually) and time, as it only includes articles published in the last five years.
The Eigenfactor measures the influence of the journal, but not the influence per article as the IF does. The size of the journal is not an indicator of the impact of its articles (WOS). Therefore, the bibliometric index is the influence per article (IA), which measures the average influence of the articles published in a specific journal i (Table 1).
An IAi value of 1 means that the influence per article is equal to the average of the SCI journals, while values above or below 1 would determine how much above or below the average the IA of a journal is compared to the average of the SCI journals.44
For example, in 2012, the AIS for Radiographics was 1.087, suggesting that the articles in Radiographics had more influence than the average for articles in the scientific literature.
Based on the Scopus database1. SCImago Journal Rank. The SJR was developed by SCImago Research Group of the University of Extremadura (Spain).49 Like the Eigenfactor, the SJR uses an algorithm to give weight to the citations according to the impact of the journal they come from.49 It is calculated from the Scopus journals and, unlike the EF, the citation window is restricted to the three years prior to the year for which the SJR is calculated. Self-citations are not excluded, but for the calculation, to reduce their metric influence, they cannot exceed 33% of all citations the journal receives.50
In 2012, a variant (SJR2) was introduced which measures the relationship between citations and cited journals, to determine the thematic categories of the journals, so that if those in the same field are cited, they have greater weight. Moreover, the SJR2 divides the prestige earned by a journal by the number of citable documents. The more a particular journal cites related journals, the more importance the journal gains in its respective discipline.51
2. Source-normalised impact per paper (SNIP). Like the SJR2, this index, created at the University of Leiden by H.F. Moed, gives greater weight to citations from the same scientific field.52 The SNIP uses the "articles", "conference abstracts" and "reviews" of the Scopus database as useful documents for calculating, and takes into account: a) the frequency with which the authors cite other articles, represented by the number of references in their articles (the references per article can be very different from one field to another, and the greater number of references, the greater chance of being cited); b) the speed with which the impact of the citation matures or the number of citations received in a year by the articles published in a journal in the citation window (for the SNIP it is three years so as not to disadvantage those disciplines with slow maturation); and c) how the journal base used covers the thematic field, which in the case of Scopus is 80%.52,53 This index can be used to compare journals from different disciplines. An example of how this index is interpreted is that a citation of an article with 200 references will count less than the citation of an article with 20 references.
3. CiteScore. Despite their potential utility as weighted indicators, SNIP and SJR are based on complex algorithms which make them not very transparent and difficult to reproduce. To complement them, it was necessary to develop new metrics in the Scopus database characterised by transparency, very broad coverage, frequency and stability.54 With these bases the CiteScore metrics were developed. The citation window is three years, as in all of Scopus, as this is an adequate time to include the half-life of articles in most disciplines, while they still remain recent.54,55 Moreover, unlike the other metrics, it includes all the articles published (except in the press), regardless of their characteristics, instead of using non-transparent categories without clearly defined criteria to decide which enter in the calculation as citable articles and which do not. CiteScore is the ratio between the number of citations received in the year of calculation for any article published in the journal in the previous three years.56
ConclusionBIs arose from the need to quantify scientific production. There are numerous BI classifications, which can conveniently be divided into author and group indicators and journal indicators. Among the individual author-level indicators, the best known are the Crown index and the h-index, whose main limitations are their time frame (which variant indices such as the e-index, the h5, the hc and the m-index aim to correct) and the individual contribution of an author in a multiple authorship article (which the hw)-index attempts to minimise). It is also important to assess the scientific trajectory of an author objectively by analysing their collaboration indicators (both the rate and the pattern of collaboration). In most cases, however, to assess the scientific career of a professional in all contexts (promotion within the university, obtaining a doctorate, examination or professional career), the BIs that set the scale are those associated with journals. Of these, the most widely used is the IF, which, as we have seen, has many limitations and can also be manipulated by an editorial committee. Although not ethical, there are journals under the same publisher or speciality which are able to establish a certain "alliance" of citations, which serves to increase in their impact factor. The same company (Clarivate Analytics), aware of its limitations, created other metrics such as the field-normalised impact, the Eigenfactor and the article influence. Associated with Scopus we have the SJR and its variant, the SJR2, the source normalised impact per publication (SNIP) and the CiteScore. All of these BIs have advantages and limitations, so evaluating a professional's research trajectory using a single BI may not be representative, and may be either overestimated or underestimated. There is no ideal BI, so it would be beneficial if the research trajectory was judged by more than one metric index.
Authorship1. Responsible for the integrity of the study: CGV and JMGS.
2. Study conception: CGV.
3. Study design: CGV.
4. Data acquisition: not applicable.
5. Data analysis and interpretation: not applicable.
6. Statistical processing: not applicable.
7. Literature search: CGV and JMGS.
8. Drafting of the article: CGV and JMGS.
9. Critical review of the manuscript with relevant intellectual contributions: JMGS.
10. Approval of the final version: CGV and JMGS.
Conflicts of interestThe authors declare that they have no conflicts of interest.
Please cite this article as: García-Villar C, García-Santos JM, Indicadores bibliométricos para evaluar la actividad científica. Radiología. 2021;63:228–235.

