


Hippocampal volume is recognised as a surrogate imaging biomarker for the study of Alzheimer's disease (AD). However, in Cuba there are no antecedents of its use. The objective of this research was to establish an automatic hippocampal segmentation procedure to study a sample of Cuban subjects diagnosed with possible mild or moderate AD.
MethodologyA total of 104 subjects with mean ages of 73.77 ± 6.74 years participated. Imaging for the calculation of hippocampal volumes and asymmetry index (AI) was performed with a Siemens Magnetom Allegra 3T scanner using an MP-RAGE sequence. Volumes were obtained manually and automatically using Amira 5.3 and FreeSurfer 6.0 software, respectively. The results of both methods were statistically compared.
ResultsThe steps for hippocampal volumetric quantification were established for these methods. Comparison between them showed high concordance (ICC = 0.95) for both hippocampi. Therefore, there were no significant differences between them. The mean right (2961.84 ± 552.70 mm3) and left (2892.68 ± 536.6 mm3) volumes of the subjects were obtained. These volumes and the asymmetry index were significantly different with respect to a sample of healthy subjects with (p = 0.00001) and (p = 0.003) respectively; and similar to those obtained in a sample of subjects with AD in Latin America.
ConclusionsA procedure for automated volumetric quantification of the hippocampus was established. This allowed the study of a Cuban sample with possible AD. This constitutes a previous step to longitudinally evaluate the effectiveness of new Cuban drugs.
El volumen del hipocampo es reconocido como un biomarcador imagenológico subrogado para el estudio de la Enfermedad de Alzheimer (EA). Sin embargo, en Cuba no hay antecedentes de su uso. El objetivo de esta investigación fue establecer un procedimiento de segmentación automática del hipocampo para estudiar una muestra de sujetos cubanos diagnósticados con posible EA leve o moderada.
MétodosParticiparon 104 sujetos con edades promedio de 73.77 ± 6.74 años. Las imágenes utilizadas para el cálculo de los volúmenes hipocampales y el índice de asimetría (IA) se realizó con un escáner Siemens Magnetom Allegra 3T usando una secuencia MP-RAGE. La obtención de los volúmenes se hizo de forma manual y automática usando el programa Amira 5.3 y FreeSurfer 6.0 respectivamente. Se compararon estadísticamente los resultados de ambos métodos.
ResultadosSe establecieron los pasos para la cuantificación volumétrica del hipocampo para estos métodos. La comparación entre ellos mostró alta concordancia (CCI = 0.95) para ambos hipocampos. Por tanto, no existieron diferencias significativas entre ellos. Se obtuvieron los volúmenes medios derecho (2961.84 ± 552.70 mm3) e izquierdo (2892.68 ± 536.6 mm3) de los sujetos. Estos volúmenes y el índice se asimetría fueron significativamente diferentes respecto una muestra de sujetos sanos con (p = 0.00001) y (p = 0.003) respectivamente; y similares a los obtenidos en una muestra de sujetos con EA en América Latina.
ConclusionesQuedó establecido un procedimiento para la cuantificación volumétrica automatizada del hipocampo. Esto permitió el estudio de una muestra cubana con posible EA. Constituyendo un paso previo para evaluar longitudinalmente la efectividad de nuevos medicamentos cubanos.
Alzheimer disease (AD) is the most common form of dementia1; no curative treatment is currently available.2 Identification of amyloid-beta 42 deposition in post-mortem anatomical pathology studies of the brain is the only direct method available for diagnosis.3 In living patients, magnetic resonance imaging (MRI) represents a recognised and widely used imaging tool due to the high contrast between tissues and high resolution and sensitivity.4 Today, approximately 50 million people have dementia worldwide, with two-thirds of this population presenting AD. This number is expected to reach 152 million by 2050, as the global population ages.2 Cuba is a developing country with similar healthcare indicators to those of developed countries and a rapidly ageing population, with 18.3% of the total population being older than 60 years. The total worldwide cost of AD is estimated at one trillion dollars5; for Cuba, the estimated annual expenditure in direct and indirect costs amounted to 783 million dollars, according to national reports published in 2013 (distributed between informal care, direct medical costs, and social care).6 However, the greatest cost in dementia is the human cost, which reaches immeasurable dimensions. In Cuba, some BioCubafarma centres manufacture drugs to treat this condition. Therefore, it is necessary to identify and validate biomarkers7 that enable evaluation of the natural course of the disease and the effect of drugs.
In vivo biomarkers of AD are analysed using: (1) amyloid beta 1-42 protein, total tau protein, and phosphorylated tau protein determination in cerebrospinal fluid,8 (2) structural neuroimaging studies such as brain MRI and volumetric measurement of such brain structures as the hippocampus,9 and (3) functional neuroimages, such as metabolic studies with fluorodeoxyglucose-positron emission tomography and neuroimaging studies with protein labelling, such as amyloid or tau positron emission tomography.10
Two decades of clinical and methodological research have led to the emergence of structural MRI measurement of hippocampal volume as an alternative imaging biomarker for the study of AD.11,12 It has been increasingly used in clinical trials,13 with highly reproducible results.14 For example, brain volume decreases by 0.4%–0.5% annually in healthy individuals, whereas in patients with AD, volume decreases by more than 1% per year. In the case of the hippocampus, volume decreases by 1.2%–1.4% annually in healthy individuals and by 4.3% in patients with AD.15
Another variable associated with cognitive impairment and confirmed by histopathological studies is the asymmetry of some brain structures. MRI studies have shown that cortical atrophy manifests earlier and progresses more rapidly in the left hemisphere of patients with AD.16 In the case of subcortical structures, the hippocampus has been widely studied, with reports of greater asymmetry in patients with AD than in healthy individuals.16 These and other related data enable us to assess the progression of patients with mild cognitive impairment to possible AD, with current research focusing on early identification rather than on symptomatic diagnosis.17,18
Hippocampal segmentation can be performed with manual, semi-automatic, and automatic methods.19 Manual segmentation represents the gold standard.15,20 However, this method is very time-consuming, requires extensive anatomical knowledge, and its results largely depend on the technician’s experience. Therefore, in studies with large samples, researchers use automatic methods to reduce processing times. Some of the software programs available include FreeSurfer (http://surfer.nmr.mgh.harvard.edu), VolBrain (https://www.volbrain.upv.es/), ITK-SNAP (http://www.itksnap.org/pmwiki/pmwiki.php), and FSL (https://fsl.fmrib.ox.ac.uk/fsl/).
The literature includes reports from Latin America on the analysis of AD biomarkers,21 including, among others, hippocampal volume. However, there are no Cuban reports on the use of MRI biomarkers for the study of this condition. This article describes the procedure adopted in Cuba for manual and automatic segmentation of the hippocampus. We also report findings from hippocampal volume quantification of 104 Cuban individuals previously diagnosed with possible AD.
Material and methodsParticipantsThis study included 104 Cuban patients aged between 60 and 87 years (73.77 ± 6.74 years) from the Hospital General Docente Iván Portuondo in Artemisa Province and the Instituto Nacional de Neurología y Neurocirugía in Havana. Participants had previously been diagnosed with possible mild or moderate AD based on cognitive tests performed according to the criteria of the National Institute on Aging-Alzheimer's Association (NIA-AA) and the mild-to-moderate impairment criteria of the Global Deficit Score, also supported by the clinical and neuropsychological diagnosis.22 All participants signed informed consent forms and the study was approved by the research ethics committee of the participating institutions. For comparison, we used MRI scans of 272 healthy controls (mean age, 73.15 ± 7.53 years) from the free-access Cambridge Centre for Ageing Neuroscience (Cam-CAN) database (https://camcan-archive.mrc-cbu.cam.ac.uk/dataaccess/).
Equipment and pulse sequencesWe used the pulse sequences recommended by the Alzheimer's Disease Neuroimaging Initiative (ADNI),23 adapted to the Siemens Magnetom Allegra 3.0 T scanner installed at the Centro de Neurociencias de Cuba (CNEURO). Total study time per patient ranged from 38 to 40 min; patients were instructed to remain still, awake, with their eyes closed, in the supine position. We acquired 3D sagittal sequences with axial and coronal reconstruction. In this study, we used the T1-3D MP-RAGE sequence (voxel size [mm3]: 0.8 × 0.8 × 1; time [ms]: TE = 2.6; TR = 2000; TI = 900; duration [min]: 9:19) for manual and automatic segmentation of the hippocampus.
Segmentation protocolsThere are multiple manual segmentation protocols,24,25 whose differences and similarities are mainly based on the definition of anatomical limits. In an international effort to standardise existing protocols in 2014, researchers from the European Alzheimer’s Disease Consortium (EADC) and the ADNI created the EADC-ADNI Harmonised Protocol for Hippocampal Segmentation (HarP, appendix II) (www.hippocampal-protocol.net).20 We used this protocol because it enables the training of new master tracers26 and improvement of automatic algorithms27; international experience has also demonstrated high reproducibility of measurements.15 To identify the side of the hippocampus, MRI scans were displayed according to the radiological convention.
Image processingManual calculation of hippocampal volume was performed using the Amira 5.3.3 program (Visage Imaging, Berlin, Germany; http://www.visageimaging.com) running on a computer with an 8th generation Intel® Core i5 processor, Windows 10 operating system, and 16 GB RAM. We selected this program based on our working group’s previous experience with this tool.28 For the automatic segmentation of the hippocampus of healthy controls and patients with AD, we used the FreeSurfer 6.0 software, which is available free of cost for Linux and macOS (http://surfer.nmr.mgh.harvard.edu/). This software performs segmentation of brain structures, including the hippocampus, using probability maps.29 Image processing was performed with a high performance computer (HPC) system with a peak performance of 4 Tflops. The HPC system includes 5 computing nodes with 2 Intel Xeon CPUs with 24 cores each, for a total of 48 cores per node, with 48 GB of RAM and two 250-GB HDDs each. The system has a 24-TB network access storage system, which stores all the processed data.
All images were visually inspected before processing, in accordance with quality control procedures previously described in the literature.30 Digital Imaging and Communication in Medicine (DICOM) images were converted to the Neuroimaging Informatics Technology Initiative (NIfTI) format using the multiplatform MRIcroGL software (https://www.nitrc.org/plugins/mwiki/index.php/mricrogl:MainPage), and subsequently processed with FreeSurfer 6.0, using the cross-sectional pipeline recon-all command. Reports of segmentation findings in the literature have been very heterogeneous, as some authors do not normalise for head size. Therefore, this study reports both measurements. The asymmetry index (AI) was calculated based on the differences between absolute values for the left and right hippocampal volumes normalised using the following formula:
Statistical analysis
Statistical analysis was performed using the IBM SPSS Statistics software, version 26.0.
Comparison between methods:
- •
Normality of the measurement results was tested with the Kolmogorov–Smirnov test.
- •
Reproducibility of the manual measurements was studied with the intraclass correlation coefficient (ICC) with a 95% confidence interval (CI) (Model: Alpha, Two-Way Mixed; type: absolute-agreement).31
- •
General concordance between measurements taken with manual and automatic methods was assessed with the Bland–Altman plot with a 95% CI.
- •
The ICC with a 95% CI was used to assess measurement agreement of both methods.
- •
We used the 2-tailed unpaired t test (P < .05) to identify significant differences between measurements for both hippocampi.
Parametric statistics (non-normalised hippocampal volume):
- •
We used the 2-tailed unpaired t test (P < .05) to compare both hippocampi for the same sex and between all individuals.
- •
We used the one-tailed unpaired t test (P < .05) to compare the left and right hippocampi.
- •
We used analysis of variance (ANOVA, P < .05) to study significant differences in hippocampal volume per age group, as processed with the automatic method.
Non-parametric statistics (normalised hippocampal volume):
- •
To analyse the different age groups whose data were processed using the automatic method, we used the Mann–Whitney U test or Kruskal–Wallis test (P < .05).
To assess intra-observer error, the manual measurement method was applied to a single individual 10 different times, with no time limit. The reliability of the procedure was assessed using the ICC with a 95% CI.32
Results and discussionManual processingAfter analysing the usefulness of the Amira software for manual segmentation of the hippocampus, we determined which modules to use (Fig. 1). To load DICOM images corresponding to the T1-3D MP-RAGE sequence, the software uses the option “Load File” and stores the object as “MPRAGE-SAG-COR” together with the reconstruction of the coronal and axial planes (module marked as A).

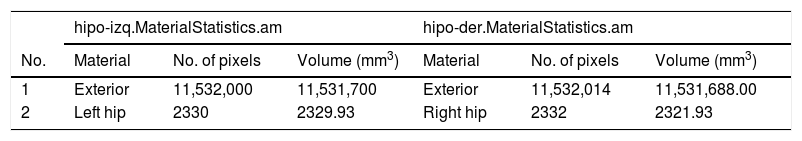
We subsequently inserted the OrthoSlice module (B) to reconstruct coronal and axial planes. Segmentation of each hippocampus was performed by creating two separate objects, one for each hippocampus (C). To do this, we used the tool “Segmentation Editor” and proceeded according to the HarP protocol. Once segmentation was completed, we generated the surfaces by adding the SurfaceGen module (D), which generates the “.surf” objects (E). These objects contain 3D information for each hippocampus, which may be displayed in the SurfaceView module (F). Lastly, after adding the MaterialStatistics module (G), we performed the volumetric calculation, resulting in generation of the “.MaterialStatistics” (H) object, which contains the report on hippocampal volume (Table 1).
Section of the table generated by the “MaterialStatistics” module of the Amira software, showing hippocampal volumes in mm3.
| hipo-izq.MaterialStatistics.am | hipo-der.MaterialStatistics.am | |||||
|---|---|---|---|---|---|---|
| No. | Material | No. of pixels | Volume (mm3) | Material | No. of pixels | Volume (mm3) |
| 1 | Exterior | 11,532,000 | 11,531,700 | Exterior | 11,532,014 | 11,531,688.00 |
| 2 | Left hip | 2330 | 2329.93 | Right hip | 2332 | 2321.93 |
Hip: hippocampus.
Using the above-mentioned modules, we obtained the reconstruction, visualisation, and quantification of the left and right hippocampal volume of each processed case (Fig. 2).

Three-dimensional reconstruction of the manual segmentation of the hippocampus, performed using the Amira software, from three study participants. The left hippocampus is shown in yellow and the right in magenta. Left Hip Vol: volume of the left hippocampus; Right Hip Vol: volume of the right hippocampus.
To assess the reliability of the manual segmentation method, the procedure was performed 10 times for a single study participant (Table 2). We obtained a coefficient of variation of 2.50% for the calculation of left hippocampal volume and of 2.65% for the right.
Volumes obtained after performing 10 manual measurements of patient cn323-18.
| Measurement | Left hip vol (mm3) | Right hip vol (mm3) |
|---|---|---|
| 1 | 2586.70 | 2397.2 |
| 2 | 2549.5 | 2464.4 |
| 3 | 2503.5 | 2427.9 |
| 4 | 2498.3 | 2546.3 |
| 5 | 2384.4 | 2512.4 |
| 6 | 2590.5 | 2374.2 |
| 7 | 2564.3 | 2456.1 |
| 8 | 2512.4 | 2509.9 |
| 9 | 2525.9 | 2572.6 |
| 10 | 2455.5 | 2527.10 |
| Mean ± SD | 2517 ± 63 | 2479 ± 66 |
| Coefficient of variation | 2.50% | 2.65% |
Left hip vol: left hippocampal volume; right hip vol: right hippocampal volume.
To be considered a master tracer in the HarP project, researchers must obtain an ICC ≥ 0.90 in the calculation of hippocampal volume.26 This coefficient was calculated for each hippocampus, with the 5 first and 5 last measurements being compared. The ICC was calculated using both types of the two-way random model: consistency and absolute agreement. As a result of the analysis, we obtained ICC values of 0.95 in the consistency test and 0.93 for absolute agreement for the left hippocampus. For the right hippocampus, we obtained an ICC of 0.90 in the consistency test and 0.90 for absolute agreement. These values are acceptable according to the HarP criteria; therefore, the procedure is reliable for clinical use.
Automatic processingProcessing with FreeSurfer was performed using the recon-all command for cross-sectional analysis: recon − all − s < output folder name >−i < subjID.nii >−all − 3T − qcache.
We used the -3T flag to correct image intensity,33 making it more appropriate for 3T MRI.34 We also used the FreeSurfer atlas based on 3T for the alignment of Talairach coordinates. The volume of each region of interest (ROI) from the FreeSurfer atlas was directly obtained from the “aseg.stats” output files. FreeSurfer segmentation outputs were visually inspected to detect serious errors. In the event of serious errors, or if FreeSurfer crashed without providing results and the issue could not be resolved after repeated attempts, analyses of these images were omitted.
It is important to highlight that in the FreeSurfer software, it is sometimes necessary to manually correct results using Freesurfer’s own viewer: Freeview. In this case, after the necessary manual corrections were made to the “aseg.presurf.mgz” file (when version 6.0 is used), the following command must be executed in the console: recon − all − autorecon2 − noaseg − autorecon3 − subjid < Subj_ID >.
This command recalculates the volumes with the new corrections and generates a new “aseg.stat” file. No manual corrections were made in this study because our objective was to compare the results of both procedures. We should underscore that the FreeSurfer development team advise against correcting minor errors. Minor errors are defined as those that only appear in one slice; therefore, correcting this single error would not significantly modify results. The program presents good reproducibility, and manipulating the images excessively may bias results.35
In our study, we only used the T1-3D MP-RAGE sequence in processing; however, it may also be used with high-resolution T2-weighted sequences. This is known as multimodal processing.36
Comparison of automatic segmentation and manual tracingFig. 3 shows the behaviour of volume values as a result of manual and automatic segmentation of 52 study participants. We observed a trend towards higher values with the automatic method, which is more evident in the right hippocampus (Fig. 3B). This finding has previously been reported in the literature.19 After visually inspecting the segmentation of patient 40, we confirmed the overestimation of volume that FreeSurfer tends to make (Fig. 4). However, comparison of the measurement results from both methods with the t test detected no significant differences for the left hippocampus (P = .667) or the right hippocampus (P = .105). Although there were no significant differences between methods, we observed incongruences in results for some patients, such as patients 35 and 40 (Fig. 3A). This confirms the need to supervise the process.


Comparison of results obtained with Amira and FreeSurfer for the segmentation of both hippocampi of a 72-year-old study participant. The red circles indicate areas outside the hippocampus that were incorrectly included by FreeSurfer. This is one of the reasons for the overestimation of volumes.19
The Bland–Altman plot showed good concordance of the results for both hippocampi, as the differences identified were close to the mean, within the CI (95%), and did not show a relational trend (Fig. 5). ICC calculation for the left and right hippocampi displayed excellent reliability, with a value of 0.95 for both hippocampi. The lower confidence limit of the ICC of the right hippocampus was 0.659 (considered moderate according to Shrout et al.31), which contrasts with the excellent agreement reported in the left hippocampus. This may be due to the fact that the right hippocampus consistently presents more differences between the results of automatic segmentation than of manual segmentation. However, values were similar in most cases. Therefore, the automatic method is appropriate for processing large numbers of individuals, and must be supervised. This requires quality control prior to image processing,30 and quality control of segmentation.
 was 41.44 mm3 (SD = 213.6) for the left hippocampus and 154 mm3 (SD = 1579) for the right hippocampus. Limits of agreement are expressed as mean ± 1.96 SD and shown as red dotted lines. SD: standard deviation.")
Bland–Altman plot analysing agreement between the manual and the automatic methods for calculating the volumes of the left and right hippocampi. The difference (central bold line) was 41.44 mm3 (SD = 213.6) for the left hippocampus and 154 mm3 (SD = 1579) for the right hippocampus. Limits of agreement are expressed as mean ± 1.96 SD and shown as red dotted lines. SD: standard deviation.
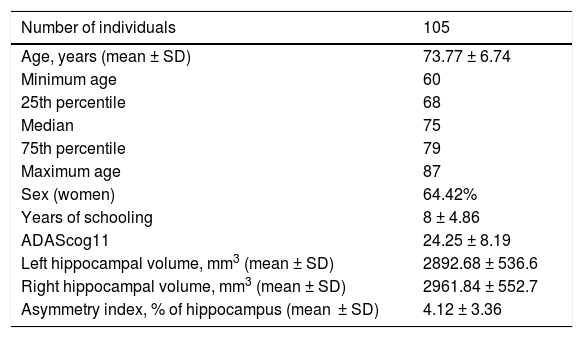
After analysing the reliability of automatic processing, we completed hippocampal volume quantification for all 104 participants (Table 3). We found no significant differences (P = .08) when comparing the volumes of both hippocampi. This contradicts previous reports in the literature, which describe greater right hippocampal volumes.37 Similarly, comparison of both hippocampi did not reveal significant differences for either sex (P = .20 for women and P = .50 for men) or between sexes (P = .34 for the left hippocampus and P = .40 for the right).
Demographic variables and biomarkers.
| Number of individuals | 105 |
|---|---|
| Age, years (mean ± SD) | 73.77 ± 6.74 |
| Minimum age | 60 |
| 25th percentile | 68 |
| Median | 75 |
| 75th percentile | 79 |
| Maximum age | 87 |
| Sex (women) | 64.42% |
| Years of schooling | 8 ± 4.86 |
| ADAScog11 | 24.25 ± 8.19 |
| Left hippocampal volume, mm3 (mean ± SD) | 2892.68 ± 536.6 |
| Right hippocampal volume, mm3 (mean ± SD) | 2961.84 ± 552.7 |
| Asymmetry index, % of hippocampus (mean ± SD) | 4.12 ± 3.36 |
SD: standard deviation.
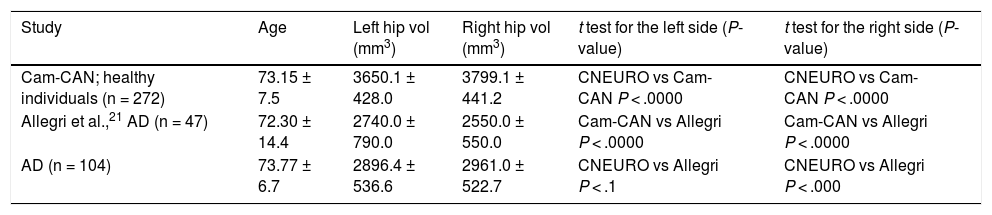
The mean values obtained are similar to those described in previous reports from Latin America.20 These, in turn, show significant differences with regard to those observed in healthy controls from Europe (Table 4).
Comparison of mean left and right hippocampal volume values obtained in three different studies processed with FreeSurfer.
| Study | Age | Left hip vol (mm3) | Right hip vol (mm3) | t test for the left side (P-value) | t test for the right side (P-value) |
|---|---|---|---|---|---|
| Cam-CAN; healthy individuals (n = 272) | 73.15 ± 7.5 | 3650.1 ± 428.0 | 3799.1 ± 441.2 | CNEURO vs Cam-CAN P < .0000 | CNEURO vs Cam-CAN P < .0000 |
| Allegri et al.,21 AD (n = 47) | 72.30 ± 14.4 | 2740.0 ± 790.0 | 2550.0 ± 550.0 | Cam-CAN vs Allegri P < .0000 | Cam-CAN vs Allegri P < .0000 |
| AD (n = 104) | 73.77 ± 6.7 | 2896.4 ± 536.6 | 2961.0 ± 522.7 | CNEURO vs Allegri P < .1 | CNEURO vs Allegri P < .000 |
AD: Alzheimer disease; left hip vol: left hippocampal volume; right hip vol: right hippocampal volume.
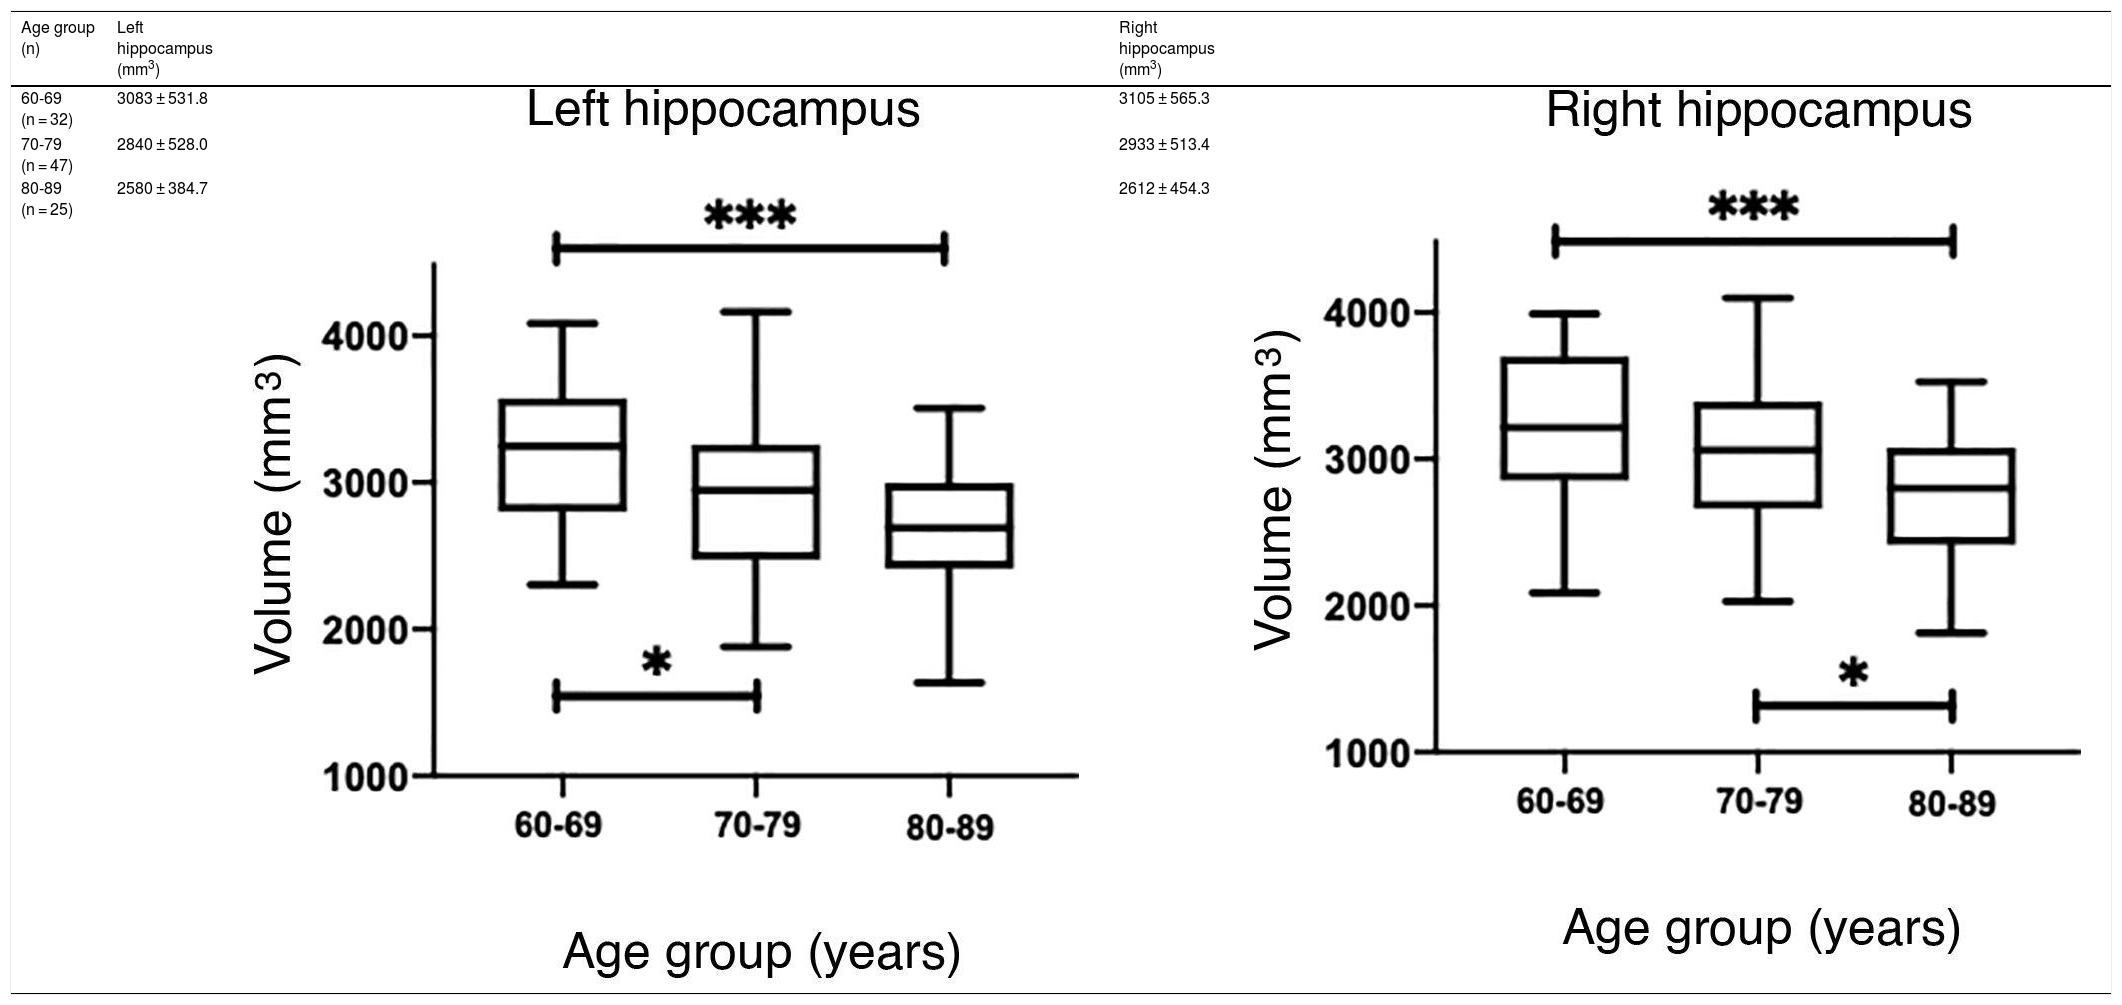
The values obtained with automatic processing showed a trend to decreased hippocampal volume as individuals aged (Table 5). ANOVA showed significant differences between the first and the last age groups for both hippocampi (P = .0018), as shown in Table 5.


However, hippocampal volume is influenced by head size; therefore, measurement should be normalised with the estimated total intracranial volume (eTIV) for each individual.38,39 When comparing the normalised measurements of our study participants with those in the Cam-CAN database, we observed that our measurements were below the mean (Fig. 6A and C). Significant differences were found for both hippocampi (P = .0033 for the left and P = .0003 for the right).
 Scatter plots of the eTIV-normalised volumes of both hippocampi adjusted to age of the individuals from CNEURO (patients), compared to individuals from Cam-CAN (healthy controls). (B and D) Box-and-whisker plots of the analysis of significant differences between age groups in the CNEURO study; the Kruskal–Wallis test was used to analyse eTIV-normalised hippocampal volumes.")
(A and C) Scatter plots of the eTIV-normalised volumes of both hippocampi adjusted to age of the individuals from CNEURO (patients), compared to individuals from Cam-CAN (healthy controls). (B and D) Box-and-whisker plots of the analysis of significant differences between age groups in the CNEURO study; the Kruskal–Wallis test was used to analyse eTIV-normalised hippocampal volumes.
The Mann–Whitney U test identified no significant differences between left and right hippocampal volumes in patients with AD. The Kruskal–Wallis test only revealed significant differences between the first and last age groups for both hippocampi, showing two levels of statistical significance (Figs. 6B and D) (P = .0018 for the left, and P = .0015 for the right).
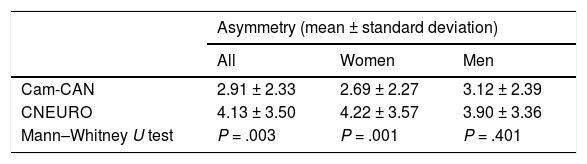
Analysis of hippocampal asymmetry values in our patient sample did not reveal significant differences between sexes (P = .117). Of the 104 patients, 54 showed right lateral asymmetry. While this was not significant, it contradicts previous reports that describe greater atrophy in the left hemisphere.16 However, the mean asymmetry values from Cam-CAN and CNEURO show statistically significant differences between both databases for all subjects and for women, as shown in Table 6. One limitation of our study is not including a control group of healthy individuals from Cuba. However, this study represents another step towards the creation of normative brain databases of the Cuban population.40
ConclusionsWe created and verified a procedure for the manual and automatic volumetric measurement of the hippocampus. Our study demonstrates the usefulness and reliability of the automatic procedure, and presents the findings from a sample of 104 Cuban patients diagnosed with possible AD. Extrapolation of our results to longitudinal studies would contribute to the assessment of the effectiveness of Cuban drugs under clinical trials.
FundingThis study was funded by the Financial Fund for Science and Innovation of the Ministry of Science, Technology, and the Environment of the Republic of Cuba.
Declaration of Competing InterestThe authors have no conflicts of interest to declare.
Appendix ASupplementary dataSupplementary material
Supplementary data to this article can be found online at https://doi.org/10.1016/j.neurop.2021.05.005.
We would like to thank the Ministry of Science, Technology, and the Environment of the Republic of Cuba for the Financial Fund for Science and Innovation, which enabled the creation of the project “Estandarización de protocolos para estudios relacionados con el envejecimiento con IRM de alto campo,” to which our study belongs.
