


Primary headaches affect significant proportion of general population worldwide. Our aim was to describe primary headaches epidemiology among middle-aged adults in a large Brazilian cohort,
MethodsA cross-sectional analysis was performed between primary headaches and sociodemographic using baseline data from the Brazilian Longitudinal Study of Adult Health (ELSA-Brasil).
ResultsFrom 15,093 participants (mean age 52 y-old), 6082 (40.3%) had TTH (33% definite and 7.3% probable), 4411 (29.2%) had migraine (8.4% definite and 20.8% probable migraine), 140 (0.9%) had other headaches and 4460 (29.6%) reported no headache in the last 12 months. The highest odds ratios (OR) were for the associations between definite migraine with the respective variables: Age≤65 y-old (OR, 3.21; 95%confidence interval (95%CI), 2.20–4.69), female gender (OR, 12.87; (95%CI), 10.72–15.45) and active working status (OR, 3.01; (95%CI), 2.46–3.69). For migraine and TTH having a higher level of education (high school and/or college compared to elementary) was associated with increased OR, mostly definite TTH (OR for high school, 1.47; 95%CI, 1.26–1.71) and OR for college, 1.21; 95%CI: 1.06–1.39) and definite migraine (OR for college, 1.31; 95%CI, 1.04–1.66). While definite TTH was positively associated with higher income (OR for US$1245–3320: 1.14; 95%CI, 1.02–1.27 and OR for more than US$ 3320: 1.16; 95%CI, 1.00–1.34), definite migraine was inversely associated with income (OR for more than US$ 3320: 0.73; 95%CI, 0.58–0.91).
ConclusionsOur results suggest that primary headaches, particularly TTH, were more associated with high educational attainment. On the other hand, a high household income was inversely associated with migraine headaches.
Las cefaleas primarias afectan a un alto porcentaje de la población general a nivel mundial. El objetivo de nuestro estudio es describir la epidemiología de las cefaleas primarias en adultos de mediana edad de una gran cohorte brasileña.
MétodosRealizamos un análisis transversal de las características sociodemográficas de pacientes con cefaleas primarias, a partir de los datos del Estudio Longitudinal de Salud del Adulto (ELSA-Brasil).
ResultadosDe un total de 15.093 participantes (edad media, 52 años), 6.082 (40,3%) tenían cefalea tensional (33% definitiva y 7,3% probable), 4.411 (29,2%) presentaban migraña (8,4% definitiva y 20,8% probable), 140 (0,9%) tenían otras cefaleas primarias y 4.460 (29,6%) no habían presentado cefalea en los últimos 12 meses. Las odds ratios (OR) más altas corresponden a las asociaciones entre diagnóstico definitivo de migraña y las siguientes variables: edad ≤ 65 años (OR, 3,21; IC 95%, 2,20-4,69), sexo femenino (OR, 12,87; IC 95%, 10,72-15,45) y situación laboral activa (OR, 3,01; IC 95%, 2,46-3,69). Un mayor nivel educativo (estudios secundarios o superiores vs. estudios primarios) se asoció con OR más altas, principalmente en pacientes con diagnóstico definitivo de cefalea tensional (OR para estudios secundarios, 1,47; IC 95%, 1,26-1,71; OR para estudios superiores, 1,21; IC 95%, 1,06-1,39) y diagnóstico definitivo de migraña (OR para estudios superiores, 1,31; IC 95%, 1,04-1,66). Encontramos una asociación positiva entre mayor nivel de ingresos y el diagnóstico definitivo de cefalea tensional (OR para el rango 1.245-3.320 US$, 1,14; IC 95%, 1,02-1,27; OR para > 3.320 US$, 1,16; IC 95%, 1,00-1,34), y una asociación negativa entre el nivel de ingresos y el diagnóstico definitivo de migraña (OR para > 3.320 US$, 0,73; IC 95%, 0,58-0,91).
ConclusionesLas cefaleas primarias, y en especial la cefalea tensional, son más frecuentes en personas con mayor nivel educativo. Sin embargo, encontramos una correlación inversa entre el nivel de ingresos y la frecuencia de migraña.
Primary headache disorders are common and debilitating neurological conditions, affecting a significant proportion of the general population worldwide.1 In Brazil, the estimated 1-year sex and age-adjusted prevalence of migraine was 15.2% for definite and 26.3% for probable migraine. Migraine was more common in women, people with >11 years of education attainment, and with lower income compared to non-migraineurs.2 These findings were also confirmed by other Brazilian studies.3–5
Some data of Latin American countries highlight Brazil with a higher prevalence of migraine in women/men of 17.4/7.8% respectively, followed by Colombia, Ecuador, Venezuela, Mexico and Argentina.6 Even some population-based data from Brazil reported a high one-year prevalence rates of headaches and migraine headaches, among the elderly.7
Regarding other primary headaches, the estimated 1-year sex- and-age-adjusted prevalence of TTH was 13.0%, being 15.4% in males and 9.5% in females. The prevalence of probable TTH was 22.6%, being higher in men, younger ages and more than 11 years of education. No association was found between TTH and household income.8
Although many papers have been published about migraine in the Brazilian Longitudinal Study of Adult Health,9–13 no prevalence data of primary headaches such as migraine, probable migraine, TTH, and probable TTH and the association with sociodemographic variables were published. The aim of the present study was to describe the epidemiology of primary headaches according to sociodemographic characteristics using baseline data of the Brazilian Longitudinal Study of Adult Health (ELSA-Brasil study).
Material and methodsStudy design and populationELSA-Brasil is an ongoing prospective cohort of 15,105 civil servants aged 35–74 years in six state capital cities in Brazil. Baseline assessments occurred between 2008 and 2010. Further details of this cohort are described elsewhere14–17 In brief; all active or retired civil servants of six academic institutions were eligible for the study. Exclusion criteria were current or recent pregnancy, intention to quit working at the institution, severe communication impairment, and residence outside of a study center's metropolitan area. Participants were selected according to the occupation classified as unskilled, technical/clerical and faculty and professional staff permitting a gradient of socioeconomic position across the sample. Here, we cross-sectionally analyzed data from 15,093 ELSA-Brasil participants (participation-rate: 99.9%) who filled the screening question about headache in the last year (answers: 10,633 “yes” and 4460 “no”). At the end, we had 12 missing data that were related to those who declined to answer the preliminary question about headache.
Approvals from all Institutional Review Boards from the six research centers were obtained, and written consent was obtained from all participants of the study.
Headache definitionAll participants (N=10,633) who answered to the question “yes” to the question “In the last 12 months, did you have a headache?” at the ELSA-Brasil baseline evaluation were invited to answer a detailed headache questionnaire based on the International Classification of Headache Disorders- ICHD 2nd Edition.18 that was validated and previously used in Brazil.19 Briefly, it investigates pain frequency, duration, quality, location, intensity, triggering factors and accompanying symptoms, such as nausea or vomiting. We classified individuals who answered “yes” to the question about headache and fulfilled all criteria for migraine as definite migraine. We classified individuals who answered “yes” to the question about headache and fulfilled all criteria for migraine but one as probable migraine. We classified individuals who answered “yes” to the question about headache and fulfilled all criteria as definite TTH. Individuals who answered “yes” to the question about headache and fulfilled all criteria but one for TTH were considered as having probable TTH. Other headaches were defined as headaches that did not fulfill criteria for primary headaches. There is also a group of participants who reported no headaches in the last 12 months.
Sociodemographic and clinical variablesEach participant underwent an interview at workplace and a visit to the Research Center for clinical exams according to standard protocols.17 Interview and examination were performed by trained personal with strict quality control. Questionnaires addressed baseline data regarding to sociodemographic, clinical and laboratorial characteristics as follows: Age (mean, 95% confidence interval-95%CI), sex, years of education (elementary, high school and college,), self-reported race (White, Mixed, Black, Others: Asian and Indigenous), working status (active or retired), average monthly family net income was classified as less than US$ 1245, US$ 1245 to US$ 3320 or more than US$ 3320. At baseline of the study US$=R$ (Reais)=2.0; smoking status (never, former and current), physical activity at leisure time (Inactive, insufficiently active and active) using the International Physical Activity Questionnaire (IPAQ-Long Form). Alcohol intake was evaluated by a specific questionnaire that captures alcoholic type, and frequency and pattern of alcohol intake in the last 12 months.14 We considered a high hazardous alcohol consumption per week as ≥140g for women and ≥210g for men.
Body weight was measured to the nearest 0.1kg with the participant wearing light clothes using a digital scale (Toledo® Columbus, Ohio, US). Height was measured to the nearest 0.1cm using a wall-mounted stadiometer that raises from floor length with a footplate for increased stability (Seca®, Hamburg, Germany). Anthropometry was performed in all six ELSA-Brasil centers using the same equipment during baseline assessment. Training of the research time composed by nurses was executed in a centralized way to ensure uniformity across centers under strict quality control.14,15
Body mass index (BMI) was calculated as weight (in kilograms) divided by the square of height (in meters) and organized in strata, based on the World Health Organization criteria. For obesity, we considered BMI 30.0kg/m2 or above.
StatisticsCategorical and continuous variables were evaluated by Chi-Square test and continuous variables were analyzed by ANOVA with Bonferroni correction according to headache status (all, definite and probable TTH and migraine, other headaches or without headache). Categorical variables were presented as absolute (relative) frequency and continuous variables are presented as mean with respective 95% confidence interval (CI). The odds ratios (OR) with respective 95% CI were computed in a multivariate logistic regression model using all sociodemographic variables (age, gender, self-reported race, working status, educational level, and monthly income) as explanatory variables and the headaches subtypes as the dependent variables. No headache subgroup was considered as reference.
For all analyses, p-values <0.05 were also considered significant. The statistical analyses were performed with the statistical software SPSS version 27.0.
ResultsThe distribution of primary headaches at baseline of ELSA-Brasil are demonstrated in Fig. 1. Of all headaches, the most frequent were definite TTH and probable migraine. Among 15,093 participants (mean age 52 y-old, 54.4% of women), 6082 (40.3%, n=6082/15,093) reported TTH (33% definite TTH and 7.3% probable TTH); 4411 (29.2%, n=4411/15,093) related migraine headaches (8.4% definite migraine and 20.8% with probable migraine); 140 (0.92%, n=140/15,093) were classified as having other headaches and 4460 (29.5%, n=4460/15,093) reported no headaches in the last 12 months.

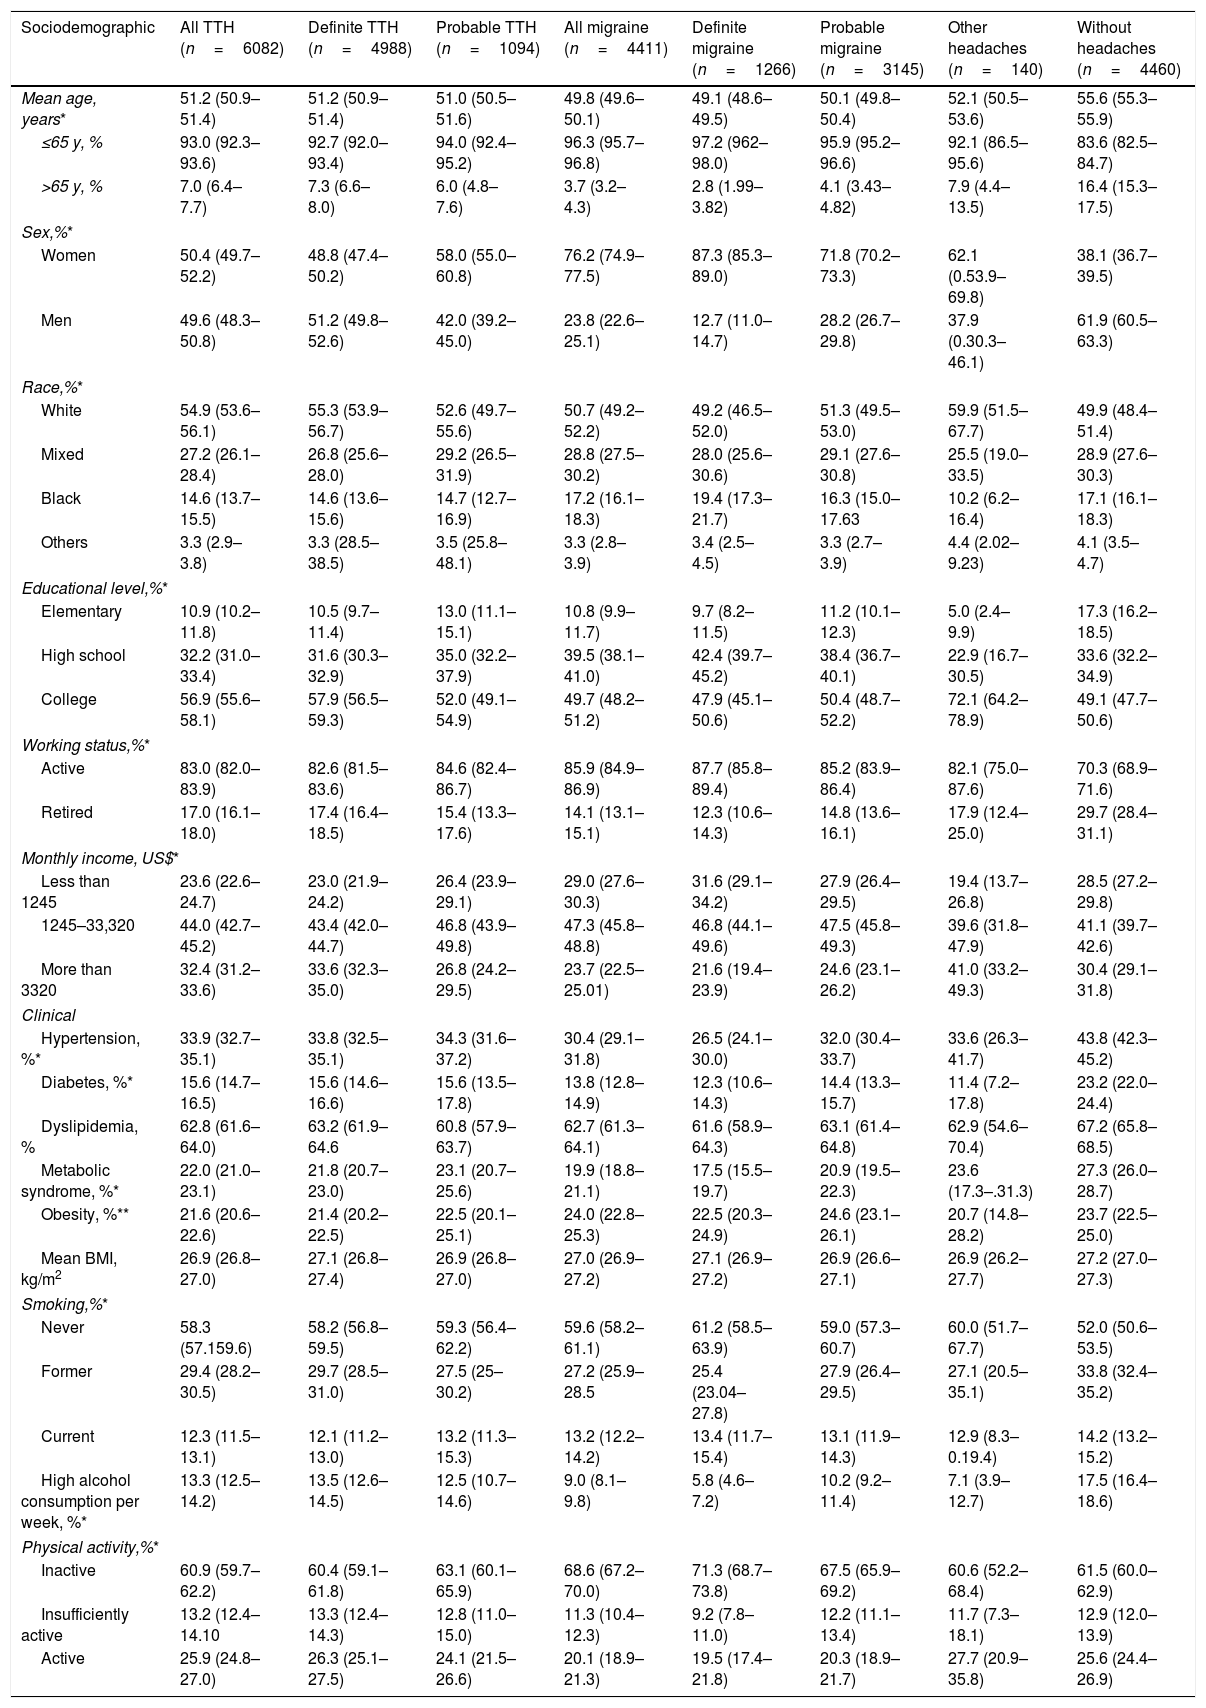
Baseline and clinical characteristics according to headache status are described in Table 1. Overall, participants 65 y-old or younger, and women presented the highest frequencies of headaches. Except for the definite TTH that was most frequent in men, active workers who self-declared as White, with College degree, and intermediary income levels. Participants reporting migraine headaches are mostly women, active workers who self-reported as White, with college degree and intermediary income levels. No relevant sociodemographic differences were detected between definite and probable migraine (Table 1).
Sociodemographic and clinical characteristics of ELSA-Brasil participants according to headache status at baseline, 2008–2010.
| Sociodemographic | All TTH (n=6082) | Definite TTH (n=4988) | Probable TTH (n=1094) | All migraine (n=4411) | Definite migraine (n=1266) | Probable migraine (n=3145) | Other headaches (n=140) | Without headaches (n=4460) |
|---|---|---|---|---|---|---|---|---|
| Mean age, years* | 51.2 (50.9–51.4) | 51.2 (50.9–51.4) | 51.0 (50.5–51.6) | 49.8 (49.6–50.1) | 49.1 (48.6–49.5) | 50.1 (49.8–50.4) | 52.1 (50.5–53.6) | 55.6 (55.3–55.9) |
| ≤65 y, % | 93.0 (92.3–93.6) | 92.7 (92.0–93.4) | 94.0 (92.4–95.2) | 96.3 (95.7–96.8) | 97.2 (962–98.0) | 95.9 (95.2–96.6) | 92.1 (86.5–95.6) | 83.6 (82.5–84.7) |
| >65 y, % | 7.0 (6.4–7.7) | 7.3 (6.6–8.0) | 6.0 (4.8–7.6) | 3.7 (3.2–4.3) | 2.8 (1.99–3.82) | 4.1 (3.43–4.82) | 7.9 (4.4–13.5) | 16.4 (15.3–17.5) |
| Sex,%* | ||||||||
| Women | 50.4 (49.7–52.2) | 48.8 (47.4–50.2) | 58.0 (55.0–60.8) | 76.2 (74.9–77.5) | 87.3 (85.3–89.0) | 71.8 (70.2–73.3) | 62.1 (0.53.9–69.8) | 38.1 (36.7–39.5) |
| Men | 49.6 (48.3–50.8) | 51.2 (49.8–52.6) | 42.0 (39.2–45.0) | 23.8 (22.6–25.1) | 12.7 (11.0–14.7) | 28.2 (26.7–29.8) | 37.9 (0.30.3–46.1) | 61.9 (60.5–63.3) |
| Race,%* | ||||||||
| White | 54.9 (53.6–56.1) | 55.3 (53.9–56.7) | 52.6 (49.7–55.6) | 50.7 (49.2–52.2) | 49.2 (46.5–52.0) | 51.3 (49.5–53.0) | 59.9 (51.5–67.7) | 49.9 (48.4–51.4) |
| Mixed | 27.2 (26.1–28.4) | 26.8 (25.6–28.0) | 29.2 (26.5–31.9) | 28.8 (27.5–30.2) | 28.0 (25.6–30.6) | 29.1 (27.6–30.8) | 25.5 (19.0–33.5) | 28.9 (27.6–30.3) |
| Black | 14.6 (13.7–15.5) | 14.6 (13.6–15.6) | 14.7 (12.7–16.9) | 17.2 (16.1–18.3) | 19.4 (17.3–21.7) | 16.3 (15.0–17.63 | 10.2 (6.2–16.4) | 17.1 (16.1–18.3) |
| Others | 3.3 (2.9–3.8) | 3.3 (28.5–38.5) | 3.5 (25.8–48.1) | 3.3 (2.8–3.9) | 3.4 (2.5–4.5) | 3.3 (2.7–3.9) | 4.4 (2.02–9.23) | 4.1 (3.5–4.7) |
| Educational level,%* | ||||||||
| Elementary | 10.9 (10.2–11.8) | 10.5 (9.7–11.4) | 13.0 (11.1–15.1) | 10.8 (9.9–11.7) | 9.7 (8.2–11.5) | 11.2 (10.1–12.3) | 5.0 (2.4–9.9) | 17.3 (16.2–18.5) |
| High school | 32.2 (31.0–33.4) | 31.6 (30.3–32.9) | 35.0 (32.2–37.9) | 39.5 (38.1–41.0) | 42.4 (39.7–45.2) | 38.4 (36.7–40.1) | 22.9 (16.7–30.5) | 33.6 (32.2–34.9) |
| College | 56.9 (55.6–58.1) | 57.9 (56.5–59.3) | 52.0 (49.1–54.9) | 49.7 (48.2–51.2) | 47.9 (45.1–50.6) | 50.4 (48.7–52.2) | 72.1 (64.2–78.9) | 49.1 (47.7–50.6) |
| Working status,%* | ||||||||
| Active | 83.0 (82.0–83.9) | 82.6 (81.5–83.6) | 84.6 (82.4–86.7) | 85.9 (84.9–86.9) | 87.7 (85.8–89.4) | 85.2 (83.9–86.4) | 82.1 (75.0–87.6) | 70.3 (68.9–71.6) |
| Retired | 17.0 (16.1–18.0) | 17.4 (16.4–18.5) | 15.4 (13.3–17.6) | 14.1 (13.1–15.1) | 12.3 (10.6–14.3) | 14.8 (13.6–16.1) | 17.9 (12.4–25.0) | 29.7 (28.4–31.1) |
| Monthly income, US$* | ||||||||
| Less than 1245 | 23.6 (22.6–24.7) | 23.0 (21.9–24.2) | 26.4 (23.9–29.1) | 29.0 (27.6–30.3) | 31.6 (29.1–34.2) | 27.9 (26.4–29.5) | 19.4 (13.7–26.8) | 28.5 (27.2–29.8) |
| 1245–33,320 | 44.0 (42.7–45.2) | 43.4 (42.0–44.7) | 46.8 (43.9–49.8) | 47.3 (45.8–48.8) | 46.8 (44.1–49.6) | 47.5 (45.8–49.3) | 39.6 (31.8–47.9) | 41.1 (39.7–42.6) |
| More than 3320 | 32.4 (31.2–33.6) | 33.6 (32.3–35.0) | 26.8 (24.2–29.5) | 23.7 (22.5–25.01) | 21.6 (19.4–23.9) | 24.6 (23.1–26.2) | 41.0 (33.2–49.3) | 30.4 (29.1–31.8) |
| Clinical | ||||||||
| Hypertension, %* | 33.9 (32.7–35.1) | 33.8 (32.5–35.1) | 34.3 (31.6–37.2) | 30.4 (29.1–31.8) | 26.5 (24.1–30.0) | 32.0 (30.4–33.7) | 33.6 (26.3–41.7) | 43.8 (42.3–45.2) |
| Diabetes, %* | 15.6 (14.7–16.5) | 15.6 (14.6–16.6) | 15.6 (13.5–17.8) | 13.8 (12.8–14.9) | 12.3 (10.6–14.3) | 14.4 (13.3–15.7) | 11.4 (7.2–17.8) | 23.2 (22.0–24.4) |
| Dyslipidemia, % | 62.8 (61.6–64.0) | 63.2 (61.9–64.6 | 60.8 (57.9–63.7) | 62.7 (61.3–64.1) | 61.6 (58.9–64.3) | 63.1 (61.4–64.8) | 62.9 (54.6–70.4) | 67.2 (65.8–68.5) |
| Metabolic syndrome, %* | 22.0 (21.0–23.1) | 21.8 (20.7–23.0) | 23.1 (20.7–25.6) | 19.9 (18.8–21.1) | 17.5 (15.5–19.7) | 20.9 (19.5–22.3) | 23.6 (17.3–.31.3) | 27.3 (26.0–28.7) |
| Obesity, %** | 21.6 (20.6–22.6) | 21.4 (20.2–22.5) | 22.5 (20.1–25.1) | 24.0 (22.8–25.3) | 22.5 (20.3–24.9) | 24.6 (23.1–26.1) | 20.7 (14.8–28.2) | 23.7 (22.5–25.0) |
| Mean BMI, kg/m2 | 26.9 (26.8–27.0) | 27.1 (26.8–27.4) | 26.9 (26.8–27.0) | 27.0 (26.9–27.2) | 27.1 (26.9–27.2) | 26.9 (26.6–27.1) | 26.9 (26.2–27.7) | 27.2 (27.0–27.3) |
| Smoking,%* | ||||||||
| Never | 58.3 (57.159.6) | 58.2 (56.8–59.5) | 59.3 (56.4–62.2) | 59.6 (58.2–61.1) | 61.2 (58.5–63.9) | 59.0 (57.3–60.7) | 60.0 (51.7–67.7) | 52.0 (50.6–53.5) |
| Former | 29.4 (28.2–30.5) | 29.7 (28.5–31.0) | 27.5 (25–30.2) | 27.2 (25.9–28.5 | 25.4 (23.04–27.8) | 27.9 (26.4–29.5) | 27.1 (20.5–35.1) | 33.8 (32.4–35.2) |
| Current | 12.3 (11.5–13.1) | 12.1 (11.2–13.0) | 13.2 (11.3–15.3) | 13.2 (12.2–14.2) | 13.4 (11.7–15.4) | 13.1 (11.9–14.3) | 12.9 (8.3–0.19.4) | 14.2 (13.2–15.2) |
| High alcohol consumption per week, %* | 13.3 (12.5–14.2) | 13.5 (12.6–14.5) | 12.5 (10.7–14.6) | 9.0 (8.1–9.8) | 5.8 (4.6–7.2) | 10.2 (9.2–11.4) | 7.1 (3.9–12.7) | 17.5 (16.4–18.6) |
| Physical activity,%* | ||||||||
| Inactive | 60.9 (59.7–62.2) | 60.4 (59.1–61.8) | 63.1 (60.1–65.9) | 68.6 (67.2–70.0) | 71.3 (68.7–73.8) | 67.5 (65.9–69.2) | 60.6 (52.2–68.4) | 61.5 (60.0–62.9) |
| Insufficiently active | 13.2 (12.4–14.10 | 13.3 (12.4–14.3) | 12.8 (11.0–15.0) | 11.3 (10.4–12.3) | 9.2 (7.8–11.0) | 12.2 (11.1–13.4) | 11.7 (7.3–18.1) | 12.9 (12.0–13.9) |
| Active | 25.9 (24.8–27.0) | 26.3 (25.1–27.5) | 24.1 (21.5–26.6) | 20.1 (18.9–21.3) | 19.5 (17.4–21.8) | 20.3 (18.9–21.7) | 27.7 (20.9–35.8) | 25.6 (24.4–26.9) |
Continuous variables are demonstrated in mean and categorical variables in proportion with respective 95% confidence interval (95%CI).
TTH: tension type headache.
Migraine includes migraine with and without aura.
p-Values were from Chi-Square test for categorical variables and from ANOVA test for continuous variables.
p<0.01 for the comparisons with without headaches.
After Bonferroni correction all mean age values were statistically different between subgroups of headache, except probable compared to definite TTH and all TTH compared to other headaches.
Race: others were Asian and Indigenous.
Hypertension was defined by systolic blood pressure≥140mmHg, diastolic blood pressure≥90mmHg, or current treatment. Dyslipidemia was defined as LDL-Cholesterol≥130mg/dl.
Metabolic syndrome was defined by the presence of ≥three criteria: waist measurement>88cm for women or >102cm for men, HDL-cholesterol<50mg/dl for women or <40mg/dl for men, a systolic blood pressure≥130m Hg or ≥ 85mm Hg, serum triglyceride levels≥150mg/dl, and fasting plasma glucose≥110mg/dl) diagnoses were defined according to NCEP ATP III criteria.High hazardous alcohol consumption per week: ≥140g for women and ≥210g for men.
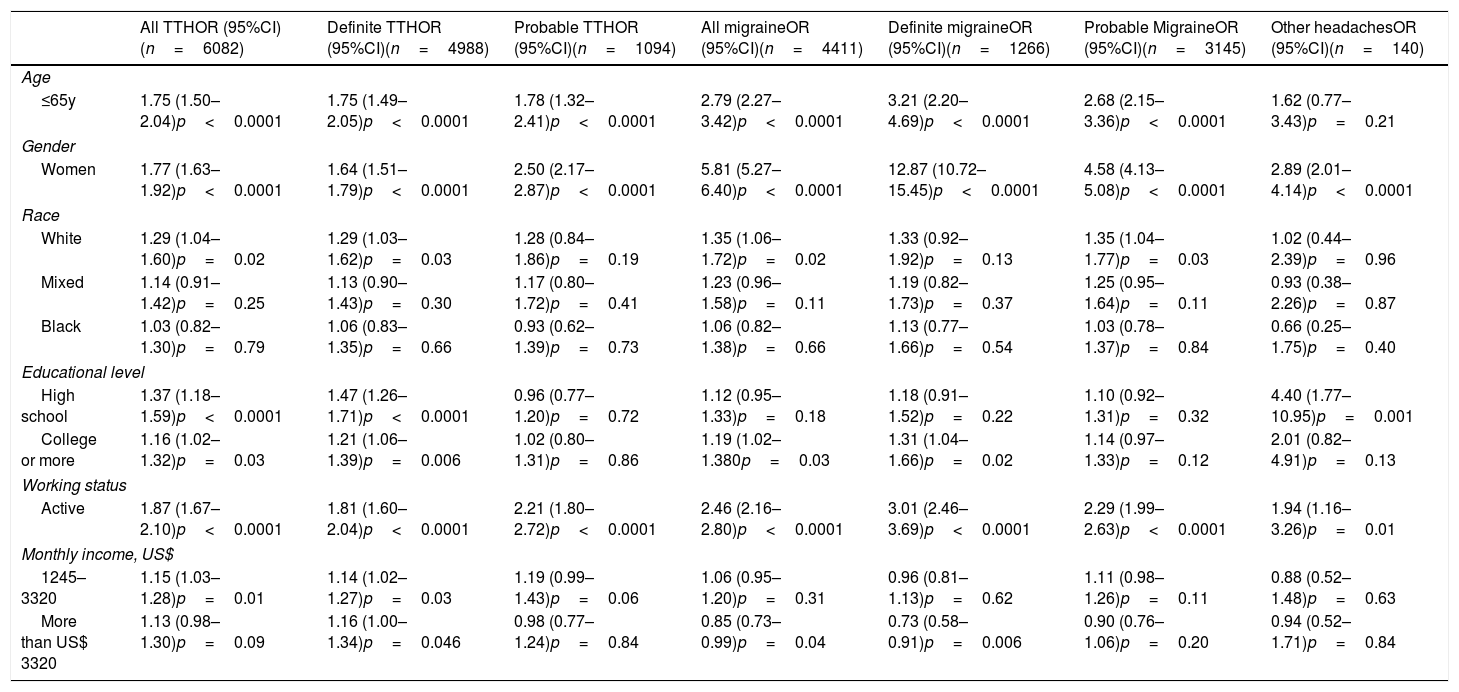
Table 2 presents the logistic regression models according to sociodemographic characteristics. The highest odds ratios (OR) were observed for the associations between definite migraine with the respective sociodemographic variables: Age≤65 y-old (OR, 3.21; 95% Confidence interval (95%CI), 2.20–4.69), female gender (OR, 12.87; (95%CI), 10.72–15.45) and active working status (OR, 3.01; (95%CI), 2.46–3.69). For all migraine and TTH having a higher level of education (high school and/or college compared to elementary) was associated with increased OR, mostly definite TTH (OR for high school, 1.47; 95%CI, 1.26–1.71) and OR for college, 1.21; 95%CI, 1.06–1.39) and definite migraine (OR for college, 1.31; 95%CI, 1.04–1.66). While definite TTH was positively associated with higher income (OR for US$1245–3320: 1.14; 95%CI, 1.02–1.27 and OR for more than US$ 3320: 1.16; 95%CI, 1.00–1.34), definite migraine was inversely associated with income (OR for more than US$ 3320: 0.73; 95%CI, 0.58–0.91).
Odds ratios for the associations between sociodemographic factors and headache status at baseline of ELSA-Brasil, 2008–2010.
| All TTHOR (95%CI)(n=6082) | Definite TTHOR (95%CI)(n=4988) | Probable TTHOR (95%CI)(n=1094) | All migraineOR (95%CI)(n=4411) | Definite migraineOR (95%CI)(n=1266) | Probable MigraineOR (95%CI)(n=3145) | Other headachesOR (95%CI)(n=140) | |
|---|---|---|---|---|---|---|---|
| Age | |||||||
| ≤65y | 1.75 (1.50–2.04)p<0.0001 | 1.75 (1.49–2.05)p<0.0001 | 1.78 (1.32–2.41)p<0.0001 | 2.79 (2.27–3.42)p<0.0001 | 3.21 (2.20–4.69)p<0.0001 | 2.68 (2.15–3.36)p<0.0001 | 1.62 (0.77–3.43)p=0.21 |
| Gender | |||||||
| Women | 1.77 (1.63–1.92)p<0.0001 | 1.64 (1.51–1.79)p<0.0001 | 2.50 (2.17–2.87)p<0.0001 | 5.81 (5.27–6.40)p<0.0001 | 12.87 (10.72–15.45)p<0.0001 | 4.58 (4.13–5.08)p<0.0001 | 2.89 (2.01–4.14)p<0.0001 |
| Race | |||||||
| White | 1.29 (1.04–1.60)p=0.02 | 1.29 (1.03–1.62)p=0.03 | 1.28 (0.84–1.86)p=0.19 | 1.35 (1.06–1.72)p=0.02 | 1.33 (0.92–1.92)p=0.13 | 1.35 (1.04–1.77)p=0.03 | 1.02 (0.44–2.39)p=0.96 |
| Mixed | 1.14 (0.91–1.42)p=0.25 | 1.13 (0.90–1.43)p=0.30 | 1.17 (0.80–1.72)p=0.41 | 1.23 (0.96–1.58)p=0.11 | 1.19 (0.82–1.73)p=0.37 | 1.25 (0.95–1.64)p=0.11 | 0.93 (0.38–2.26)p=0.87 |
| Black | 1.03 (0.82–1.30)p=0.79 | 1.06 (0.83–1.35)p=0.66 | 0.93 (0.62–1.39)p=0.73 | 1.06 (0.82–1.38)p=0.66 | 1.13 (0.77–1.66)p=0.54 | 1.03 (0.78–1.37)p=0.84 | 0.66 (0.25–1.75)p=0.40 |
| Educational level | |||||||
| High school | 1.37 (1.18–1.59)p<0.0001 | 1.47 (1.26–1.71)p<0.0001 | 0.96 (0.77–1.20)p=0.72 | 1.12 (0.95–1.33)p=0.18 | 1.18 (0.91–1.52)p=0.22 | 1.10 (0.92–1.31)p=0.32 | 4.40 (1.77–10.95)p=0.001 |
| College or more | 1.16 (1.02–1.32)p=0.03 | 1.21 (1.06–1.39)p=0.006 | 1.02 (0.80–1.31)p=0.86 | 1.19 (1.02–1.380p=0.03 | 1.31 (1.04–1.66)p=0.02 | 1.14 (0.97–1.33)p=0.12 | 2.01 (0.82–4.91)p=0.13 |
| Working status | |||||||
| Active | 1.87 (1.67–2.10)p<0.0001 | 1.81 (1.60–2.04)p<0.0001 | 2.21 (1.80–2.72)p<0.0001 | 2.46 (2.16–2.80)p<0.0001 | 3.01 (2.46–3.69)p<0.0001 | 2.29 (1.99–2.63)p<0.0001 | 1.94 (1.16–3.26)p=0.01 |
| Monthly income, US$ | |||||||
| 1245–3320 | 1.15 (1.03–1.28)p=0.01 | 1.14 (1.02–1.27)p=0.03 | 1.19 (0.99–1.43)p=0.06 | 1.06 (0.95–1.20)p=0.31 | 0.96 (0.81–1.13)p=0.62 | 1.11 (0.98–1.26)p=0.11 | 0.88 (0.52–1.48)p=0.63 |
| More than US$ 3320 | 1.13 (0.98–1.30)p=0.09 | 1.16 (1.00–1.34)p=0.046 | 0.98 (0.77–1.24)p=0.84 | 0.85 (0.73–0.99)p=0.04 | 0.73 (0.58–0.91)p=0.006 | 0.90 (0.76–1.06)p=0.20 | 0.94 (0.52–1.71)p=0.84 |
All models were adjusted by age, sex, race, educational level, working status and monthly income.
TTH: tension type headache.
Odds ratios (OR), 95% Confidence Intervals (95% CI).
Groups of comparisons: Age≥65 y-old were compared to <65 y-old; Women were compared to men; White, Mixed, Black were compared to Others (Indigenous and Asiatic); High School and College were compared to Elementary; Active working status was compared to retired; Monthly income More than US$ 3320 and 1245–3320 were compared to
Without headaches was considered as the reference group (n=4460).
Additional adjustments for cardiovascular risk factors (hypertension, diabetes, dyslipidemia, obesity) and lifestyle (physical activity level and alcohol consumption), as well as migraine prophylaxis did not modify the directions and the significance of our main findings.
DiscussionIn the ELSA-Brasil, it was observed higher prevalence rates of primary headaches, particularly TTH. Moreover, TTH and migraine headaches were more frequent among those 65 y-old or less. Women presented the highest frequencies of all types of headache, being verified that the highest OR was for the association with definite migraine. Participants who self-reported race (skin color) as White and active workers were more prone to having headaches. Overall, higher education was associated with primary headaches, a high-school education was positively associated with definite TTH, as well as, college or higher level of education was related to having a more definite migraine. Intermediate average monthly family net income was positively associated with definite TTH, while the highest income stratum was inversely associated with definite migraine.
Primary headaches prevalenceComparing our data of TTH with other two previous based population Brazilian studies, the prevalence of definite type was higher, while the frequency of probable type was similar.3,8 Despite differences on sociodemographic background, our TTH rates were more similar to another study in Brazil that evaluated older people living in a very deprived area that reported a prevalence TTH in older women (36.4%) higher than in older men (28.1%).7
For migraine headaches, the frequency of participants with definite and probable migraine headaches were lower than those reported by previous Brazilian studies.2–4 These results suggested that ELSA-Brasil participants have more TTH and less migraine headaches compared to other samples in the country. These numbers for migraine may be explained by the age-strata in the sample (35–74 years of age) that exclude people less than 35 years old who generally present high prevalence of migraine headaches.
Previous data published in high-income countries20–22,26–28 also revealed high prevalence of primary headaches, particularly data from the European countries reported statistics that exceed those observed in the present study.26,27 The Eurolight project, which included data about headache in the last year from 34 studies (all ages) performed in 16 European countries, revealed an overall prevalence of TTH of 62.3%. This prevalence of TTH was higher than ours of 40.3%. In the other hand, migraine prevalence (14.7%) was lower than our prevalence of all migraine (29.2%).26 Updated information about headaches from the same project performed in selected sample from 10 countries (58% female, mean age 43.4 y), including Spain, reported at this time, gender-adjusted 1-year prevalence of migraine higher (35.3%) but lower for TTH (38.2%) compared to our study.27
A Spanish population-based study (50.6% of men, age range from 18 to 65 y-old) reported much lower 1-year prevalence of migraine (12.6%: 8.4% of definite and 4.2% of probable) than ours.28
Primary headaches and sociodemographic factorsAs previously reported by other authors, headaches, particularly migraine, were more frequent among younger individuals, women and Caucasian.2–8,20–24,26–28 Regarding socioeconomic status, its association with primary headaches varies across studies.2,20–24,26–28
In this sample, although the unadjusted frequency of men with definite TTH was slightly higher than that verified in women (Table 1), in the multivariate regression model, female gender was positively associated with TTH compared to men (Table 2). Previous Brazilian study showed a higher frequency of TTH in men compared to women that remained higher in men even after adjustment for age.8 Our results showed an association of individuals with complete high-school or more than high-school education with definite TTH while no association was found between educational level and probable TTH. Our results are in agreement with a US based-population study20 that reported an association between TTH and high education and, with a previous Brazilian study8 that analyzed definite and probable TTH together, as well. Still in this study,8 no association was found for definite TTH and household income, as job status, as it was observed in the ELSA-Brasil.
In fact, no study included information about educational level, household income and TTH in the same analysis as it was demonstrated in the present study.
Our results for definite migraine also confirmed previous studies in Brazil8 and worldwide21,22,29 that reported an association of low and intermediary income with migraine headaches. In our data, both probable TTH and probable migraine were associated with intermediary education levels (high-school) but not with low education levels (less than high-school). Previous Brazilian studies did not separate definite and probable TTH and migraine headaches in the analysis according to sociodemographic variables which difficult comparisons. In addition, ELSA-Brasil is a cohort of civil servants with higher educational attainment, higher average monthly family net income and more access to health care compared to general population in the country which may explain our diverse results for education and household income in probable primary headaches. It is possible to speculate that in the ELSA-Brasil sample, the influence of education is more important in definite TTH while the influence of household income is more important in migraine headaches. The results also suggest that the association among primary headaches with education and household income may not be in the same direction. As few headache studies included education attainment and household income in the analysis it is difficult to compare our results with other data. Only a study of Stewart in 199221 reported that both high education and household income were associated to less migraine headaches which is not in accordance with the present findings. Our results could be affected by health care access, since all ELSA participants have a full access to a dedicated team addressing participants health care needs.
Indeed, active working status was positively associated with both definite and probable migraine as reported by previous European retrospective study.29
Other interesting result is that participants who-self reported themselves as white were associated to all primary headaches. Our results differ from a previous study in Brazil in a middle-town city in the South region of the country that reported a higher frequency of migraine in subjects that self-reported themselves as non-White.23 However, a classical study about migraine in the United States, reported that migraine prevalence is higher in Caucasians, followed by African Americans and Asian Americans.24
Considering the association between aging and headache, the present study depicted different findings from a previous Brazilian study that evaluated primary headaches in individuals 65 years or more in a representative sample living in a very poor neighborhood.7 Frequency of primary headaches in this previous study were 45.6%: 33.1% for TTH and 10.6% migraine headaches, respectively.7 Besides age, differences in the socioeconomic background can explain diverse findings in headache epidemiology comparing Brazilian elderly population and ELSA-Brasil. This previous Brazilian study7 was conducted in an area of high social exclusion with lower educational attainment compared to ELSA-Brasil.
StrengthsThe study has also some strengths. ELSA-Brasil as a large ongoing cohort brings a unique opportunity to compare robust headache data from a middle-country as Brazil, which has one the highest prevalence of headaches, with other populations worldwide. Also, the strict quality control of the study, and the upcoming information about headaches along the follow-up is guaranteed.
LimitationsThis study has many limitations. It is a cross-sectional analysis that does not permit to evaluate causality. Our findings should be interpreted with caution since this sample has some particularities such as higher educational attainment and household income compared to the Brazilian population. However, ELSA-Brasil sample is very representative of the Brazilian population living in large metropolitan areas and, some data from ELSA are in accordance to previous results of the Risk and Protective Factors Surveillance System for Chronic Non-communicable Diseases (VIGITEL) a large system of surveillance of risk factors by telephone for variables measured using similar strategy in both studies.25 As ELSA-Brasil is focused on cardiovascular diseases and diabetes, only participants 35–74 years of age at baseline were included. Therefore, individuals with less than 35 years who frequently report primary headaches, especially migraine were not considered in the present analysis.
ConclusionsData from ELSA-Brasil study confirmed the huge prevalence of primary headaches in a sample with high educational attainment and household income especially for women. Our data also suggest that low educational attainment is more associated to TTH and high household income was inversely associated to migraine headaches. Therefore, there is a complex pattern in the association of education and income with primary headaches.
FundingThe ELSA-Brasil baseline study was supported by the Brazilian Ministry of Health (Science and Technology Department) and the Brazilian Ministry of Science and Technology (Financiadora de Estudos e Projetos and CNPq National Research Council) (grants 01 06 0010.00 RS, 01 06 0212.00 BA, 01 06 0300.00 ES, 01 06 0278.00 MG, 01 06 0115.00 SP, 01 06 0071.00 RJ).
Ethics or institutional review board approvalEthics committee of each six ELSA-Brasil centers approved this study.
Conflict of interestAlessandra C. Goulart. Paulo A. Lotufo, PhD, Itamar de Souza Santos and Isabela M. Benseñor have none.
Mario F. P. Peres has the following conflicts: Speaker for Lily, Novartis, Allergan, Teva, Libbs and Consulting for Pfizer, Sanofi, Teva, Lilly, Novartis, Hefesto, Libbs, Allergan, Eurofarma and Ache.
The authors thank the research team of the ELSA-Brasil study for their contributions.
