


Evaluating whether meteorological and geographical variables could be associated with the severity of COVID-19 in Spain.
MethodsAn ecological study was performed to analyze the influence of meteorological and geographical factors in hospital admissions and deaths due to COVID-19 in the 52 provinces of Spain (24 coastal and 28 inland regions), during the first three pandemic waves. Medical and mortality data were collected from the Carlos III Health Institute (ISCIII) and meteorological variables were requested to the Spanish State Meteorological Agency (AEMET).
ResultsRegarding the diagnosed cases it is remarkable that the percentage of patients hospitalized for COVID-19 was lower in the coastal provinces than in the inland ones (8.7±2.6% vs. 11.5±2.6%; p=9.9×10⁻⁵). Furthermore, coastal regions registered a lower percentage of mortality than inland regions (2.0±0.6% vs. 3.1±0.8%; p=1.7×10⁻⁵). Mean air temperature was inversely correlated both with COVID-19 hospitalizations (Rho: −0.59; p=3.0×10⁻⁶) and mortality (Rho: −0.70; p=5.3×10⁻⁹). In those provinces with a mean air temperature <10°C mortality by COVID-19 was twice that of those with >16°C. Finally, we found an association between mortality and the location of the province (coastal/inland), altitude, patient age and the average air temperature; the latter was inversely and independently correlated with mortality (non standardised B coeff.: −0.24; IC 95%: −0.31 to −0.16; p=2.38×10⁻⁸).
ConclusionsThe average air temperature was inversely associated with COVID-19 mortality in our country during the first three waves of the pandemic.
Evaluar si factores meteorológicos y geográficos pudieron relacionarse con la gravedad de la COVID-19 en España.
MétodosEstudio ecológico, a escala provincial, que analiza la influencia de factores meteorológicos y geográficos en la hospitalización y mortalidad por COVID-19 en las 52 provincias españolas (24 costeras y 28 del interior), durante las tres primeras olas. Los datos de hospitalizaciones y mortalidad se obtuvieron del Instituto de Salud Carlos III (ISCIII). Los datos epidemiológicos del Instituto Nacional Estadística (INE) y la Red Nacional de Vigilancia Epidemiológica (RENAVE). Las variables meteorológicas de la Agencia estatal de meteorología (AEMET).
ResultadosEl porcentaje de pacientes hospitalizados por COVID-19, del total de personas infectadas, fue inferior en las provincias costeras que en las del interior peninsular (8,7±2,6% vs. 11,5±2,6%; p=9,9×10⁻⁵). De igual manera la costa registró menor porcentaje de mortalidad que el interior peninsular (2,0±0,6% vs. 3,1±0,8%; p=1,7×10⁻⁵). La temperatura media correlacionó negativamente con la hospitalización (Rho: −0,59; p=3,0×10⁻⁶) y la mortalidad por COVID-19 (Rho: −0,70; p=5,3×10⁻⁹). Las provincias con una temperatura media <10°C duplicaron la mortalidad por COVID respecto a las de >16°C. La mortalidad se relacionó con la localización provincial (costa/interior), la altitud, la edad de la población y la temperatura media, siendo esta última la variable asociada de manera independiente (Coef. B no estandarizado: −0,24; IC 95%: −0,31 a −0,16; p=2,38×10⁻⁸).
ConclusionesLa mortalidad por COVID-19 durante las tres primeras olas de la pandemia en nuestro país se asoció inversamente con la temperatura media.
COVID-19 has displayed geographic differences that could be explained, in part, by the influence of climatic factors.1 Changes in air temperature and humidity could favour the transmission of SARS-CoV-2.2 Additionally, the climate determines the quality of the air and the levels of environmental contamination, which are both related to the incidence of the disease.3
Meteorological and geographical factors have also been linked to the severity of COVID-19.4 As with other respiratory viruses,5 the hospitalisation and mortality rate due to this disease seem to increase in cold regions while its severity seems to decrease in rising temperatures.6 There are several hypotheses that could explain these facts, for example, that temperature modulates virus viability (greater survival of coronaviruses at low temperatures),7 or that cold and dry air affects the individual’s respiratory mucosa properties and immune response, which is already affected as a person ages.8
Our working group demonstrated an influence of the average environmental temperature on the cumulative incidence of COVID-19 in our country during the first three waves of the pandemic. The Spanish provinces with a mean temperature <10°C doubled the cumulative incidence of those with a mean temperature >16°C.9 We now hypothesise that meteorological and geographical variables could influence disease severity, specifically regarding hospitalisations and mortality from COVID-19, in the 52 Spanish provinces during the first three waves of the pandemic.
MethodsAn ecological study at the provincial level carried out during three periods defined by the peak incidence of COVID-19 in Spain (March–May 2020, September–November 2020 and December–February 2021). Demographic data were obtained in each of the 52 provinces (number of inhabitants, provincial population density [inhabitants/km2] and average age in years) from the National Statistics Institute (INE).
Meteorological dataThe meteorological variables were obtained from the State Meteorological Agency (AEMET), corresponding to monthly measurements from 870 meteorological stations. An average was calculated per province, using the data from all the stations located within that province. The analysed variables were: the average temperature in degrees Celsius (°C), relative humidity as a percentage ratio (%) of the amount of water vapour present in the air to the maximum amount the air can hold at a given pressure and temperature, the precipitation measured in millimeters of height of rainfall (mm), the percentage of calm air (percentage of days of the month in which there was an absence of wind in a specific direction), and the provincial altitude in meters (m).
COVID-19 dataThe number of cases detected in each province was obtained from the National Epidemiological Surveillance Network (RENAVE) through the computer platform via Web SiViES (Surveillance System of Spain) managed by the National Epidemiology Centre (CNE). The data on hospitalisations, admission to the ICU, and mortality from COVID-19 were obtained from the Instituto de Salud Carlos III (ISCIIII — Carlos III Health Institute). These data are extracted from the individualised notifications made by the autonomous communities (CCAA) to RENAVE through the SiViES web computing platform managed by the CNE.
The percentage of patients hospitalised for COVID-19 was calculated by obtaining the number of diagnosed cases of the disease in each province and dividing it by the number of patients hospitalised for COVID-19, in the defined period of time. Similarly, the percentage of patients admitted to the ICU due to COVID-19 was calculated by obtaining the number of diagnosed cases of the disease in each province and dividing it by the number of patients in the ICU due to COVID-19, in the defined period of time. The percentage of patients who died from COVID-19 was calculated by obtaining the number of diagnosed cases of COVID-19 in each province, and dividing it by the number of cases who died from COVID-19, in the defined period of time.
The data analyses were carried out in the 52 Spanish provinces: 24 coastal provinces with access to the sea and 28 inland (Appendix A Supplementary material) for each of the time periods and for the total (average of the three time periods). The STROBE guidelines have been followed for the publishing of this study.10
Statistic analysisThe data were expressed as the mean ±standard deviation (SD). The distribution of the quantitative variables was analysed with the Kolmogorov–Smirnov test. The Student’s t-test or the Mann–Whitney test was used for the comparison of quantitative variables, and the chi-square test or Fisher’s test for the qualitative variables. To study the relationship between quantitative variables, the Pearson or Spearman (Rho) correlation was used. A univariate multiple linear regression analysis was performed to determine the association between the severity of COVID-19 (dependent variables: hospitalisations and mortality from COVID-19) and the variables under study (independent variables: provincial location, altitude, population density, average provincial age, average temperature, relative humidity, rainfall and percentage of calm air). Then a multivariate analysis was performed that included mortality from COVID-19 as a dependent variable, and those that showed statistical significance in the univariate as independent variables. The hypothesis contrast tests considered a p value<0.05 as statistically significant. The unstandardised coefficientB shows the effect the change of a unit in the independent variable has on the dependent variable. All the data were analysed with the SPSS (Statistical Package for Social Sciences, Chicago, IL, USA) statistical programme.
ResultsSpain has 47,026,208 inhabitants (51% women and 49% men) distributed in 52 provinces (24 coastal and 28 inland). Mortality from COVID-19 was lower in the coastal provinces (2.0±0.6%) compared to those inland (3.1±0.8%) during the first three waves (CI95%: −1.4 to −0.5; p=1.7×10⁻⁵). Mortality in the first period was 9.7±0.6% on the coast and 12.8±3.5% inland (CI 95%: −5.1 to −1.1; p=0.006); in the second period it was 1.4±0.5% vs. 1.8±0.5% (CI95%: −0.7 to −0.1; p=3.9×10⁻⁴), and in the third period it was 1.8±0.6% vs. 2.0±0.6% (CI95%: −0.5 to 0.1; p=0.095) (Table 1). The provinces with the highest mortality were Soria (5.6%) Segovia (4.3%) and Zamora (4.2%), and those with the lowest mortality were Huelva (1.3%), Las Palmas (1.2%) and Melilla (1%).
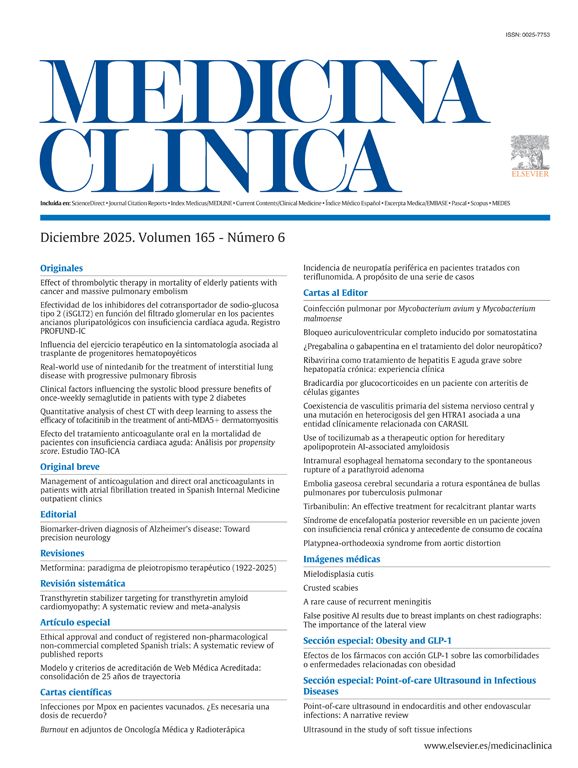
Distribution of the variables in coastal and inland provinces.
| Coastal provinces | Inland provinces | p | |
|---|---|---|---|
| n=24 | n=28 | (CI95%) | |
| Provincial altitude (meters) | 289 (161) | 743 (229) | 4.5×10⁻⁸ (−566 to −341) |
| Provincial population density (inhab./km2) | 210 (165) | 67 (153) | 5.6×10⁻⁷ (53–234) |
| Provincial age (years) | 43.5 (3.0) | 45.5 (2.5) | 0.01 (−3.6 to −0.5) |
| No. of COVID-19 cases | |||
| Total | 64,093 (71,855) | 47,944 (96,356) | |
| First period | 4115 (8675) | 5039 (13,064) | |
| Second period | 24,528 (28,627) | 21,344 (40,558) | |
| Third period | 35,449 (39,222) | 21,561 (43,198) | |
| Hospitalised due to COVID-19 (%) | |||
| Total | 8.7 (2.6) | 11.5 (2.6) | 9.9×10⁻⁵ (−4.2 to −1.2) |
| First period | 38.6 (11.8) | 42.4 (11.6) | 0.54 (−10.3 to 2.7) |
| Second period | 7.2 (2.7) | 8.2 (1.9) | 0.03 (−2.2 to 0.3) |
| Third period | 7.2 (2.4) | 8.1 (2.1) | 0.06 (−2.1 to 0.3) |
| ICU due to COVID-19 (%) | |||
| Total | 1.0 (0.4) | 0.9(0.2) | 0.62 (−0.0 to 0.3) |
| First period | 4.9 (2.2) | 3.4 (1.5) | 0.009 (0.4–2.5) |
| Second period | 0.8 (0.4) | 0.7 (0.2) | 0.08 (−0.0 to 0.3) |
| Third period | 0.9 (0.4) | 9.7 (0.2) | 0.19 (−0.0 to 0.3) |
| Mortality due to COVID-19 (%) | |||
| Total | 2.0 (0.6) | 3.1 (0.8) | 1.7×10⁻⁵ (−1.4 to −0.5) |
| First period | 9.7 (3.6) | 12.8 (3.5) | 0.006 (−5.1 to −1.1) |
| Second period | 1.4 (0.5) | 1.8 (0.5) | 3.9×10⁻⁴ (−0.7 to −0.1) |
| Third period | 1.8 (0.6) | 2.0 (0.6) | 0.095 (−0.5 to 0.1) |
Mean (standard deviation). Mann–Whitney. CI of the difference between both types of provinces.
Hospitalised due to COVID-19 (%): hospitalised due to COVID-19/COVID-19 cases×100.
ICU due to COVID-19 (%): ICU admissions due to COVID-19/COVID-19 cases×100.
Mortality due to COVID-19 (%): deaths due to COVID-19/COVID-19 cases×100.
The coastal provinces also had a lower percentage of patients hospitalised due to COVID-19: 8.7±2.6% vs. 11.5±2.6% inland (CI 95%: −4.2 to −1.2; p=9.9×10⁻⁵) (Table 1). There were no geographic differences in the percentage of ICU admissions due to COVID-19.
The geographic distribution of hospitalisations and mortality from COVID-19 in all provinces is shown in Fig. 1.

In the analysis according to gender, mortality from COVID-19 was higher in men than in women (6.1±1.9% vs. 4.2±1.3%; p=1.16×10⁻⁷), so analyses were stratified according to sex. Mortality from COVID-19 in men was 5.1±1.5% on the coast and 7.0±1.8% inland (p=0.001). In women it was 3.6±1.2% on the coast vs. 4.6±1.1% inland (p=0.007) (Fig. 2). Similarly, hospitalisation due to COVID-19 was higher in men than in women (11.8±3.2% vs. 8.6±2.5%; p=4.8×10⁻⁷). The percentage of hospitalised males was 10.2±3.0% on the coast and 13.2±2.9% inland (p=0.00019), and in women, 7.4±2.4% vs. 9.7±2.1% (p=0.00009) (Fig. 3).


The average temperature in the three time periods was higher in the coastal provinces than in those inland (2.2°C in the first period, 3.3°C on second and 5°C in the third); also the relative humidity was higher in the first two time periods (3% and 4%, respectively). The precipitations and the percentage of calm air did not show significant differences.
Mean temperature was negatively correlated with COVID-19 mortality (Rho: −0.70; p=5.3×10⁻⁹). This correlation was observed both in males (Rho: −0.47; p=0.0003) as well as in females (Rho: −0.39; p=0.004). Mean temperature was able to explain 46% of the total variability of mortality in both sexes (R2 linear: 0.46). The provinces with an average temperature <10°C registered almost twice the mortality from COVID-19 than provinces with temperatures >16°C (Fig. 4).

Mean temperature was also negatively correlated with the percentage hospitalised for COVID-19 (Rho: −0.59; p=3.0×10⁻⁶), both in males (Rho: −0.61; p=0.000001) and in females (Rho: −0.56; p=0.00001). Mean temperature was able to explain 26% of the total variability of hospitalisation due to COVID-19 (R2 linear: 0.26).
Provincial altitude was also correlated with mortality (Rho: 0.62; p=7.0×10⁻⁷) and hospitalisations due to COVID-19 (Rho: 0.52; p=6.0×10⁻⁵).
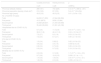
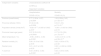
The univariate linear regression analysis showed an association between mortality from COVID-19 and the location of the province (coast/inland), the provincial altitude, the mean age of the population, and the mean environment temperature (Table 2). Multivariate regression analysis showed that the mean temperature was the independent variable associated with mortality with an unstandardised coefficientB from −0.24 (CI95%: −0.31 to −0.16; p=2.38×10⁻⁸) and a standardised beta coefficient of −0.68.
Univariate linear regression analysis. Dependent variables: hospitalisation and mortality from COVID-19 (%) in the three periods.
| Independent variables | Unstandardised coefficient B | |
|---|---|---|
| (CI 95%) p | ||
| Dependent variables | ||
| Hospitalisation | Mortality | |
| COVID-19 (%) | COVID-19 (%) | |
| Province (coast/inland) | 2.77 (1.28 to −4.27) | 1.02 (0.59 to 1.45) |
| p=0.0004 | p=1.63×10⁻⁵ | |
| Provincial altitude (100m) | 0.5 (0.3–0.8) | 0.2 (0.1–0.3) |
| p=0.0006 | p=7.0×10⁻⁷ | |
| Population density (inhab./km2) | −0.82×10⁻⁵ (−0.005 to 0.005) | −0.001 (−0.003 to 0.000) |
| p=0.97 | p=0.10 | |
| Provincial mean age (years) | 0.57 (0.33–0.81) | 0.17 (0.10–0.24) |
| p=0.00001 | p=1.72×10⁻⁵ | |
| Mean temperature (°C) | −0.58 (−0.86 to −0.30) | −0.24 (−0.31 to −0.16) |
| p=0.0001 | p=2.38×10⁻⁸ | |
| Relative humidity (%) | 0.06 (−0.10 to 0.24) | 0.02 (−0.03 to 0.75) |
| p=0.45 | p=0.42 | |
| Rainfall (mm) | 0.01 (−0.01 to 0.03) | 0.001 (−0.006 to 0.008) |
| p=0.33 | p=0.75 | |
| % Calm air | 0.03 (−0.86 to −0.30) | 0.02 (−0.04 to 0.09) |
| p=0.0001 | p=0.43 | |
Hospitalisation due to COVID-19 was also related to the provincial location (coast/inland), altitude, mean age of the population, mean temperature, and percentage of calm air (Table 2), with the mean age being the variable independently associated with hospitalisation with an unstandardised coefficient B of 0.47 (CI95%: 0.16−0.78; p=0.004) and standardised beta of 0.46.
DiscussionAverage temperature could influence hospitalisation and mortality due to COVID-19 in Spain during the first three waves of the pandemic. Specifically, the Spanish provinces with the lowest temperatures (<10°C) registered twice the mortality from COVID-19 than those with higher temperatures (>16°C).
The geographical differences described for COVID-19 could be explained, in part, by the influence of climatic factors.11 The transmission of SARS-CoV-2 appears to increase with decreasing temperatures.1 Our group described an increase in the cumulative incidence of COVID-19 in the Spanish provinces in relation to the decrease in the mean temperature.9 We now conclude that temperature not only influenced the transmission of SARS-CoV-2, but also the severity of the disease in different periods, since the coldest provinces registered a higher percentage of hospitalised people as well as a higher mortality rate due to COVID-19, than the provinces with warmer temperatures. This was found to be true in both sexes.
Respiratory viruses are responsible for higher mortality in winter, which also coincides with an excess of deaths from cardiovascular disease.12 Several studies state that the severity of SARS-CoV-2 is also higher in winter. An ecological study in France describes higher mortality due to COVID-19 in hospitalised patients from cold climate zones.6 Higher mortality rates were registered during the pandemic in Northern Italy compared to the south of the country.13 In this sense, a rise in temperature appears to reduce deaths due to COVID-19; to be specific, the increase of 1°C represented a decrease in mortality of 1.19%14 at 6%,15 according to different studies. Furthermore, in various European countries and in the United States mortality due to COVID-19 decreased during the summer.16 There are several hypotheses to explain these facts. SARS-CoV-2 survives best at low temperatures (4°C), both in aerosols and on surfaces and wastewater8; however, a temperature >35°C inactivates it.17 On the other hand, cold and dry air alters the individual's immune response, especially the cytokine synthesis,18 which can favour the severity of the viral infection.
Other meteorological factors, such as relative humidity, have also been linked to the severity of COVID-19. Cold and dry air favours viral respiratory infections, as it increases the dryness of mucous membranes, a fact that is aggravated by the use of heating in winter. In this sense, a study conducted in 166 countries (excluding China) found that a 1% increase in relative air humidity reduced daily deaths due to COVID-19 by 0.51% (CI95%: 0.34%–0.67%).19 However, other authors, as well as ourselves, have not described this relationship.20 The wind could also favour the transmission and severity of COVID-19, partly due to its relationship with pollution.21 Environmental pollution has had a direct effect on mortality due to COVID-19 in neighbouring countries.22 In our study, we found a positive association between the number of hospital admissions and the percentage of calm air (absence of wind in any direction), although finally it is not an independent variable associated with mortality.
Several studies have also linked geographical factors, such as altitude, with the severity of the disease. Altitude hypoxia could mediate worse disease progression.23 In our study, the peninsula’s inland provinces, that is, those with a higher altitude, had a higher mortality; however, finally, the geographical differences found were explained by the mean temperature (lower in the inland provinces), since this was the independently associated variable.
Throughout the world, COVID-19 has generated excess mortality24 which appears to be higher in males than in females.25 A meta-analysis of 76 studies with 17,860,001 patients from 14countries found that men had a higher risk of death due to COVID-19, with an OR of 2.05 (CI95%: 1.39–3.04).26 In our study, men also had higher mortality than women (6.1% vs. 4.2%), which coincides with that described in other neighbouring countries.27 Several factors have been put forward as an explanation for this occurrence, such as the possible differences in the immune response to SARS-CoV-2 or in the ACE2 expression and regulation.28 Another suggestion discussed has been the role of the sex hormones.29
On the other hand, we found that the percentage of people hospitalised due to COVID-19 was higher in provinces with older populations. Age is a risk factor for the severity of COVID-1930 which has been attributed, in part, to age-related changes in the immune system.8
Our study has limitations because it is an ecological study and the association found does not presuppose causality. Therefore, the study has a predictive and hypothesis-generating approach, but its observational nature does not allow any causal relationship to be established, for intervention purposes. In addition, it must be taken into account that the sample size is a conditioning element of the statistical power for some of the comparisons. Additionally, we do not know the influence of other factors, such as comorbidity, air pollution, or exposure to ultraviolet rays, which could have influenced the severity of COVID-19 in our country.
In conclusion, the severity of the pandemic in our country was associated with meteorological factors such as mean temperature. Recognition of this fact is important for managing COVID-19 in the coming winters, as well as for scheduling the vaccine, especially in the most vulnerable groups.
Ethical considerationsNot required.
FundingNone.
Conflict of interestsAll authors declare they have no conflict of interest.
We appreciate the advice and collaboration of the AEMET-Cantabria personnel.
The following is Supplementary data to this article:

