


The main aim of this work is to analyze Premium Private Labels (PPL) in the food sector. To do so, we have obtained data from both on-line and off-line channels, analyzing social networks, specifically Twitter, and from carrying out personal surveys of customers in the sales point to check their opinions about the perceived quality, brand value, and other PPL-related variables. We analyzed a total of 7 Twitter accounts of the main supermarket and hypermarket chains over a year and did 600 customer surveys in points of sale. Among the main results stands out the fact that the perceived quality of the PPL compared with the brand leader varies among the main distributors. There are also significant differences between the brand value of the 3 PP L analyzed. On the other hand, no relation was detected between the income levels and the brand equity of PPL buyers.
The study of the strategies which the major retailers are carrying out in their establishments is necessary to understand the boom of Premium Private Labels (PPL) (Choi, 2016). For Ailawadi and Keller (2004), this new context of growing sales and greater acceptation of PPL is a consequence of a well-designed retailer strategy. The offer of a portfolio of own brands includes, generally, one that is generic, or economical, one that is standard and one that is Premium. These occupy different positions in the minds of the consumer (Geyskens, Gielens, & Gijsbrechts, 2010; Kumar & Steenkamp, 2007). The PPL is determinant for retailers, given that it is leading the consumer to see them as a separate group with respect to the rest (Nenycz-Thiel & Romaniuk, 2016).
In spite of the growing academic research on PPL, there is scant analysis of this phenomenon from the brand value perspective (Cuneo, Lopez, & Yagüe, 2012). To understand if the value of the distributor brands depends on the category into which they are grouped (Huang & Huddleston, 2009), it is fundamental to comprehend the Premium phenomenon within the distributor brand (Ohlson, 2019). The behavior of consumers has been investigated in the literature in many areas (Keller, 1993), but not from the perspective of PPL. This indicates the relevance of this research.
Some authors (Keller, Dekimpe, & Geyskens, 2016; Puelles, 1995) establish that the main retail leaders are developing PPL in innovative products with a better quality-price relationship than the manufacturers' brands. From this standpoint, PPL are in the upper extreme of the market and their unique characteristics in terms of flavor, origin and/or ingredients enable retailers to compete with higher quality national brands (Ter Braak, Geyskens, & Dekimpe, 2014). These products, according to Puelles (1995), are aimed at a public of different sociodemographic characteristics but who have a good purchasing power.
In its origins, one of the first authors to write about PPL together with Bazoche (Bazoche, Giraud-Héraud, & Soler, 2005) was Kumar (Kumar, 2007). The latter author stated that retail companies were looking for ways to compete against manufacturer brands inside their stores. Consequently, they began to search for solutions, so they introduced variations of the distributor brands in their shelves, but with a superior quality. In this sense, Dobson, & Chakraborty (Dobson & Chakraborty, 2009) established that the market share of PPL grew faster than the market share of PL. This fact was a crucial factor for the implementation by other retailers of this type of brand within their stores. PPLs can be defined as those products branded as private labels that are positioned at the top end, with respect to quality, within the retail chains. These products have unique characteristics in terms of flavour, origin and / or ingredients that allow retailers to compete with the highest quality manufacturer brands (Bazoche et al., 2005). In this sense, the positioning of the PPL is very different from the positioning of the standard PL and is thus affirmed by some authors (Ter Braak, et al. 2014). While the standard PL tends to imitate manufacturer brands (Geyskens, et al. 2010), selling at a 20-30% lower price (Steenkamp, et al. 2010), PPLs are positioned at the upper end of the market, and offer quality similar or superior to the manufacturer brand (Geyskens, et al. 2010). Also, their prices are very similar to the price of manufacturers' brands, being sometimes higher (Lewin, Gomez-Arias, & Bello-Acebron, 2008). Notorious examples are Loblaw's President's Choice in the United States, and Tesco's Finest in the United Kingdom (Ter Braak, et al. 2014). Many relevant retailers sell PPL such as Carrefour (Selección Carrefour), Eroski (Eroski SELEQTIA), DIA (Delicious), or LIDL (Deluxe) in Spain.
In this article we analyze the sector of distributor brands in Spain, which, along with Switzerland, has led the market share of distributor brands and their Premium variant during recent years with shares over 40% of total sales (Arias Fernández, Pineda, & Florencio, 2015). The main aim of this work is to analyze the PPL in food retailers in the off-line and on-line channels, centering on the constructs of perceived quality, perceived value, brand value, awareness value and brand image. We will carry out a novel contribution with regard to the extant research, through incorporating the study of PPL in the social networks environment, which has become an accessible and multitudinous form of interacting, achieving and sharing information on brands and products (Barreto, 2014).
With the emergence of these means of communication, brands are faced with the challenge of finding new ways, tones and contents which capture the attention of the users who browse on social networks (Bigné & Hyder, 2012; Kuo & Yen, 2009). In this context, it is an imperative for any retailer to understand, assume and evolve in a similar way to how the virtual social networks and their tools develop (Lee, Park, & Han, 2008). Brands now comprehend not only how their commercial message must be, but also how to deal with more elusive and restrictive users who base a great part of their decisions on impulses generated through the networks (Curras, Ruiz, & Sanz, 2011).
The current article is structured as follows. First, we describe the theoretical antecedents of the study's topic and establish the research propositions. Then, we present the methodology applied and, finally, the analysis of the empirical data, setting forth, at the end, the conclusions and limitations for future research.
Theoretical review and formulating of propositionsLamey, Deleersnyder, Steenkamp, and Dekimpe (2012)) point out that consumers are more receptive to distributor brands and PPL in times of economic difficulties. Therefore, the periods of monetary contraction are a great opportunity for retailers. The value proposals of distributor brands cover a broad spectrum, from Premium to low cost (Nenycz-Thiel & Romaniuk, 2016). The different positioning of distributor brands hence have a different value proposal to deal with the distinct profiles of consumers (Geyskens, Keller, Dekimpe, & de Jong, 2018; Kumar, 2019). To know the consumers who are more inclined to their purchase is important to have advantages in categories in which the distributor brands and the PPL have a greater power (Ailawadi et al., 2010).
Perceived quality and value of premium private labelsFew studies have tried to characterize distributor brand shoppers based on their sensitivity to the product's perceived quality (Ohno & Takemura, 2019). This concept was defined by Olshavsky (1985), who considers a product's perceived quality as a relatively global value judgment generated in the relations between customers and suppliers and in which both parts are active. Ailawadi, Neslin, and Gedenk (2001)) qualify the distributor brand customer as not being sensitive to the service's perceived quality. Other studies share this statement, such as Ailawadi and Keller (2004) and Ailawadi, Pauwels, and Steenkamp (2008)). There are also conflicting positions, such as Nenycz-Thiel and Romaniuk (2016) who consider the perceived quality of PPL to be perfectly comparable with manufacturers' brands. In this sense, many authors have measured this variable, establishing that this perceived quality can be affected by different qualities, such as the packaging (Immonen, 2010), the product itself (Kim, Lee, Lee, & Taylor, 2019) or the retailer's own image (Martinelli & Vergura, 2020).
Other authors, such as Geyskens et al. (2010) establish that the perceived quality of PPL and their brand value generally cannibalize other products within the same establishment, acting with the same pattern in different retail sales points. This means that if the profile of customers of different chains varies from one to another, their brand value perceptions will also be different. From the previous literature we propose the following:P1a The perceived quality of PPL with respect to the brand leader varies among the main distributors. There are significant differences between the brand values for distinct PPL.
Many distributors currently have sophisticated distributor brand strategies which range from options which compete in prices (generic brands) to others that do so due to being the best products in the market (Premium brands), aiming them at another market segment (Reimann & Wagner, 2016). The distributors therefore handle a portfolio of distributor brands with the aim of reaching different segments whose main differentiation lies in their purchasing power (Geyskens et al., 2010; Kumar & Steenkamp, 2007).
Some authors establish that PPL cause a positive impact on customer loyalty through a causal relation with the perceived value (Martinelli & Vergura, 2014). There are various examples in the literature of the impact of incorporating these Premium brands into the range and providing the distributor with the possibility of increasing its margins, enhancing its own range with exclusive products (Ailawadi & Keller, 2004; Garretson, Fisher, & Burton, 2002; Pauwels & Srinivasan, 2004; Sprott & Shimp, 2004). These exclusive products can be identified by a high income customer segment, as the prices are similar to those of the manufacturer's brand (Dunne & Narasimhan, 1999; Pınar & Girard, 2020).
IRI (2014) establishes that the distributors are moving ever more further away from large discounts and promotions, increasing prices to satisfy the demand of the consumers who want better quality Premium products. In this sense, the distributors are taking into account that there is a segment of their clientele that seeks superior quality above price and therefore, the different distributors are adapting to this reality (Geyskens et al., 2010; Loebnitz, Zielke, & Grunert, 2020).
In the literature, the brand equity of the distributor brand has been dealt with as a determinant factor when purchased by different segments within the retailers' portfolios (Ailawadi et al., 2001). Defining it as a concern about paying low prices, subject to some restriction of quality (Lichtenstein, Netemeyer, & Burton, 1990). The customers' brand equity of their brands is a characteristic which retailers must know to determine what strategy to follow in their establishments regarding these brands (Pillai & Kumar, 2012; Ruiz-Real, Gázquez-Abad, Esteban-Millat, & Martínez-López, 2018). Retailers must continue working to achieve consumer learning with tools such as PPL in their establishments (Beldona & Wysong, 2007), or the delivery of samples of products to improve the valuing of their brands.
Baltas, Paraskevas, and Argouslidis (2007)) show that consumers' preferences for distributor brands, including their Premium version, stem from a broad process of evaluation in which the quality, time, gender, age, etc., along with the awareness value have a main role. In this way, the manufacturers do not assume that the distributor brands are only cheap alternatives (Olsen & Sallis, 2010), bought by those who cannot pay for the national brands, as with the emergence of the PPL the role given to them by the manufacturers has changed (Beneke, 2013). It is important to highlight the extraordinary change in both quality and perceptions of standard and premium private labels currently (Bronnenberg, Dubé, & Sanders, 2020; Abril & Rodriguez-Cánovas, 2016). Now, they are seen as attractive alternatives to products of national brands. According to this viewpoint, this work will try to note if the public who buys PPL corresponds to a middle/high socioeconomic segment. From the aforesaid, we propose the following: P2a There is a positive relation between the perceived value of PPL and the income level. There is no relation between the income level and the perceived value of the buyers of PPL.
The distributor brand strategies developed throughout recent years have meant the coinciding of the brand denomination with that of the chain brand-name (Nenycz-Thiel & Romaniuk, 2012; Tandon & Verma, 2020). Or using it as a support of an own brand to obtain credibility and a guarantee for this brand. This shows that the interrelation between the chain-label and its distributor brands has been taken advantage of to improve the value of the latter, both in their standard and Premium facets (Beristain, 2009).
The image of the retail chain is a multidimensional aggregate of associations linked to the label in the consumer's mind. Not in vain are those brand-chain-linked associations nodes of information bound to that of the brand, which can host not only perceptions about its attributes, but also the fruits which derive from them (Martinelli, De Canio, & Marchi, 2019). That is to say, the benefits and attitudes which the consumer associates with the brand (Nabec, 2002). From this, we deduce that the brand's image will be influenced to a greater or lesser extent by its corporate conduct. This behavior is manifested in the firm's social (Jones, Comfort, & Hillier, 2007) and strategic area (Fombrun & Shanley, 1990; Higgins & Bannister, 1992).
On the other hand, it is to be highlighted that the management of the brand identity has become more sophisticated with the passing of time (Floor, 2006). Hence we will need to analyze this statement based on the quality of the establishment to verify if what other researchers propose about the matter is also the case for PPL (Beristain & Zorrilla, 2011; Schnittka, 2015). On this basis, we formulate the following:P3 The image of the establishment influences the PPL's perceived quality.
According to the aforementioned, to ponder the perceived quality of retail establishments' PPL and compare them with the corporate image of chains can turn out to be interesting (Blanco, García, & Martín, 2011). Social networks play increasingly more an important role in the development of the strategies of the large distributor firms, being the means by which customers comment freely about the aspects which each brand is projecting at the consumer. Therefore, social networks should be considered a fundamental communication tool within organizations (Sokolova & Kefi, 2020).
Social networks are considered a suitable context for learning (Dabbagh & Kitsantas, 2012), being a key to inquire into the process by which people learn in these new environments and what their motivations are to do so. The use of Internet as a factor of digital inclusion has been explored from different perspectives in the scientific literature. The motivations of use being the most common (Lin & Lu, 2011; Seidman, 2013; Tosun, 2012; Yang & Brown, 2013). More specifically, there are investigations centered on the motivations of use of Facebook and Twitter (Arteaga, Cortijo, & Javed, 2014; Dogruer, Menevis, & Eyyam, 2011; Seidman, 2013; Tosun, 2012; Yang & Brown, 2013).
Due to all this, social networks can be understood as spaces of information exchange and the generation of relations which are becoming more relevant (Hsiao, Wang, Wang, & Kao, 2019). As they make possible the interaction of people interested in common topics who can share or exchange information, knowledge, experiences, interests and/or needs. The potential benefits which stem from the use of these networks are not only for the users who participate in them, but also for the firms (Brown, Mawson, & Rowe, 2019). These organizations, through the comments made on these virtual platforms, can know the tastes, desires and needs of the people who are on them, their uses, consumption behaviors and background, as well as their levels of satisfaction and dissatisfaction (Neelotpaul, 2010). This is why we analyzed the feelings of the retail brand's users in the social networks to know if its brand strategy is perceived in the same way by the consumers and establish if the Premium products have a place in their establishments.
Social networks have become indispensable for consumers (Ferreira, Santos, & Malta, 2020). Thanks to them they are now not limited to getting opinions and recommendations only through the people who they know. They also are in touch with comments made by unknown people about the product or brand (Barreto, 2014). An essential point for firms to take into account when they participate in social networks, and which many articles underscore, is the handling by firms of the e-WOM about their brands (Alvandi, Fazli, & Amiri, 2014). The success of e-WOM is determined by the satisfying of the consumers' social and functional needs, as they seek both useful information about the product (functional needs) and relations with other members through these platforms (social needs) (Chih, Wang, Hsu, & Huang, 2013). Either as on-line or off-line shoppers, people more and more turn to Internet and social networks as a source of information to advise them on their purchase (Rondán-Cataluña, Arenas-Gaitán, & Ramírez-Correa, 2015), especially concerning products and services about which they have little information.
Currently, Internet users have access to virtual information in their mobile phone, being able to consult personal comments about any product through recommendations shared or conversations held with other users, before, during and after the shopping process (Court, Gordon, & Perrey, 2012). This is why brands are banking on channel 2.0 promotions.
The virtual contents generated by users are an important source for the analysis of feelings (Phan et al. 2020). Those most used in the research on this discipline have been reviews of products and services, microblogging (especially Twitter), publications in blogs and news in webs (Boyd & Ellison, 2008; Medhat, Hassan, & Korashy, 2014; Tsytsarau & Palpanas, 2012; Vinodhini & Chandrasekaran, 2012). Various researchers state in their investigations that Twitter is appropriate for the analysis of feelings and that it is possible to link feelings and attitudes (Pak & Paroubek, 2010; Thelwall, Buckley, & Paltoglou, 2011; Jiang, Yu, Zhou, Liu, & Zhao, 2011). Therefore, the content generated by the users of social media based on their feelings is a source of notable influence in the shopping decisions of other users (Cantallops & Salvi, 2014; Trusov, Bucklin, & Pauwels, 2009). Therefore, electronic word of mouth affects corporate brand image and consequently it would also modify the perceived image of all private labels including PPL. This relationship would be more intense when the name of retailer brand is included in the name of the PPL.
In this sense, consumers increasingly turn to social network sites to obtain information to take decisions (Kozinets, 2002). Therefore, social networks have transformed the shopping experience of consumers, influencing purchasing intentions (Pookulangara & Koesler, 2011). In this sense, the E-WOM is the fundamental factor on which researchers base to verify the influence that social networks exert on purchasing decisions (Bataineh, 2015; López & Sicilia, 2014; Yoon, 2012). Since, according to the Signaling Theory, the buyer and the seller have access to different information on many occasions. Hence, the buyer tries to interpret the communication that the seller wants to provide complementing it with social networks where the user's previous experience is essential (Connelly, Certo, Ireland, & Reutzel, 2011; Mumi, Obal, & Yang, 2019). Finally, all of the above is supported by the Herding Theory, according to this theory users seek to follow the group's behavior and therefore they get through social networks (Baddeley, Pillas, Christopoulos, Schultz, & Tobler, 2007).
Therefore, social networks are of great importance both for the users and for the retailer firms which commercialize distributor brands (Borgaonkar, 2020). Although they have different aims, they comprise a common initiative, which is to maintain existing social links or form new connections between users and retailers (Boyd & Ellison, 2008; Ellison, Steinfield, & Lampe, 2007). From all of this, we conclude that brands frequently use social networks as one more instrument of their communication strategy for both manufacturers' brands and distributor brands. And, thereafter, foster their variant of PPL, increase the trust that the consumers have in them and influence their shopping intentions (Hajli, 2014). Based on this discussion, we make the following proposition:P4 The brand image of retail establishments in social networks influences the perceived image of PPL in these networks.
There have been various investigations developed about PPL which are based on the study of factors such as price, perceived quality, extent of the range, etc. (Partal & Benito, 2014; Geyskens 2010; Kethüda, 2020). Nevertheless, there is a gap with respect to the average visits which take place in the retail establishments by consumers who purchase PPL.
Average visits are defined as the frequency with which a consumer goes to the establishment with the intention of buying a specific product (Martínez-Ruiz, Jiménez-Zarco, & Izquierdo-Yusta, 2010). Given that the buying of both Premium and standard distributor brands generally entails higher levels of functional risk than the those of manufacturers' brands (Richardson, Jain, & Dick, 1996; Zielke & Dobbelstein, 2007), consumers tend to prefer the latter for the categories of products with a high social or functional risk. Although with each purchase and visit to the shop they become more familiar with the distributor brand's labels (Fischer, Völckner, & Sattler, 2010; Semeijn, Van Riel, & Ambrosini, 2004). The aforementioned is our basis for formulating the following proposition: P5 The average number of visits to the establishment influences the value of its PPL
The ways in which people speak and write facilitate the comprehension of their emotional and cognitive facet. During the last three decades, researchers have furnished proofs which indicate that emotional states toward products or brands can be deduced by, for example, the words that they use (Stiles, 1992).
What has been commented upon before can be linked to 2.0 technology and to its dynamic area, social networks. According to Rissoan (2013), social networks are a means of communication which favor social interactions and in which technology and the creation of content intervene. The latter implies that the potential consumer becomes the author of the information, publicly or privately, and without any geographical limit. The new information and communication technologies enable the creating and publishing of this content easily, quickly and in significant volumes, making social interaction possible as a result of the reactions of each human being (Rissoan, 2013).
It is important to know what consumers say about this technology and how it influences them. With this aim, we will use a method for the study of the different emotional and cognitive states. Tools such as Sentiment140 and LIWC develop a text analysis application. Sentiment140's algorithms are designed to analyze the written text on a word basis, to calculate the percentages of words in the text which coincide with the dimensions of the language. These algorithms generate the outcome as a result of identifying the negative, neutral or positive feelings which users of the social platform Twitter have about a specific product or a brand. The Sentiment140 method is a web application which classifies the tweets according to their polarity. The evaluation is carried out using the remote monitoring approach proposed by Go, Bhayani, and Huang (2009)). This is based on monitored learning procedures and is tackled by using positive, negative and neutral feelings.
The messages of Twitter have a maximum length of 140 characters and thanks to Twitter's API millions of tweets can be collected to know users' feelings. The approach of Sentiment140 enables the use of different classifiers of automatic learning and characteristic extractors. The classifiers of automatic learning are Naive Bayes, maximum entropy (MaxEnt), and Support Vector Machines (SVM). Not only do they use emotions, as if we analyze them there is a negative impact on the precision of the MAXENT and SVM classifiers. The difference lies in the mathematical models and the selection of weight of the MaxEnt and SVM function. Therefore, and excluding emoticons, the classifier can learn from other characteristics (for example, Unigrams and Bigramas) present in the tweet.
With the help of the tool described, we proceeded to compile a database of the feelings which Twitter users transmit about the perceived image, both of the PPL and the global image of the establishment from 01/01/2015 till 31/12/2015, regarding some of the main retailers of the food sector in Spain (Nielsen, 2015) according to sales volume, such as Mercadona, Lidl, Carrefour and DIA.
Consistent with the retailer's concern for endowing their own brands with a better quality (Hoch & Banerji, 1993), the Premium Private Labels of the distributors selected were incorporated into the market segmentation of the distributor brands (Dunne & Narasimhan, 1999). Thus, the three distributor brands analyzed are Delicious (DIA), Deluxe (Lidl) and Carrefour Selección (Carrefour). These criteria were established based on the sales volume of the main brand or brands of the distributor and the sales volume of its main PPL (Nielsen 2015).
We hence compiled all the tweets of the monthly consumers of these retailers to check their feelings when buying products of the PPL and of the standard distributor brand. Along with this, and due to everything that has been described, we established a follow- up of the number of followers during the year 2015. Once we knew the place of these brands in the consumer's minds and what they comment about them on social networks, we undertook the adding of information through the compiling of data via personal surveys.
A questionnaire was worked out (see Table A1) with a view to analyzing the propositions formulated. The different questions were adapted from scales validated by different authors (Yoo & Donthu, 2001; Delgado-Ballester, Hernandez-Espallardo, & Rodriguez-Orejuela, 2014). The scales corresponding to the image of the establishment, functional risk, financial risk, social risk, psychological risk and awareness value were validated by Delgado-Ballester et al. (2014) and those corresponding to the brand value by Yoo and Donthu (2001). A pre-test of 10 surveys was carried out for each of the 3 retail distributors (DIA, Carrefour, Lidl) selecting users of different ages and genders to test the questionnaire.
Description of the ANOVA model, perceived quality.
| N | Mean | Typical deviation | Typical error | 95% of the confidence interval for the mean | |||
|---|---|---|---|---|---|---|---|
| Lower Limit | Upper Limit | ||||||
| 25 | CARREFOUR | 200 | 3.010 | .9078 | .0642 | 2.883 | 3.137 |
| DIA | 200 | 2.990 | .9563 | .0676 | 2.857 | 3.123 | |
| LIDL | 200 | 2.725 | 1.0559 | .0747 | 2.578 | 2.872 | |
| Total | 600 | 2.908 | .9823 | .0401 | 2.830 | 2.987 | |
| 26 | CARREFOUR | 200 | 2.765 | .8266 | .0584 | 2.650 | 2.880 |
| DIA | 200 | 2.780 | .8976 | .0635 | 2.655 | 2.905 | |
| LIDL | 200 | 2.570 | .9746 | .0689 | 2.434 | 2.706 | |
| Total | 600 | 2.705 | .9052 | .0370 | 2.632 | 2.778 | |
| 27 | CARREFOUR | 200 | 2.845 | .8393 | .0594 | 2.728 | 2.962 |
| DIA | 200 | 2.815 | .8744 | .0618 | 2.693 | 2.937 | |
| LIDL | 200 | 2.580 | .9687 | .0685 | 2.445 | 2.715 | |
| Total | 600 | 2.747 | .9021 | .0368 | 2.674 | 2.819 | |
| 28 | CARREFOUR | 200 | 2.555 | .7549 | .0534 | 2.450 | 2.660 |
| DIA | 200 | 2.505 | .7894 | .0558 | 2.395 | 2.615 | |
| LIDL | 200 | 2.245 | .8768 | .0620 | 2.123 | 2.367 | |
| Total | 600 | 2.435 | .8187 | .0334 | 2.369 | 2.501 | |
| 29 | CARREFOUR | 200 | 2.505 | .7159 | .0506 | 2.405 | 2.605 |
| DIA | 200 | 2.420 | .7459 | .0527 | 2.316 | 2.524 | |
| LIDL | 200 | 2.185 | .8628 | .0610 | 2.065 | 2.305 | |
| Total | 600 | 2.370 | .7879 | .0322 | 2.307 | 2.433 | |
| 30 | CARREFOUR | 200 | 2.605 | .7759 | .0549 | 2.497 | 2.713 |
| DIA | 200 | 2.725 | .9401 | .0665 | 2.594 | 2.856 | |
| LIDL | 200 | 2.405 | .9028 | .0638 | 2.279 | 2.531 | |
| Total | 600 | 2.578 | .8842 | .0361 | 2.507 | 2.649 | |
| 31 | CARREFOUR | 200 | 2.450 | 1.1242 | .0795 | 2.293 | 2.607 |
| DIA | 200 | 2.350 | 1.0925 | .0772 | 2.198 | 2.502 | |
| LIDL | 200 | 2.260 | 1.1528 | .0815 | 2.099 | 2.421 | |
| Total | 600 | 2.353 | 1.1242 | .0459 | 2.263 | 2.443 | |
| 32 | CARREFOUR | 200 | 2.120 | .8829 | .0624 | 1.997 | 2.243 |
| DIA | 200 | 1.970 | .7888 | .0558 | 1.860 | 2.080 | |
| LIDL | 200 | 1.910 | .8865 | .0627 | 1.786 | 2.034 | |
| Total | 600 | 2.000 | .8571 | .0350 | 1.931 | 2.069 | |
| 33 | CARREFOUR | 200 | 2.220 | .9466 | .0669 | 2.088 | 2.352 |
| DIA | 200 | 1.980 | .7955 | .0562 | 1.869 | 2.091 | |
| LIDL | 200 | 2.035 | .9425 | .0666 | 1.904 | 2.166 | |
| Total | 600 | 2.078 | .9020 | .0368 | 2.006 | 2.151 | |
| 34 | CARREFOUR | 200 | 1.895 | .7791 | .0551 | 1.786 | 2.004 |
| DIA | 200 | 1.800 | .7229 | .0511 | 1.699 | 1.901 | |
| LIDL | 200 | 1.675 | .7363 | .0521 | 1.572 | 1.778 | |
| Total | 600 | 1.790 | .7507 | .0306 | 1.730 | 1.850 | |
| 35 | CARREFOUR | 200 | 2.030 | .8849 | .0626 | 1.907 | 2.153 |
| DIA | 200 | 1.870 | .7655 | .0541 | 1.763 | 1.977 | |
| LIDL | 200 | 1.760 | .8402 | .0594 | 1.643 | 1.877 | |
| Total | 600 | 1.887 | .8377 | .0342 | 1.820 | 1.954 | |
| 36 | CARREFOUR | 200 | 2.425 | .9997 | .0707 | 2.286 | 2.564 |
| DIA | 200 | 2.425 | 1.0343 | .0731 | 2.281 | 2.569 | |
| LIDL | 200 | 2.155 | 1.0375 | .0734 | 2.010 | 2.300 | |
| Total | 600 | 2.335 | 1.0302 | .0421 | 2.252 | 2.418 | |
A non-random sampling method was done, the population studied being customers over 18 years old of the nine establishments analyzed: three of DIA, three of Carrefour and three of Lidl, all in the south of Spain. The interviewers were trained in different sessions in the technique of administering the questionnaire to the individual respondents. The interviewing took place in July 2016. This resulted in a total of 614 questionnaires, 14 of which had to be removed due to being incorrectly filled out. The division of the valid questionnaires between establishments was equitable; that is to say, 200 respondents customers of DIA, 200 customers of Lidl and 200 of Carrefour.
The sample we worked with was therefore made up of 600 people of which 61.2% were women and 38.8 % men. The ages were distributed as follows: 20% between 18 and 35 years old, 33.5% between 36 and 45, 26% between 46 and 55, 14.8% between 56 and 65, and 5.7% over 65. With respect to their marital status, 51.8% were married, 30.3 % single, 11.5% were divorced and 6.3% were widows or widowers.
We thus had a study based on personal surveys carried out directly with the end customer in the sales point. From this, we could establish comparisons with what consumers voiced in Twitter, as this is a social network where firms officially project their brand image and in which consumers have primary information about them.
Different statistical techniques have been applied in this study with the aid of version 23 of the IBMSPSS software, such as temporal series analysis, ANOVA, the DMS, Bonferroni and Tamhane tests, the Kolmogorov-Smirnov statistic, the Mann-Whitney procedure to verify if the two independent samples have been extracted from populations with the same variance and, finally, the T test.
ResultsFirst we analyzed the reliability of the scales used in each of the constructs as well as their dimensions. According to George and Mallery (1995), reliability is related to the fact of the measuring instrument producing the same results each time it is run with the same person in the same circumstances. The instruments used in social sciences are considered reliable if, irrespective of who runs them and the way in which this is done, similar results are obtained. In this research we used Cronbach's alpha, an indicator widely used for this analysis.
According to George and Mallery (1995), a Cronbach's alpha above 0.7 can be considered an acceptable level. In our study we have obtained for the brand equity scale a Cronbach's alpha of 0.847, for the brand value 0.94, for the functional risk 0.942, for the financial risk 0.987, for the social risk 0.917, for the psychological risk 0.842 and, lastly, for the perceived quality scale 0.909. It can therefore be concluded that all the scales used are reliable.
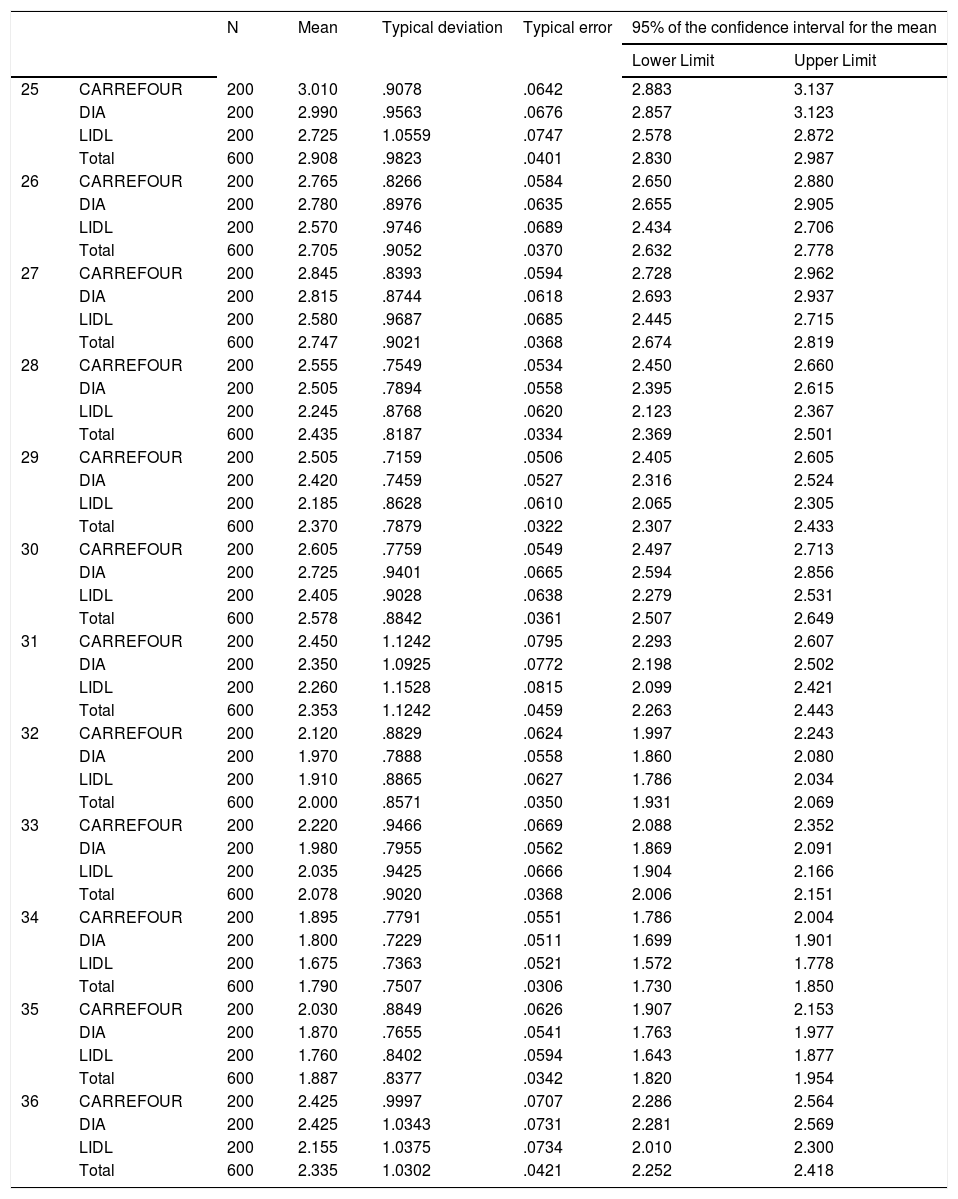
In the first analysis we took as a source the data obtained from the surveys. To check Proposition 1a (the perceived quality of PPL with respect to the brand leader varies among the main distributors), we applied an ANOVA analysis (see Table A1) using as dependent variables the questions of the perceived quality scale about the manufacturer's brand and the three PPL analyzed (Deluxe, Carrefour Selección and Delicious).
According to the ANOVA, there are significant differences in all the variables except in number 31. That is to say, buying the PPL instead of the brand leader can negatively affect what others think of me. This fits in social risk and, within that, in the perceived quality with respect to the 3 chains. These results are also confirmed with the non-parametric Kruskal-Wallis test for independent samples. On the other hand, according to the post hoc tests of Bonferroni and Tamhane, it is noted that the respondents who consume the PPL of Lidl (Deluxe) offer significantly lower average values for these variables than for Carrefour Selección and Delicious, except for variable 33 (buying the PPL instead of the brand leader can make others see me in a way I don't want) where Delicious shows the lowest results.
Deluxe is better valued than the Premium of Carrefour and DIA. Due to the values of the variables of the scale being lower and that the scale is reversed, we conclude that the perceived quality with respect to the brand leader of Deluxe is above Carrefour Selección and Delicious. There is therefore not enough evidence to reject Proposition P1a.
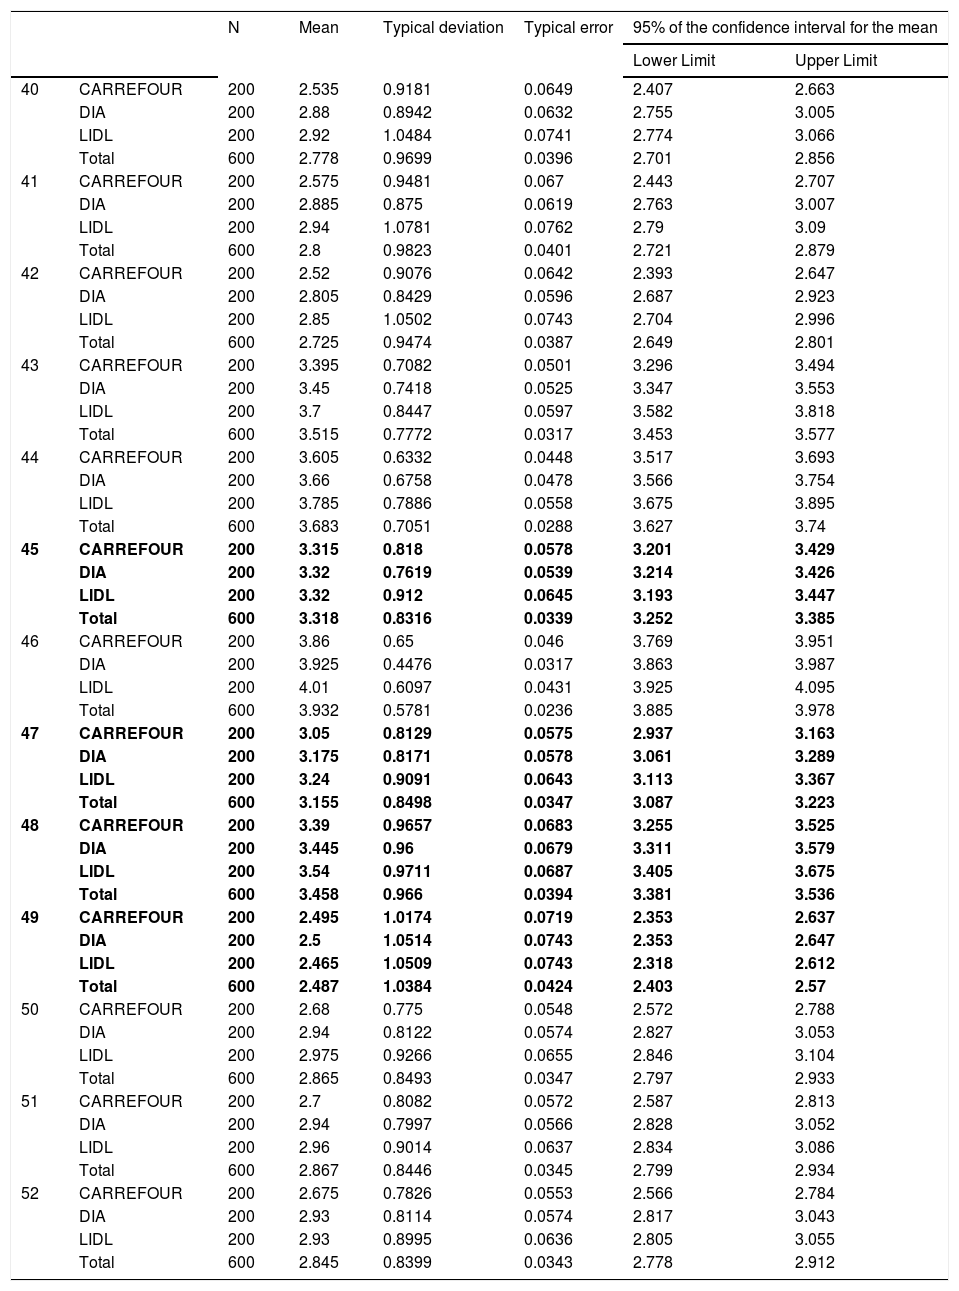
Taking into account the contributions of Aaker (1996) and of Keller (1993) about brand equity, we determine that to verify Proposition P1b (there are significant differences between the brand values for different PPL) an ANOVA is also applied (see Table A2). The result is that there are significant differences between the brand values for the 3 PP L.
Description of the ANOVA model, brand value.
| N | Mean | Typical deviation | Typical error | 95% of the confidence interval for the mean | |||
|---|---|---|---|---|---|---|---|
| Lower Limit | Upper Limit | ||||||
| 40 | CARREFOUR | 200 | 2.535 | 0.9181 | 0.0649 | 2.407 | 2.663 |
| DIA | 200 | 2.88 | 0.8942 | 0.0632 | 2.755 | 3.005 | |
| LIDL | 200 | 2.92 | 1.0484 | 0.0741 | 2.774 | 3.066 | |
| Total | 600 | 2.778 | 0.9699 | 0.0396 | 2.701 | 2.856 | |
| 41 | CARREFOUR | 200 | 2.575 | 0.9481 | 0.067 | 2.443 | 2.707 |
| DIA | 200 | 2.885 | 0.875 | 0.0619 | 2.763 | 3.007 | |
| LIDL | 200 | 2.94 | 1.0781 | 0.0762 | 2.79 | 3.09 | |
| Total | 600 | 2.8 | 0.9823 | 0.0401 | 2.721 | 2.879 | |
| 42 | CARREFOUR | 200 | 2.52 | 0.9076 | 0.0642 | 2.393 | 2.647 |
| DIA | 200 | 2.805 | 0.8429 | 0.0596 | 2.687 | 2.923 | |
| LIDL | 200 | 2.85 | 1.0502 | 0.0743 | 2.704 | 2.996 | |
| Total | 600 | 2.725 | 0.9474 | 0.0387 | 2.649 | 2.801 | |
| 43 | CARREFOUR | 200 | 3.395 | 0.7082 | 0.0501 | 3.296 | 3.494 |
| DIA | 200 | 3.45 | 0.7418 | 0.0525 | 3.347 | 3.553 | |
| LIDL | 200 | 3.7 | 0.8447 | 0.0597 | 3.582 | 3.818 | |
| Total | 600 | 3.515 | 0.7772 | 0.0317 | 3.453 | 3.577 | |
| 44 | CARREFOUR | 200 | 3.605 | 0.6332 | 0.0448 | 3.517 | 3.693 |
| DIA | 200 | 3.66 | 0.6758 | 0.0478 | 3.566 | 3.754 | |
| LIDL | 200 | 3.785 | 0.7886 | 0.0558 | 3.675 | 3.895 | |
| Total | 600 | 3.683 | 0.7051 | 0.0288 | 3.627 | 3.74 | |
| 45 | CARREFOUR | 200 | 3.315 | 0.818 | 0.0578 | 3.201 | 3.429 |
| DIA | 200 | 3.32 | 0.7619 | 0.0539 | 3.214 | 3.426 | |
| LIDL | 200 | 3.32 | 0.912 | 0.0645 | 3.193 | 3.447 | |
| Total | 600 | 3.318 | 0.8316 | 0.0339 | 3.252 | 3.385 | |
| 46 | CARREFOUR | 200 | 3.86 | 0.65 | 0.046 | 3.769 | 3.951 |
| DIA | 200 | 3.925 | 0.4476 | 0.0317 | 3.863 | 3.987 | |
| LIDL | 200 | 4.01 | 0.6097 | 0.0431 | 3.925 | 4.095 | |
| Total | 600 | 3.932 | 0.5781 | 0.0236 | 3.885 | 3.978 | |
| 47 | CARREFOUR | 200 | 3.05 | 0.8129 | 0.0575 | 2.937 | 3.163 |
| DIA | 200 | 3.175 | 0.8171 | 0.0578 | 3.061 | 3.289 | |
| LIDL | 200 | 3.24 | 0.9091 | 0.0643 | 3.113 | 3.367 | |
| Total | 600 | 3.155 | 0.8498 | 0.0347 | 3.087 | 3.223 | |
| 48 | CARREFOUR | 200 | 3.39 | 0.9657 | 0.0683 | 3.255 | 3.525 |
| DIA | 200 | 3.445 | 0.96 | 0.0679 | 3.311 | 3.579 | |
| LIDL | 200 | 3.54 | 0.9711 | 0.0687 | 3.405 | 3.675 | |
| Total | 600 | 3.458 | 0.966 | 0.0394 | 3.381 | 3.536 | |
| 49 | CARREFOUR | 200 | 2.495 | 1.0174 | 0.0719 | 2.353 | 2.637 |
| DIA | 200 | 2.5 | 1.0514 | 0.0743 | 2.353 | 2.647 | |
| LIDL | 200 | 2.465 | 1.0509 | 0.0743 | 2.318 | 2.612 | |
| Total | 600 | 2.487 | 1.0384 | 0.0424 | 2.403 | 2.57 | |
| 50 | CARREFOUR | 200 | 2.68 | 0.775 | 0.0548 | 2.572 | 2.788 |
| DIA | 200 | 2.94 | 0.8122 | 0.0574 | 2.827 | 3.053 | |
| LIDL | 200 | 2.975 | 0.9266 | 0.0655 | 2.846 | 3.104 | |
| Total | 600 | 2.865 | 0.8493 | 0.0347 | 2.797 | 2.933 | |
| 51 | CARREFOUR | 200 | 2.7 | 0.8082 | 0.0572 | 2.587 | 2.813 |
| DIA | 200 | 2.94 | 0.7997 | 0.0566 | 2.828 | 3.052 | |
| LIDL | 200 | 2.96 | 0.9014 | 0.0637 | 2.834 | 3.086 | |
| Total | 600 | 2.867 | 0.8446 | 0.0345 | 2.799 | 2.934 | |
| 52 | CARREFOUR | 200 | 2.675 | 0.7826 | 0.0553 | 2.566 | 2.784 |
| DIA | 200 | 2.93 | 0.8114 | 0.0574 | 2.817 | 3.043 | |
| LIDL | 200 | 2.93 | 0.8995 | 0.0636 | 2.805 | 3.055 | |
| Total | 600 | 2.845 | 0.8399 | 0.0343 | 2.778 | 2.912 | |
With the one-way ANOVA, the differences of the average values of the variables of the scale are significantly different for all the brand value scale items except 45 (I can recognize the PPL from among the competitors), 47 (some characteristics of the PPL come quickly to mind), 48 (I can quickly remember the symbol or logo of the PPL) and 49 (I have trouble imagining the PPL). The previous results are corroborated by the non-parametric Mann-Whitney test of independent samples.
According to the results of the DMS, Bonferroni and Tamhane tests, in items 40 to 52 (which correspond to brand value), there are significant differences between Carrefour Selección and the other two brands, that is to say, Deluxe (Lidl) and Delicious (DIA). This takes place except in the variables 43 (the quality of the PLP is extremely high), 44 (the likelihood of the PPL being useful is very high), 46 (I know the PPL), 47 (some characteristics of the PPL come quickly to mind), and in 45 and 49 there are not significant differences, Carrefour's PPL generally having lower scores for the latent variable of the brand value.
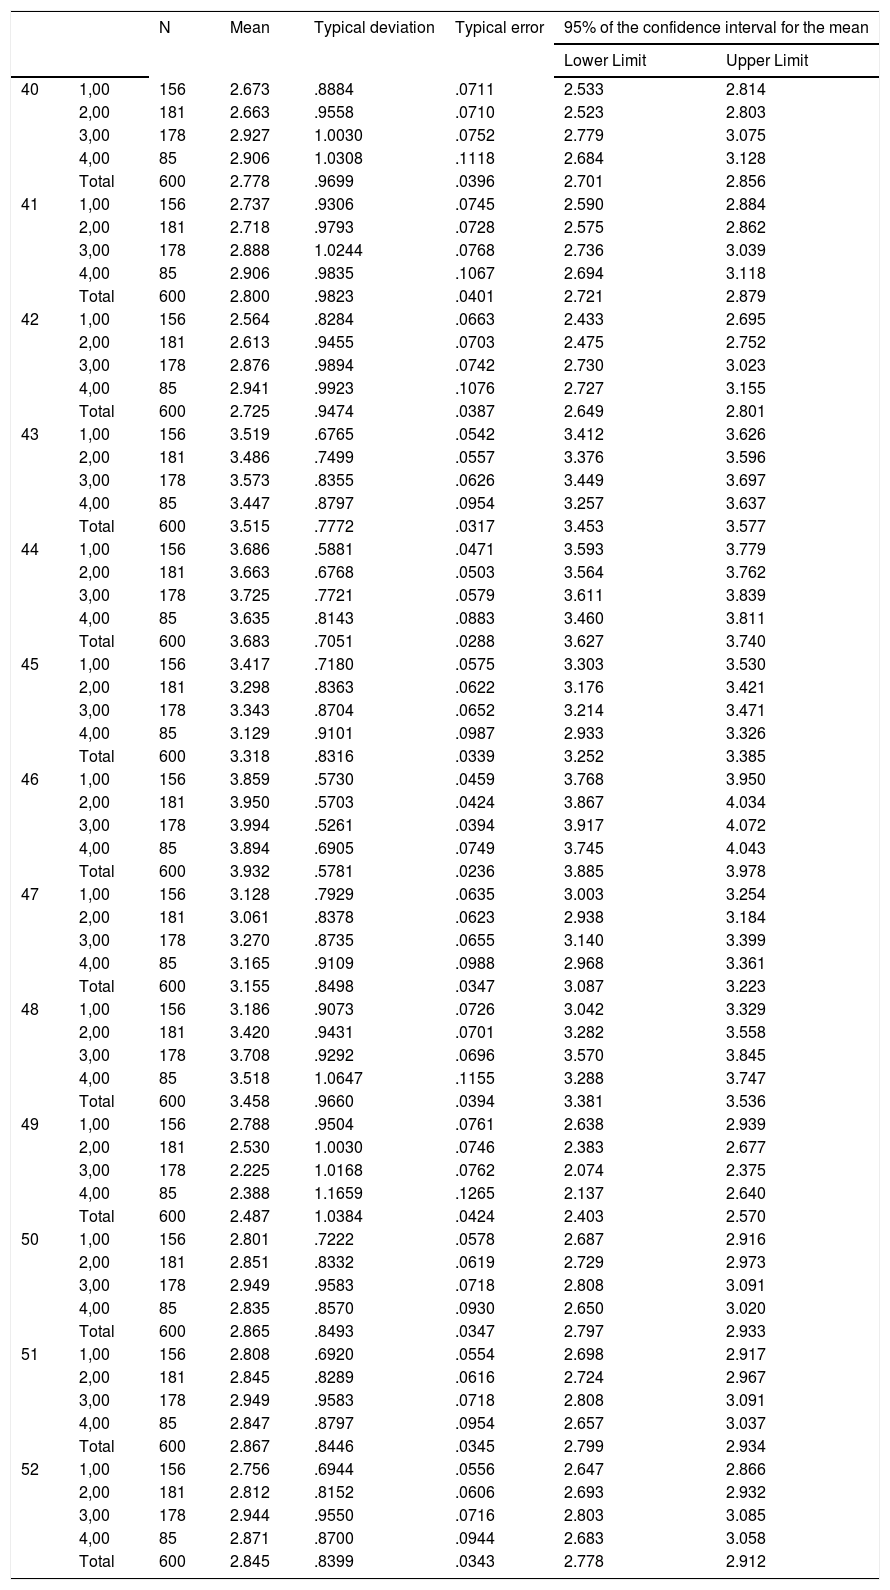
Regarding the perceived value (P2a “There is a positive relation between the perceived value of PPL and income levels”), linear and non-linear relations between the variables were sought. As the adjusted R2 is 0.006 P2a is rejected; that is to say, the relation between income levels and the perceived value of the PPL does not exist. Various non-linear adjustments were carried out (logarithmic, reverse, quadratic, cubic, composite, power, growth, exponential and logistical) and the results were confirmed in all of them.
As there was not a validation with the regression, we proceeded to carry out the ANOVA, dividing the incomes into intervals (see Table A3). To do so, we codified the income variables into 4 groups: less than 1,000 euros, between 1,001euros and 2,000 euros, from 2,001euros to 3,000 euros and over 3000 euros. With this variable there are partially significant results.
Description of the ANOVA model, incomes intervals.
| N | Mean | Typical deviation | Typical error | 95% of the confidence interval for the mean | |||
|---|---|---|---|---|---|---|---|
| Lower Limit | Upper Limit | ||||||
| 40 | 1,00 | 156 | 2.673 | .8884 | .0711 | 2.533 | 2.814 |
| 2,00 | 181 | 2.663 | .9558 | .0710 | 2.523 | 2.803 | |
| 3,00 | 178 | 2.927 | 1.0030 | .0752 | 2.779 | 3.075 | |
| 4,00 | 85 | 2.906 | 1.0308 | .1118 | 2.684 | 3.128 | |
| Total | 600 | 2.778 | .9699 | .0396 | 2.701 | 2.856 | |
| 41 | 1,00 | 156 | 2.737 | .9306 | .0745 | 2.590 | 2.884 |
| 2,00 | 181 | 2.718 | .9793 | .0728 | 2.575 | 2.862 | |
| 3,00 | 178 | 2.888 | 1.0244 | .0768 | 2.736 | 3.039 | |
| 4,00 | 85 | 2.906 | .9835 | .1067 | 2.694 | 3.118 | |
| Total | 600 | 2.800 | .9823 | .0401 | 2.721 | 2.879 | |
| 42 | 1,00 | 156 | 2.564 | .8284 | .0663 | 2.433 | 2.695 |
| 2,00 | 181 | 2.613 | .9455 | .0703 | 2.475 | 2.752 | |
| 3,00 | 178 | 2.876 | .9894 | .0742 | 2.730 | 3.023 | |
| 4,00 | 85 | 2.941 | .9923 | .1076 | 2.727 | 3.155 | |
| Total | 600 | 2.725 | .9474 | .0387 | 2.649 | 2.801 | |
| 43 | 1,00 | 156 | 3.519 | .6765 | .0542 | 3.412 | 3.626 |
| 2,00 | 181 | 3.486 | .7499 | .0557 | 3.376 | 3.596 | |
| 3,00 | 178 | 3.573 | .8355 | .0626 | 3.449 | 3.697 | |
| 4,00 | 85 | 3.447 | .8797 | .0954 | 3.257 | 3.637 | |
| Total | 600 | 3.515 | .7772 | .0317 | 3.453 | 3.577 | |
| 44 | 1,00 | 156 | 3.686 | .5881 | .0471 | 3.593 | 3.779 |
| 2,00 | 181 | 3.663 | .6768 | .0503 | 3.564 | 3.762 | |
| 3,00 | 178 | 3.725 | .7721 | .0579 | 3.611 | 3.839 | |
| 4,00 | 85 | 3.635 | .8143 | .0883 | 3.460 | 3.811 | |
| Total | 600 | 3.683 | .7051 | .0288 | 3.627 | 3.740 | |
| 45 | 1,00 | 156 | 3.417 | .7180 | .0575 | 3.303 | 3.530 |
| 2,00 | 181 | 3.298 | .8363 | .0622 | 3.176 | 3.421 | |
| 3,00 | 178 | 3.343 | .8704 | .0652 | 3.214 | 3.471 | |
| 4,00 | 85 | 3.129 | .9101 | .0987 | 2.933 | 3.326 | |
| Total | 600 | 3.318 | .8316 | .0339 | 3.252 | 3.385 | |
| 46 | 1,00 | 156 | 3.859 | .5730 | .0459 | 3.768 | 3.950 |
| 2,00 | 181 | 3.950 | .5703 | .0424 | 3.867 | 4.034 | |
| 3,00 | 178 | 3.994 | .5261 | .0394 | 3.917 | 4.072 | |
| 4,00 | 85 | 3.894 | .6905 | .0749 | 3.745 | 4.043 | |
| Total | 600 | 3.932 | .5781 | .0236 | 3.885 | 3.978 | |
| 47 | 1,00 | 156 | 3.128 | .7929 | .0635 | 3.003 | 3.254 |
| 2,00 | 181 | 3.061 | .8378 | .0623 | 2.938 | 3.184 | |
| 3,00 | 178 | 3.270 | .8735 | .0655 | 3.140 | 3.399 | |
| 4,00 | 85 | 3.165 | .9109 | .0988 | 2.968 | 3.361 | |
| Total | 600 | 3.155 | .8498 | .0347 | 3.087 | 3.223 | |
| 48 | 1,00 | 156 | 3.186 | .9073 | .0726 | 3.042 | 3.329 |
| 2,00 | 181 | 3.420 | .9431 | .0701 | 3.282 | 3.558 | |
| 3,00 | 178 | 3.708 | .9292 | .0696 | 3.570 | 3.845 | |
| 4,00 | 85 | 3.518 | 1.0647 | .1155 | 3.288 | 3.747 | |
| Total | 600 | 3.458 | .9660 | .0394 | 3.381 | 3.536 | |
| 49 | 1,00 | 156 | 2.788 | .9504 | .0761 | 2.638 | 2.939 |
| 2,00 | 181 | 2.530 | 1.0030 | .0746 | 2.383 | 2.677 | |
| 3,00 | 178 | 2.225 | 1.0168 | .0762 | 2.074 | 2.375 | |
| 4,00 | 85 | 2.388 | 1.1659 | .1265 | 2.137 | 2.640 | |
| Total | 600 | 2.487 | 1.0384 | .0424 | 2.403 | 2.570 | |
| 50 | 1,00 | 156 | 2.801 | .7222 | .0578 | 2.687 | 2.916 |
| 2,00 | 181 | 2.851 | .8332 | .0619 | 2.729 | 2.973 | |
| 3,00 | 178 | 2.949 | .9583 | .0718 | 2.808 | 3.091 | |
| 4,00 | 85 | 2.835 | .8570 | .0930 | 2.650 | 3.020 | |
| Total | 600 | 2.865 | .8493 | .0347 | 2.797 | 2.933 | |
| 51 | 1,00 | 156 | 2.808 | .6920 | .0554 | 2.698 | 2.917 |
| 2,00 | 181 | 2.845 | .8289 | .0616 | 2.724 | 2.967 | |
| 3,00 | 178 | 2.949 | .9583 | .0718 | 2.808 | 3.091 | |
| 4,00 | 85 | 2.847 | .8797 | .0954 | 2.657 | 3.037 | |
| Total | 600 | 2.867 | .8446 | .0345 | 2.799 | 2.934 | |
| 52 | 1,00 | 156 | 2.756 | .6944 | .0556 | 2.647 | 2.866 |
| 2,00 | 181 | 2.812 | .8152 | .0606 | 2.693 | 2.932 | |
| 3,00 | 178 | 2.944 | .9550 | .0716 | 2.803 | 3.085 | |
| 4,00 | 85 | 2.871 | .8700 | .0944 | 2.683 | 3.058 | |
| Total | 600 | 2.845 | .8399 | .0343 | 2.778 | 2.912 | |
From the one-way ANOVA results, there are signs that the users who earn more value the PPL more than those who earn less for some of the scale's variables, specifically for variables 40 (I consider I'm loyal to the PPL), 42 (I'm not going to buy other brands if the PPL is available in the shop), 48 (I can quickly remember the symbol or logo of the PPL) and 49 (I have trouble imagining the PPL), but they are not determinant as the same does not take place for the rest of the items of the scale.
Subsequently, we are going to study the degree of income levels and the brand equity of the buyers of the PPL to determine if Proposition P2b (There is no relation between the income level and the awareness value of the buyers of PPL) is accepted, again through linear regression analysis. As the R2 is 0.007, P2b is rejected. Therefore, the linear relation between the income level and the perceived value of the PPL does not exist. As before, we carried out other non-linear adjustments, such as logarithmic, reverse, quadratic, cubic, composite, power, growth, exponential and logistical, and the same results were confirmed in all of them.
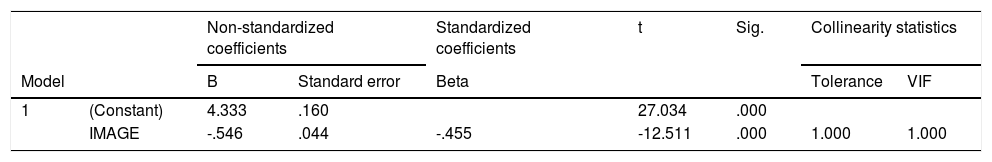
Recent works have studied perceived quality in different areas. However, very few works have been published relating this with PPL (Grunert & Aachmann, 2016). In Table 1 we investigate if the chain's image positively influences its PPL's perceived quality in order to verify P3. Linear regression analysis is again done and is shown in the following table.
The adjusted linear correlation coefficient is 0.207, a low value. Furthermore, the image variable has a significant effect on the perceived quality, but the variable's coefficient in the regression equation is negative: -0.455. Hence there is a negative relation with a low correlation. Due to this, we determine that Proposition 3 is rejected.
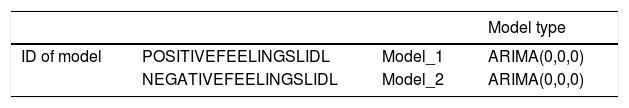
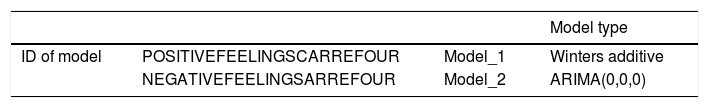
Given the importance of social networks, as has been seen in the literature review, in Tables 2, 3 and 4 we study the retail establishments' brand image in social networks, checking if it influences these networks' perceived image of the PPL (Proposition P4). This is done for the three brands. SPSSIBM's expert modeler, has been applied. This aims to identify and automatically estimate the ARIMA model or the exponential smoothing model which fits best for one or more of the destination variables, thus removing the necessity of identifying an appropriate model via the trial and error system.
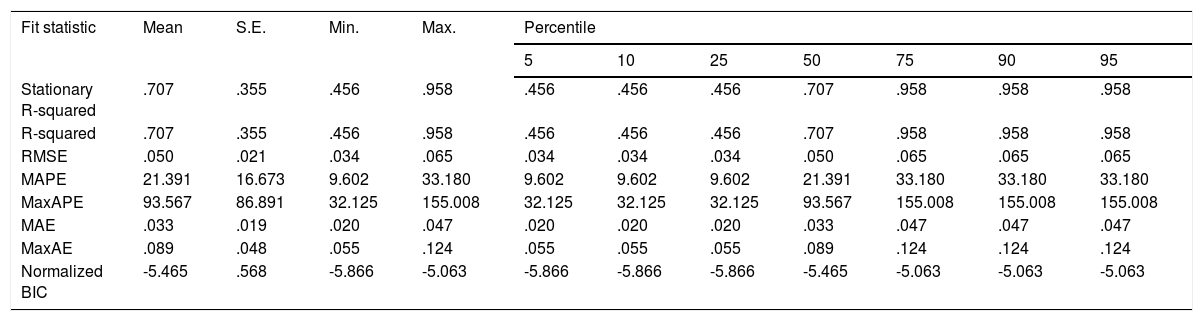
Fit of the model, social network feelings, LIDL.
| Fit statistic | Mean | S.E. | Min. | Max. | Percentile | ||||||
|---|---|---|---|---|---|---|---|---|---|---|---|
| 5 | 10 | 25 | 50 | 75 | 90 | 95 | |||||
| Stationary R-squared | .707 | .355 | .456 | .958 | .456 | .456 | .456 | .707 | .958 | .958 | .958 |
| R-squared | .707 | .355 | .456 | .958 | .456 | .456 | .456 | .707 | .958 | .958 | .958 |
| RMSE | .050 | .021 | .034 | .065 | .034 | .034 | .034 | .050 | .065 | .065 | .065 |
| MAPE | 21.391 | 16.673 | 9.602 | 33.180 | 9.602 | 9.602 | 9.602 | 21.391 | 33.180 | 33.180 | 33.180 |
| MaxAPE | 93.567 | 86.891 | 32.125 | 155.008 | 32.125 | 32.125 | 32.125 | 93.567 | 155.008 | 155.008 | 155.008 |
| MAE | .033 | .019 | .020 | .047 | .020 | .020 | .020 | .033 | .047 | .047 | .047 |
| MaxAE | .089 | .048 | .055 | .124 | .055 | .055 | .055 | .089 | .124 | .124 | .124 |
| Normalized BIC | -5.465 | .568 | -5.866 | -5.063 | -5.866 | -5.866 | -5.866 | -5.465 | -5.063 | -5.063 | -5.063 |
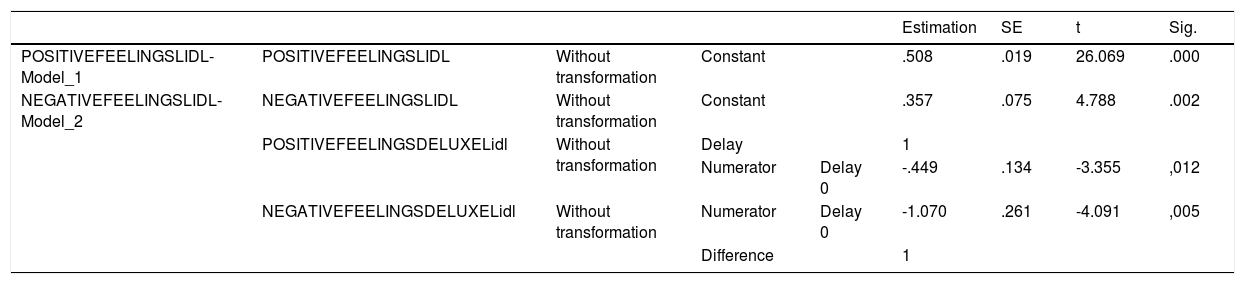
Parameters of the ARIMA model, social network, Lidl.
| Estimation | SE | t | Sig. | |||||
|---|---|---|---|---|---|---|---|---|
| POSITIVEFEELINGSLIDL-Model_1 | POSITIVEFEELINGSLIDL | Without transformation | Constant | .508 | .019 | 26.069 | .000 | |
| NEGATIVEFEELINGSLIDL-Model_2 | NEGATIVEFEELINGSLIDL | Without transformation | Constant | .357 | .075 | 4.788 | .002 | |
| POSITIVEFEELINGSDELUXELidl | Without transformation | Delay | 1 | |||||
| Numerator | Delay 0 | -.449 | .134 | -3.355 | ,012 | |||
| NEGATIVEFEELINGSDELUXELidl | Without transformation | Numerator | Delay 0 | -1.070 | .261 | -4.091 | ,005 | |
| Difference | 1 | |||||||
Firstly, we analyze the influence of Lidl's brand image on its PPL, again from the data collected in Twitter. It is determined in this study that the greater the positive feeling of the Deluxe brand, the lower the negative feeling about Lidl. Also, the greater the negative feeling of Deluxe, the less negative feelings about Lidl. This was established by the predictor of Model 2 (negative feelings), which we have ascertained with an ARIMA model.
In Tables 5, 6 and 7 we analyze these same factors of Tables 2,3 and 4 for Carrefour and Carrefour Selección.
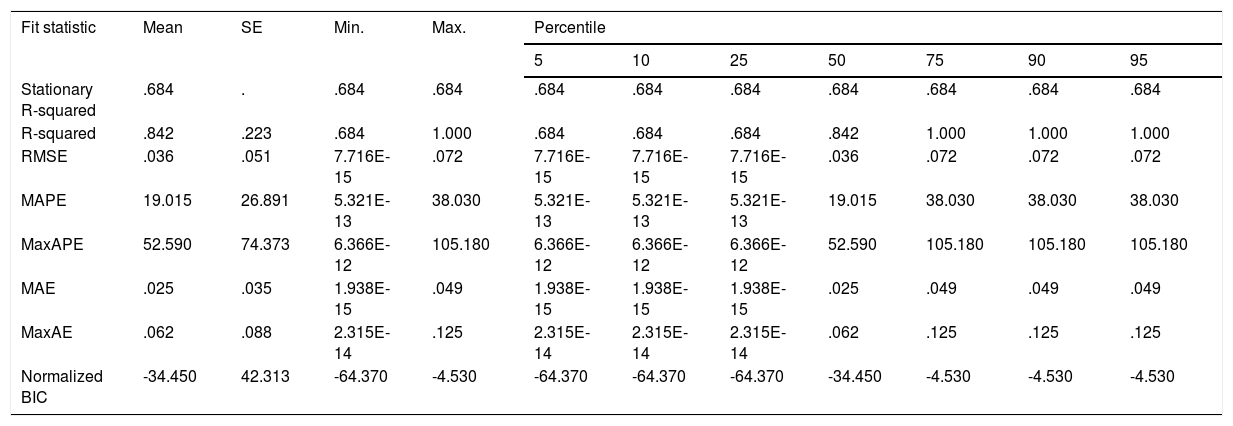
Fit of the model, social network feelings, Carrefour.
| Fit statistic | Mean | SE | Min. | Max. | Percentile | ||||||
|---|---|---|---|---|---|---|---|---|---|---|---|
| 5 | 10 | 25 | 50 | 75 | 90 | 95 | |||||
| Stationary R-squared | .684 | . | .684 | .684 | .684 | .684 | .684 | .684 | .684 | .684 | .684 |
| R-squared | .842 | .223 | .684 | 1.000 | .684 | .684 | .684 | .842 | 1.000 | 1.000 | 1.000 |
| RMSE | .036 | .051 | 7.716E-15 | .072 | 7.716E-15 | 7.716E-15 | 7.716E-15 | .036 | .072 | .072 | .072 |
| MAPE | 19.015 | 26.891 | 5.321E-13 | 38.030 | 5.321E-13 | 5.321E-13 | 5.321E-13 | 19.015 | 38.030 | 38.030 | 38.030 |
| MaxAPE | 52.590 | 74.373 | 6.366E-12 | 105.180 | 6.366E-12 | 6.366E-12 | 6.366E-12 | 52.590 | 105.180 | 105.180 | 105.180 |
| MAE | .025 | .035 | 1.938E-15 | .049 | 1.938E-15 | 1.938E-15 | 1.938E-15 | .025 | .049 | .049 | .049 |
| MaxAE | .062 | .088 | 2.315E-14 | .125 | 2.315E-14 | 2.315E-14 | 2.315E-14 | .062 | .125 | .125 | .125 |
| Normalized BIC | -34.450 | 42.313 | -64.370 | -4.530 | -64.370 | -64.370 | -64.370 | -34.450 | -4.530 | -4.530 | -4.530 |
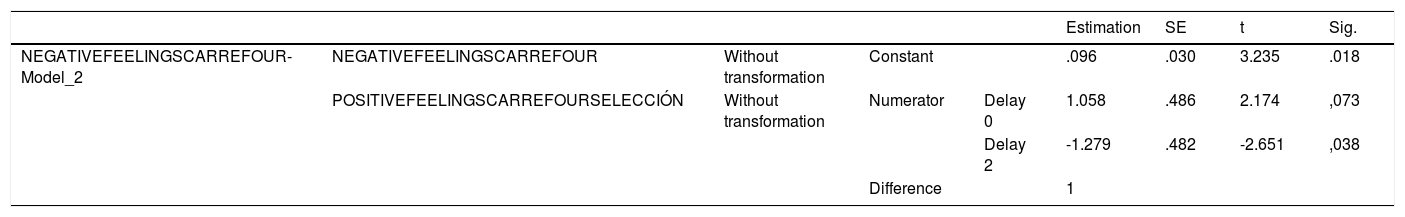
Fit of the model, social network feelings, Carrefour.
| Estimation | SE | t | Sig. | |||||
|---|---|---|---|---|---|---|---|---|
| NEGATIVEFEELINGSCARREFOUR-Model_2 | NEGATIVEFEELINGSCARREFOUR | Without transformation | Constant | .096 | .030 | 3.235 | .018 | |
| POSITIVEFEELINGSCARREFOURSELECCIÓN | Without transformation | Numerator | Delay 0 | 1.058 | .486 | 2.174 | ,073 | |
| Delay 2 | -1.279 | .482 | -2.651 | ,038 | ||||
| Difference | 1 | |||||||
It is noted that in the social networks, the greater the positive feelings about Carrefour selección, the lower are the negative feelings about Carrefour. This coincides with what we have investigated in Tables 2,3 and 4 for Lidl. But in this case Model 1 was calculated with the Winters additive model, the ARIMA model not having a predictor for positive feelings and studying negative feelings.
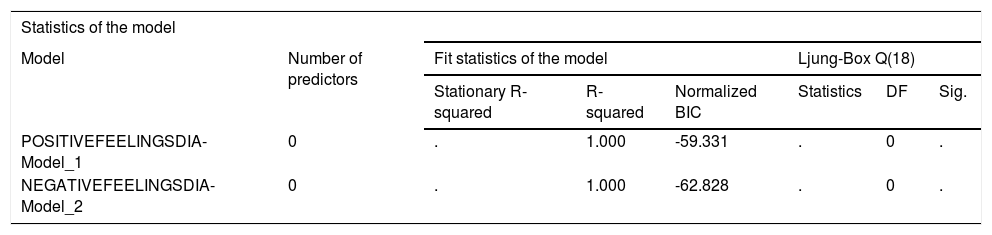
In Table 8 it is seen that in the relation between DIA and Delicious, both for Model 1 and for Model 2, and coinciding with positive and negative feelings in the social networks, the statistical system used suggests to us that it is advisable to study Model 1 with the Winter additive and Model 2 with the Winter multiplicative.
Statistics of the model, social network, DIA.
| Statistics of the model | |||||||
|---|---|---|---|---|---|---|---|
| Model | Number of predictors | Fit statistics of the model | Ljung-Box Q(18) | ||||
| Stationary R-squared | R-squared | Normalized BIC | Statistics | DF | Sig. | ||
| POSITIVEFEELINGSDIA-Model_1 | 0 | . | 1.000 | -59.331 | . | 0 | . |
| NEGATIVEFEELINGSDIA-Model_2 | 0 | . | 1.000 | -62.828 | . | 0 | . |
It is observed that there are not predictors for the Delicious brand. That is, there is no relation between the feelings of Delicious with DIA, this brand setting itself apart from the establishment's own image. One of the results which we can establish is the possibility that social networks users comment on Delicious without perceiving that this is DIA's PPL.
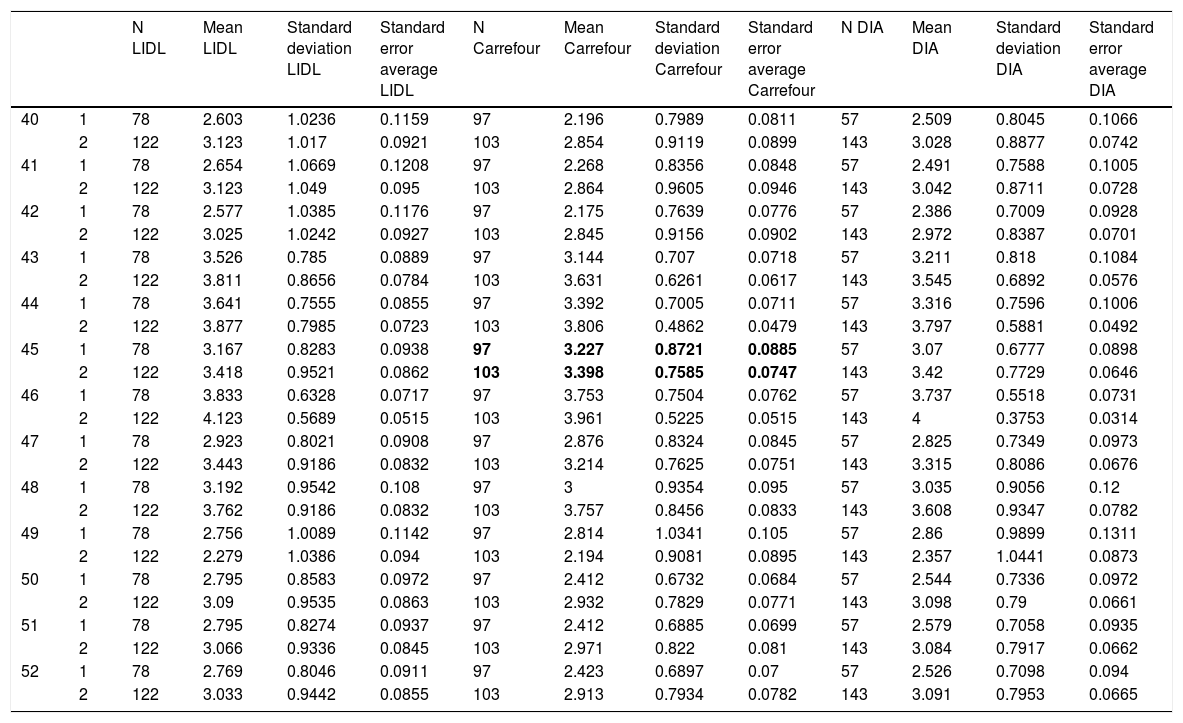
For the study of the average number of visits to the establishment in relation to its PPL, we have re-codified the variable into two groups: up to 2 visits per month to the retailer establishment or 3 times or more. To check P5 we have used various procedures. On the one hand, the Kolmogorov-Smirnov comparison. In this analysis, instead of studying the probabilities of different events, the values of the distribution functions are compared, both in the sample and what would technically be derived from the population which has been made explicit in the null hypothesis. On the other hand, we have checked with the Mann-Whitney procedure to verify if two independent samples have been extracted from populations with an equal variance, compared to the alternative hypothesis that they have been extracted from populations with different variations. Finally, we have centered on the T test (see Table A4).
T test, Lidl, Carrefour and DIA.
| N LIDL | Mean LIDL | Standard deviation LIDL | Standard error average LIDL | N Carrefour | Mean Carrefour | Standard deviation Carrefour | Standard error average Carrefour | N DIA | Mean DIA | Standard deviation DIA | Standard error average DIA | ||
|---|---|---|---|---|---|---|---|---|---|---|---|---|---|
| 40 | 1 | 78 | 2.603 | 1.0236 | 0.1159 | 97 | 2.196 | 0.7989 | 0.0811 | 57 | 2.509 | 0.8045 | 0.1066 |
| 2 | 122 | 3.123 | 1.017 | 0.0921 | 103 | 2.854 | 0.9119 | 0.0899 | 143 | 3.028 | 0.8877 | 0.0742 | |
| 41 | 1 | 78 | 2.654 | 1.0669 | 0.1208 | 97 | 2.268 | 0.8356 | 0.0848 | 57 | 2.491 | 0.7588 | 0.1005 |
| 2 | 122 | 3.123 | 1.049 | 0.095 | 103 | 2.864 | 0.9605 | 0.0946 | 143 | 3.042 | 0.8711 | 0.0728 | |
| 42 | 1 | 78 | 2.577 | 1.0385 | 0.1176 | 97 | 2.175 | 0.7639 | 0.0776 | 57 | 2.386 | 0.7009 | 0.0928 |
| 2 | 122 | 3.025 | 1.0242 | 0.0927 | 103 | 2.845 | 0.9156 | 0.0902 | 143 | 2.972 | 0.8387 | 0.0701 | |
| 43 | 1 | 78 | 3.526 | 0.785 | 0.0889 | 97 | 3.144 | 0.707 | 0.0718 | 57 | 3.211 | 0.818 | 0.1084 |
| 2 | 122 | 3.811 | 0.8656 | 0.0784 | 103 | 3.631 | 0.6261 | 0.0617 | 143 | 3.545 | 0.6892 | 0.0576 | |
| 44 | 1 | 78 | 3.641 | 0.7555 | 0.0855 | 97 | 3.392 | 0.7005 | 0.0711 | 57 | 3.316 | 0.7596 | 0.1006 |
| 2 | 122 | 3.877 | 0.7985 | 0.0723 | 103 | 3.806 | 0.4862 | 0.0479 | 143 | 3.797 | 0.5881 | 0.0492 | |
| 45 | 1 | 78 | 3.167 | 0.8283 | 0.0938 | 97 | 3.227 | 0.8721 | 0.0885 | 57 | 3.07 | 0.6777 | 0.0898 |
| 2 | 122 | 3.418 | 0.9521 | 0.0862 | 103 | 3.398 | 0.7585 | 0.0747 | 143 | 3.42 | 0.7729 | 0.0646 | |
| 46 | 1 | 78 | 3.833 | 0.6328 | 0.0717 | 97 | 3.753 | 0.7504 | 0.0762 | 57 | 3.737 | 0.5518 | 0.0731 |
| 2 | 122 | 4.123 | 0.5689 | 0.0515 | 103 | 3.961 | 0.5225 | 0.0515 | 143 | 4 | 0.3753 | 0.0314 | |
| 47 | 1 | 78 | 2.923 | 0.8021 | 0.0908 | 97 | 2.876 | 0.8324 | 0.0845 | 57 | 2.825 | 0.7349 | 0.0973 |
| 2 | 122 | 3.443 | 0.9186 | 0.0832 | 103 | 3.214 | 0.7625 | 0.0751 | 143 | 3.315 | 0.8086 | 0.0676 | |
| 48 | 1 | 78 | 3.192 | 0.9542 | 0.108 | 97 | 3 | 0.9354 | 0.095 | 57 | 3.035 | 0.9056 | 0.12 |
| 2 | 122 | 3.762 | 0.9186 | 0.0832 | 103 | 3.757 | 0.8456 | 0.0833 | 143 | 3.608 | 0.9347 | 0.0782 | |
| 49 | 1 | 78 | 2.756 | 1.0089 | 0.1142 | 97 | 2.814 | 1.0341 | 0.105 | 57 | 2.86 | 0.9899 | 0.1311 |
| 2 | 122 | 2.279 | 1.0386 | 0.094 | 103 | 2.194 | 0.9081 | 0.0895 | 143 | 2.357 | 1.0441 | 0.0873 | |
| 50 | 1 | 78 | 2.795 | 0.8583 | 0.0972 | 97 | 2.412 | 0.6732 | 0.0684 | 57 | 2.544 | 0.7336 | 0.0972 |
| 2 | 122 | 3.09 | 0.9535 | 0.0863 | 103 | 2.932 | 0.7829 | 0.0771 | 143 | 3.098 | 0.79 | 0.0661 | |
| 51 | 1 | 78 | 2.795 | 0.8274 | 0.0937 | 97 | 2.412 | 0.6885 | 0.0699 | 57 | 2.579 | 0.7058 | 0.0935 |
| 2 | 122 | 3.066 | 0.9336 | 0.0845 | 103 | 2.971 | 0.822 | 0.081 | 143 | 3.084 | 0.7917 | 0.0662 | |
| 52 | 1 | 78 | 2.769 | 0.8046 | 0.0911 | 97 | 2.423 | 0.6897 | 0.07 | 57 | 2.526 | 0.7098 | 0.094 |
| 2 | 122 | 3.033 | 0.9442 | 0.0855 | 103 | 2.913 | 0.7934 | 0.0782 | 143 | 3.091 | 0.7953 | 0.0665 |
From the T test results of independent samples, for DIA the differences of the mean values of the scale's variables are significantly different in all the variables. The previous results with the non-parametric Mann-Whitney test of independent samples are corroborated. It is shown that the people who go to DIA more frequently value the PPL more than those who visit less regularly.
For Carrefour, from the T test of independent samples it is noted that the differences of the mean scores of the scale are significantly distinct for all those of the scale except variable 45. As before, the results with the non-parametric Mann-Whitney test of independent samples are confirmed. This means that the people who visit Carrefour more often value the Carrefour Selección more than those who go to this hypermarket less frequently.
Lastly, for Lidl the same procedure is followed. From the T test results for independent samples, the differences of the scale's mean values are statistically distinct for all the scale's variables except number 45, which is on the limit of the parameter of acceptation. The previous results with the non-parametric Mann-Whitney test of independent samples are corroborated. It is shown that the customers who go more to Lidl value the Deluxe brand more than those who visit the establishment less.
To summarize, we set out the propositions accepted and rejected from the different data analyses carried out in Table 9.
Verification of the propositions.
| PROPOSITIONS | RESULT |
|---|---|
| P1a: The perceived quality of PPL with respect to the brand leader varies among the main distributors. | ACCEPTED |
| P1b: There is a positive relation between the perceived value of PPL and income levels. | ACCEPTED |
| P2a: There is a positive relation between the perceived value of PPL and income levels. | REJECTED |
| P2b: There is no relation between the income level and the awareness value of the buyers of PPL. | ACCEPTED |
| P3: The establishment's image influences the perceived quality of the PPL. | REJECTED |
| P4: The brand image of retail establishments in social networks influences the perceived image of the PPL in these networks. | PARTIALLY ACCEPTED |
| P5: The average number of visits to the establishment influences the value of its PPL. | ACCEPTED |
The study of PPL is increasingly more important, given the evolution and margins which they contribute to retailers (Ter Braak et al., 2014). In the first proposition (P1a) we have studied this kind of brand based on the perceived quality with respect to the manufacturer's brand leader within the retail establishment. The result of the research shows that the perceived quality of PPL compared to that of the brand leader varies among the main distributors. The proposition set out is therefore accepted. It is seen that the respondents who consume the Deluxe brand offer lower values for this variable than for Carrefour Selección and Delicious. While standard PPL tend to imitate mainstream-quality manufacturer brands in perceived quality (Geyskens et al., 2010), we can deduce that not all retailers carry out this type of strategies in the same way or at least the consumers do not perceive it the same. So, it is essential that retailers are aware that perceptions of the perceived quality of PPLs vary between stores in order to establish their future strategies.
The proposition P1b stable that there are significant differences in the brand value for the 3 Premium brands analyzed. Especially between the Carrefour Selección Premium and its competitors, Deluxe and Delicious, determining that the consumers of Carrefour Selección have a lower brand value than those of their two rivals analyzed. This may be determined by several factors, for example, the distributor's strategy would not have been positioned correctly with regards to its PPL. Subsequently, we suggest that each retailer should analyze its PPL brand value with those of its competitors to determine possible impacts within its positioning or its business strategy. Since this research has shown that there are some retailers that even having a higher perceived quality on their PPL with respect to their competitors, their PPL brand value may not be properly positioned.
In propositions P2a and P2b we analyze the income levels of the consumers related with the perceived level of PPL and the brand equity of the Premium distributor buyers. A previous investigation (Beneke, Greene, Lok, & Mallett, 2012) showed that on average consumers do not consider PPL as financially risky, or that their perception depends on the consumer's income level. However, the same has never been demonstrated for the perceived value and the brand equity. In this study the respondents with a greater income level did not show significant differences in their value perceptions with respect to those with lower incomes. This indicates that the level of incomes does not influence the perceived value of PPL. Hence, customers who buy PPL have an awareness value and a perceived value of these brands which does not depend on the different socioeconomic levels. In this sense, although many people think that PPLs are exclusive products for affluent customers, we recommend that managers do not focus their efforts on the consumer's income level to explain the brand value and the perceived value of these brands. Because in this article we have shown that the income levels of PPL customers do not influence these variables.
Although there is broad literature related to a product's brand value and its perceived quality (Kamakura & Russell, 1993; Park & Srinivasan, 1994; Rangaswamy, Raymond, & Terence, 1993), little is directly linked with the distributor chain owner of a PPL. Although other authors have centered on this topic (Bigné, Borredá, & Miquel, 2013) for the distributor brand, investigations have not been done for PPL. In this article the coefficient of the variable in the regression line is negative, specifically -0.455, thus rejecting proposition P3. This is why it can be concluded that the establishment's image does not positively influence the perceived quality of PPL. We therefore think that an establishment with a good image is not a sign that its PPL has more quality. This can be due to many customers not having a clear idea that the PPL analyzed are really distributor brands and think that they are manufacturer brands.
Including information obtained directly from social networks is a key part of this article's originality. Although some authors study brand influences in social networks (Zhao, Li, & Jin, 2016), there is a gap concerning the distributor brand and even more PPL. We have determined that brand image in retail establishments affects the brand image of their PPL – this is the case for Lidl and Carrefour but not for DIA. This is why we accept P4 partially, concluding that for Lidl and Carrefour the greater the positive feeling about their PPL, the lower the negative feelings about their labels are. The non-fulfillment in the case of DIA and its PPL Delicious concerning this criterion may be due to different factors. One of them may be the strategy of the distributor itself, given that in its establishments there is a tendency to show this brand in one or a few gondola ends, thus they do not often have the contact with other products which could facilitate their comparison. This phenomenon does not tend to happen in the other distributors studied. On the other hand, it may be that the customers of DIA have not been able to mentally separate the discount store from one they go to with higher range products, DIA having a hard job linking its PPL to its label. Therefore, we recommend that discount retailers take into account the above in order to correctly establish their strategy with respect to their PPL brand. Due to the fact that the positioning of a discount store could be conflicting with a PPL.
According to the aforementioned, social networks have become a fundamental instrument in retailers' communication strategies (Zhang, Guo, Hu, & Liu, 2016), being a tool which can cause feelings for or against their label. This is why it is necessary to center efforts on which strategies of retailers with their products in the on-line channel are parallel to the off-line world. This is the reason why it is recommended to take care of what is shown in the on-line channel about distributor brands and PPL. Given that different opinions of consumers in this medium are a source of a very direct influence on the behavior of future shoppers (Kang & Johnson, 2013). It should be especially emphasized that DIA, with its PPL Delicious, must showcase its label to shoppers in a way that is strategically determined for its establishments.
Finally, there are various authors who try to explain the relations between distributor brands and PPL with distinct variables as the epicenter of their research (Keller et al., 2016; Reimann & Wagner, 2016). None, however, has centered specifically on explaining if there is some relation between the average number of visits to the retail establishment and its PPL's value. In this case, we have determined that P5 is accepted given that the 3 retail establishments studied all coincide with the same common denominator. That is, the consumer who visits each establishment more yields a more positive value for the establishment's PPL. This is to say, the customers who visit a store more frequently have a better perception of its PPL's value. Therefore, PPL managers should be aware that average visits are an important component of brand value. Therefore, we recommend that managers who wish to improve the perception of value of their PPL should encourage their customers to visit their establishments more frequently, by means of loyalty tools.
For future research, we propose to extend this research with the extension of the sample in other European countries using the same brands. Subsequently, it would be quite interesting to investigate if this behaviour is verified in the same way in other continents and other retailers. In addition, we will consider introducing other variables to extend the studied model.