metricas
covid
Journal of Innovation & Knowledge The influence of reference knowledge on the digital service quality and incentiv...
Journal Information
Visits
595
Vol. 10. Issue 4.
(July - August 2025)
Full text access
The influence of reference knowledge on the digital service quality and incentive mechanism
Visits
595
Jingjing Hao, Xin Zou, Yufeng Chen
Corresponding author
chenyufeng@zjnu.edu.cn

Corresponding authors.
, Yuan Liu
Corresponding author
liuy@zjnu.cn

Corresponding authors.
College of Economics and Management, Zhejiang Normal University, 688 Yingbing Road, Wucheng District, Jinhua City, Zhejiang Province, PR China
This item has received
Article information
Abstract
Full Text
Bibliography
Download PDF
Statistics
Figures (20)
Show moreShow less
Tables (22)
Table 1. Variables and their meanings.
Tables
Table 2. Some Indicators of DSQ.
Tables
Table 3. Service quality requirement and performance information.
Tables
Table 4. Incentive effect analysis in the completely asymmetric information situation.
Tables
Table 5. Incentive effect and cost sharing ratio under different scenarios.
Tables
Table 6. Incentive effect comparison of different weighting methods.
Tables
Table 7. Optimal solutions caused by changing rc in symmetric information situation.
Tables
Table 8. Optimal solution by changing rc in completely asymmetric information situation.
Tables
Table 9. Optimal solutions caused by changing rc in partly asymmetric information.
Tables
Table 10. Incentive effect and cost sharing ratio under different ω.
Tables
Table 11. Optimal solutions caused by changing θj under symmetric information situation.
Tables
Table 12. Optimal solutions caused by changing θj in completely asymmetric information.
Tables
Table 13. Optimal solutions caused by changing θj in partly asymmetric information situation.
Tables
Table 14. Optimal solutions caused by changing ϑk in symmetric information situation.
Tables
Table 15. Optimal solutions caused by ρ in symmetric information situation.
Tables
Table 16. Optimal solutions caused by ρ in symmetric information situation.
Tables
Table 17. Optimal solutions caused by caused by ρ in partly asymmetric information.
Tables
Table 18. The TREs’ sale revenue data and urban GDP in 2023.
Tables
Table 19. Optimal solutions under symmetric information situation.
Tables
Table 20. Optimal solutions under completely asymmetric information situation.
Tables
Table 21. Optimal solutions under symmetric information situation.
Tables
Table 22. Optimal solutions under completely asymmetric information situation.
Tables
Show moreShow less
Abstract

In the digital service supply chain, digital service providers undertake the marketing platform development programs with satisfying digital service quality (DSQ) to help traditional retail enterprises (TREs) achieve digital technologies and merchandizing innovation. To illustrate the influence of external reference knowledge on principals’ feeling on DSQ and improvements, this study develops a novel framework to assess TREs’ perceived DSQ and design incentive strategies concerning differential cooperation scenarios. The study integrates the prospect theory and the principal-agent model to reveal the DSQ incentive strategies influenced by external references. Its contributions include (1) proposing DSQ appraisal indicator system and standardized computation process, (2) revealing the influence of external referencing knowledge on psychological utility in DSQ cooperation, and (3) exploring the incentive framework and equilibrium of DSQ utility in the differential degrees of information asymmetry. The managerial implications can assist the TREs in selecting digital marketing KPIs, determining proper benchmarks, confirming the dynamical dominance of external references, reducing the degree of information asymmetry, and implementing effective incentives.

Keywords:
Benchmark knowledge
Varying weight
Cost-sharing incentive
Prospect theory
Principal-agent model
JEL codes:
M11
C73
M31
O33
M15
O31
Full Text
Introduction

In the digital economy era, the customers’ shopping habits and activities are dramatically changing to global e-commerce sales via mobile devices (Dolega et al., 2021). As an effective business-driven hand (Azemi et al., 2022), digital marketing platform can provide the professional functions (e.g., precise promotion, real-time interaction, and data security) (Kashyap et al., 2025), enhancing customers’ shopping experience and retailing brand reputation. In the trend of digital transformation, traditional retail enterprises (TREs) have an urgent demand for building the digital marketing platform to achieve marketing innovation, such as data mining (Royle & Laing, 2014), business operation (Reim et al., 2022), and sale prediction (De Caigny et al., 2020). Digital marketing technologies have become the driving force in realizing effective precision marketing (Chou et al., 2022), exact market positioning (Palmié et al., 2022), potential customer recognition (Yang et al., 2021), and clear customer segmentation (Kalia et al., 2022). Regarding platform competitiveness, digital service quality (DSQ) presents the customers’ comprehensive satisfaction with the digital marketing technologies and is required to determine the assessment criteria and standardization measurement.

In the development process of digital marketing platform, TREs always cooperate with digital service providers (DSPs) to conduct joint development. As the agent, DSPs guarantee the digital platform with a certain DSQ (Anand & Goyal, 2019). The DSQ can describe the effect of joint development. More importantly, the TRE’s perspective on DSQ is significantly influenced by external reference points, such as the main competitor’s DSQ and industrial DSQ. If the TRE’s received DSQ is better than an external reference level, it will gain additional positive psychological benefits caused by the leading position. If the TRE’s received DSQ is lower than an external reference level, it will experience additional negative psychological effects because of the lagging DSQ. The influence of external reference knowledge on the TRE’s perceived DSQ should be explored to show its psychological utility. Particularly in the situation of many references, the varying weights of different benchmarks should be appropriately determined to describe the aggression effect.

In the digital supply-chain cooperation, the degree of information asymmetry determines the participant’s dominant position, which affects the DSQ incentive strategy selection. In digital cooperation, the TRE is the principle and asks the DSP to develop the digital marketing platform with competitive advantages. As the agent, the DSP, first, always devises the initial decision-making on development investment, which is often influenced by self-interest toward its own optimal strategy (Greenstone et al., 2022). Later, the TRE has to accept the DSP’s investment result and final digital platform with DSQ, which leads to an adverse selection consequence (Pavlov et al., 2022). Because of information asymmetry, moral hazard is generated and may be detrimental to the TRE’s interests (Zhang et al., 2023). Consequently, establishing an effective incentive mechanism is a crucial management solution for the above ethical dilemma (Liu et al., 2022). Although previous studies contributed to the direct transaction effect, the incentive focused on the independent improvement. According to the prospect theory, the TRE’s perspective on DSQ is highly reliant on external references. The incentive objective can be expanded to psychological utility.

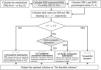
To prevent the DSP’s moral hazard in the development cooperation, this study merges the prospect theory into a principal-agent model considering the TRE’s psychological utility regarding competition position and information asymmetry. The proposed cost-sharing incentive method can assist the TRE in achieving satisfied perceived DSQ in the digital service supply chain. As indicated in Figure 1, the steps of the study are indicated to highlight its general perspective.

Figure 1.

Study steps.

The contributions of the research include the following

  • (1)

    The definition and a set of indicators of innovation-driven DSQ have been established, providing a foundational analytical framework for measuring digital marketing performance.

  • (2)

    How external reference points affect the TRE’s psychological utility is examined with a focus on optimistic preferences.

  • (3)

    The incentive solution under symmetric and asymmetric information situation is explored.

The contents of the study are organized as follows. Section 2 summarizes existing research and research gaps. Section 3 presents the theoretical framework of the research. In Section 4, the definition of DSQ and the perceived utility considering dual reference points are presented, and the perceived DSQ under a single reference point is given. In Section 5, the incentive mechanism is conducted through the “principal-agent” theory. In Section 6, the incentive solution is provided under symmetric and asymmetric information situations. In Section 7, a numerical study is conducted to prove the effectiveness of the above method. Section 8 provides the research conclusions and future research topics.

Literature review

The study considers the overlapping digital marketing domains, reference points, and incentive methods. Consequently, this section provides a brief overview of the following three aspects. The subsection describes the research gap for precisely assessing the TRE’s overall psychological utility and designing related incentive solutions.

The impact of digital technology on digital marketing

In the new retail era, emerging digital technologies are rapidly changing the marketing environment in the areas as consumer behavior (Ratchford et al., 2022), social media with user-generated content (Babić et al., 2020; Šola et al., 2022), digital marketing platforms (Veile et al., 2022) and online searching strategy (Lin et al., 2020; Agnihotri, 2020)). Ratchford et al. (2022) examined how digital technology affected consumers’ search costs and search behavior through online shopping, which revealed that the Internet shortened the customers’ consideration time. Babić et al. (2020) explored the generation process of consumers’ electronic word-of-mouth in social media related to associate monetary value. Veile et al. (2022) conducted an exploratory numerical study to analyze how digital platforms changed industrial firms’ business models and marketing strategies. Lin et al. (2020) revealed that paid search engines could promote users’ purchasing frequency and increase customers’ lifetime value by effectively identifying high-value customers. The above related research contributes to understanding the various digital marketing processes affected by technology and provides the support for identifying the relevant DSQ indicators that reflect the current digital marketing landscape.

The role of psychological utility and weighting methods in the supply chain

Prior research in this domain provides a solid foundation for better understanding how reference knowledge impacts supply chain activities, providing a basis for incorporating psychological factors into the TRE’s economic benefit.

Psychological utility in supply-chain cooperation under reference points

In supply-chain cooperation, reference points significantly influence the participants’ psychological competitive utility, which is widely used in ordering decisions (Wei et al., 2019; Uppari & Hasija, 2019)), pricing strategies (Das et al., 2021), supply-chain coordinate tactics (Qiu et al., 2022; Vipin & Amit, 2021), risk control (Liu & Chen, 2019), supplier selection (Chai et al., 2023), and supply-chain performance evaluation (Liang et al., 2022). Wei et al. (2019) studied the impact of external industry level and minimum profit expectations on the newsboy decision problem. Das et al. (2021) proposed a manufacturer’s loss aversion model under the reference level to design a pricing strategy in a green supply chain. Qiu et al. (2022) addressed the coordination problem concerning dynamic reference points in online-offline channels with different structures. Liu and Chen (2019) introduced a profit reference point into the decision-makers’ psychological perception of risk. Chai et al. (2023) established a sustainable supplier selection decision framework in which positive and negative ideal reference points were considered to describe decision-makers’ risk preferences. Liang et al. (2022) considered decision-makers’ bounded rationality under random subjective reference points and constructed a supplier performance evaluation model in five dimensions.

The weighting method of psychological competitive utilities under multiple reference points

To consider the contributions of multiple reference points, the weights of different reference points should be suitably designed to aggregate the participants’ psychological competitive utilities. Existing weighting methods include subjective designation (Zhong et al., 2022; Liang et al., 2020), additive method (Wei et al., 2019; Wang et al., 2020), and attitude evaluation (Zhu et al., 2017). Zhong et al. (2022) employed subjective equal weights to integrate psychological utility with monetary and time reference points. Wei et al. (2019) simply added the influence of the bottom line and the status quo reference point when measuring the psychological utility of newsboys. Zhu et al. (2017) treated decision-makers’ attitudes toward the reference points as the coefficient for determining the weights.

The incentive solutions in supply chain cooperation

In supply-chain cooperation, the research on incentive mainly focuses on the impact of incentives on supply-chain performance (Gao et al., 2023), incentive mechanism design (Chakraborty et al., 2019; Liu et al., 2022), and information management in incentive system (Li & Zhang, 2021; Fu & Xing, 2021). Gao et al. (2023) analyzed the response decisions of the supply chain under the incentive strategies, which revealed that incentives could enhance inventory carryover capability in decentralized supply chains. Chakraborty et al. (2019) addressed the cost-sharing mechanism between the retailer and the manufacturer, which intensified the value of a cost-sharing contract on improving supply-chain performance. Li and Zhang (2021) explored the influence of real-time information and the participants’ forecasting ability on the design of incentive mechanism in the supply chain, in which information acquisition could promote supply-chain members to distort optimal decisions. These studies on incentive solutions in supply-chain cooperation can provide a basic framework for us to design more effective incentive mechanisms that consider comprehensive psychological utility and external DSQ reference points in our research.

In summary, existing research has revealed various incentive methods for improving the participants’ economic benefits and mitigating the agents’ moral hazard. However, in the digital economy era, the principal’s psychological feeling on DSQ is significantly influenced by the external reference knowledge and future potential. The incentive focus should be extended from single economic benefit to comprehensive psychological utilities, considering the effect of external DSQ reference points and varying weights. First, the definition, criteria, and computation process of DSQ should be updated according to the feature of digital economy. Second, the TRE’s psychological utility regarding the DSQ needs to be reasonably measured to illustrate the influence of external benchmarks. More importantly, the exploration of psychological utility was not employed in the principal-agent framework. In digital service cooperation, the DSP prioritizes its own benefits because of information asymmetry, which may be detrimental to the TRE’s interests. The degree of information asymmetry can affect the equilibrium of the principal-agent analysis. Consequently, an incentive method, which reasonably evaluates the TRE’s psychological utility and considers the degree of information asymmetry, should be explored to directly support the service supplier’s management activities.
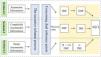
Theoretical framework

This paper selects the digital service supply chain to explore the incentive solution for improving DSQ with regard to dual external references and varying weights. Combining digital marketing (Ratchford et al., 2022), the prospect theory (Wei et al., 2019), and weighting (Zhong et al., 2022) and incentive methods (Liu et al., 2022), the theoretical framework is proposed in Figure 2. The logic of the study is developed as “Actual DSQ and perceived DSQ” → “Aggression for comprehensive DSQ with varying weight” → “principal-agent framework” → “Incentive solutions in specific scenarios” → “Managerial implications.” In particular, the novel requirements of digital marketing provide the guidance on designing the definition and potential indicators of DSQ, which is the answer to the first research question. Next, the prospect theory is used to transfer the DSQ to the TRE’s perceived DSQ, which considers external reference points and varying weights to demonstrate future potentials, as the exploration of the second research question. Furthermore, to fulfill the third research gap, the principal-agent model is established to describe the improvement requirement of the TRE’s perceived DSQ, and the incentive theory explains the cost-sharing incentive solutions to prevent the DSPs’ moral hazard caused by information asymmetry. The TRE can use the incentive solutions to design suitable supply-chain contract to solve the adverse selection problem.

Figure 2.

Theoretical framework.

Stage 1: Actual DSQ. Referring to the digital marketing requirements, first, DSQ is defined, and multiple indicators in the dimensions of digital tangibles, digital trust, digital interaction, customer centricity, and reliability are proposed as the KPIs (Büyüközkan et al., 2020). Second, the raw performance data, qi, as well as the expectations and tolerant intervals of KPIs, can be obtained. Next, the KPIs can be divided into the smaller-the-better, the larger-the-better, and the nominal-the-better, which provides a framework for standardizing and aggregating the DSQ (Taguchi, 1986). At the technology level, Artificial Intelligence (AI) can be utilized to determine appropriate DSQ indicators deconstructed from the TRE’s vision and mission. AI can handle a large amount of data and identify the key factors related to DSQ, which is in line with the insights into market and customer needs in the marketing theory. To avoid human operating error, Machine Learning (ML) could be employed in the data standardized process and ensure automated computation. A detailed calculation process is conducted in Section 4.1.

Stage 2: Comprehensive DSQ under dual reference knowledge. Guided by the prospect theory (Barberis, 2013), the TRE’s value function under a single reference knowledge is developed. Additionally, optimistic preference, ki, is proposed to reflect the TRE’s attitude on the future improvement potential of DSQ. Considering the fierce market competition (Llopis-Albert et al., 2021), the main competitor’s DSQ, rc, and industrial DSQ, rh, are selected as dual references points. Moreover, to calculate the TRE’s comprehensive perceived DSQ, the influence of optimistic preference and varying DSQ distances are integrated, which induces dynamic weight in the aggregation process. The prospect theory focuses on an individual’s reliance on reference points when making decisions and their different perceptions of gains and losses. In this stage, data mining can be applied to obtain unstructured knowledge (e.g., industry survey and competitor’s operation report) online, identifying “industrial-level” and “competitor-level” DSQ benchmarks. Through data mining, specific and quantifiable reference points are found, making the application of the prospect theory in DSQ evaluation more specific and operable, and achieving a deep integration of theory and cutting-edge technologies in a quantitative perception of DSQ. Section 4.2 presents the above specific operations.

Stage 3: Principal-agent framework and incentive mechanism. First, based on the comprehensive calculation of the TRE’s perceived DSQ, its psychological utility can be obtained, which concerns the influence of external reference points with economic benefits. Second, a principal-agent model containing incentive compatibility constraints and individual rationality constraint is proposed. Next, the incentive process of cost-sharing is designed to explore the optimal solution of the cooperation. In this stage, reinforcement learning can be applied to dynamically optimize incentive parameters (e.g., cost-sharing ratios) in the “principal-agent” model by analyzing real-time data on market conditions and psychological utility preferences. The trial-feedback-adjustment cycle can refine the related incentive strategies through iterative improvement and maintain robustness across differential scenarios containing risk preference shift or competitive intensification. This enables the “principal-agent” theory to adapt to the dynamically changing market environment in practical applications and transform the abstract incentive mechanism into specific strategies that can be adjusted and optimized in real time. The detailed operations are illustrated in Section 5.

Stage 4: Incentive solutions in specific scenarios. According to the degree of the DSP’s private information, the optimal solutions in different supply-chain dominant conditions are discussed. First, under the condition of complete symmetric information, the TRE has a dominant position in the supply-chain cooperation, which prioritizes achieving its expected psychological utility. Second, the cost-sharing incentive solution of the “principal-agent” model in the case of complete asymmetric information is analyzed. Next, under partly asymmetric information, the equilibrium of the transaction is explored where the participants are fighting for the dominance. The incentive theory is centered on devising efficient incentive mechanisms to drive agents toward fulfilling principals’ objectives. In this stage, the blockchain technology is harnessed to ensure the transparency of information flow by recording unalterable transaction data, which serve as a dependable basis for evaluating the level of information symmetry. Blockchain can be leveraged to ensure transparent information flow by recording immutable transaction data. Assessing the degree of information symmetry (e.g., symmetric, partially asymmetric) could enable tamper-proof validation on DSP performance and reduce moral hazard in incentive strategy design. The calculation process can be found in Section 6.

Stage 5: Managerial implications. After the empirical study, some policy implications, such as, the selection of DSQ KPIs, determination of competitive benchmarks, adoption of varying weights and designation of incentive solutions, are provided, which can directly help the TRE to enhance the DSQ and improve the operation performance.

In the following sections, the main terminologies and notations used in this paper are summarized in Table 1.

Table 1.

Variables and their meanings.

Variable  Meaning  Variable  Meaning 
DSQ characteristic  yl  The minimum boundaries of the tolerance interval of characteristic 
μ  The optimal target value of characteristic  yu  The maximum boundaries the tolerance interval of characteristic 
Actual DSQ level  qL  The standardized quality level of the large-the-better 
qS  The standardized quality level of the small-the-better  qN  The standardized quality level of the nominal-the-better 
ωi  The weight of indicator in DSQ  The optimistic preference 
The distance between actual DSQ and reference DSQ  P(r)  TRE's perceived DSQ 
rh  The average DSQ level in the industry  rmin  The smaller of the two reference points 
rc  The main competitor's DSQ level  rmax  The greater of the two reference points 
k1  The optimistic preference of rmin  P1  The perceived DSQ under rmin 
k2  The optimistic preference of rmax  P2  The perceived DSQ under rmax 
λ  The weight of the reference point in TRE's Perceived DSQ  α  The risk preference coefficient 
β  The risk aversion coefficient  θ  The loss aversion coefficient 
λ1  The weight of rmin  d1  The distance between actual DSQ and rmin 
λ2  The weight of rmax  d2  The distance between actual DSQ and rmax 
PiI  The comprehensive perceived DSQ when r≥rmax>rmin  λiI  The weight of the ithreference point when r≥rmax>rmin 
PiII  The comprehensive perceived DSQ when rλiII  The weight of the ithreference point when r
PiIII  The comprehensive perceived DSQ when rmin≤rλiIII  The weight of the ithreference point when rmin≤r
φ(r)  Value-added benefits of TRE  φ[P(r)]  Perceived value-added benefits of TRE 
∅(r)  Incentive fee  Fixed fee 
CS(r)  Development cost of DSP  V[πT(r)]  TRE's benefit function of perceived DSQ 
V[πS(r)]  DSP's benefit function of perceived DSQ
Digital service quality and perceived utility

As shown in Figure 3, this section illustrates the definition of DSQ and its computation method in Section 4.1, which contains the indicators, standardization and aggregation. The perceived DSQ concerning a reference point and the optimistic preference are put forward in Section 4.2. The TRE’s comprehensive perceived DSQ under dual reference points is calculated with regard to the dynamic dominance of external reference points in Section 4.3.

Figure 3.

Perceived DSQ calculation process.

Digital service quality and its computation methodDigital service quality and its indicators

Traditional Service Quality (SQ) primarily describes the customers’ satisfaction with the service (Chen et al., 2022). In the SERVQUAL framework, SQ reflects the customers’ expectations and needs regarding the service trust in offline channels (Barakabitze et al., 2019), which can be measured with the following five dimensions: tangibles, reliability, responsiveness, assurance, and empathy (Parasuraman et al., 2002). Because of the rapid development of mobile Internet, electronic SQ (e-SQ) focuses on the customers’ interactive assessments on online SQ, primarily evaluating independent online service processes (e.g., web browsing and online transactions) through Internet technologies with metrics such as response time and usability (Chao et al., 2024). E-SQ can be measured in four dimensions as follows: efficiency, system availability, fulfillment, and privacy (Chao et al., 2024). In the new retailing era, the integration of online service is emerging, and digital marketing platform can provide systematic digital solutions covering the overall marketing life cycle, which not only focuses on technological implementation (such as platform stability) but also emphasizes the deep integration of technology and business. For example, AI-driven precision marketing push directly improves the marketing return on investment (ROI) in retail enterprises, rather than merely optimizing online interactive experiences. DSQ represents a holistic evaluation of end-to-end digital solutions in the new retail era, extending to the entire marketing life cycle from real-time data collection and AI-driven personalization to customer engagement in innovation. The evolution of SQ, e-SQ, and DSQ is illustrated in Figure 4.

Figure 4.

The evolutionary roadmap.

To realize digital transformation from separated offline business to smart e-commerce, TREs always outsource the developing tasks of digital marketing platforms to digital technology companies (Anand & Goyal, 2019). In this digital cooperation, the traditional SQ should be expanded to smart system level, thus, the novel comprehensive concept of DSQ was born (Büyüközkan et al., 2020), emphasizing emerging digital marketing technologies, such as real-time data integration, AI-driven personalization, and value co-creation (Buyukozkan et al., 2020). Different from the SERVQUAL focusing on offline reliability and responsiveness (Collier & Bienstock, 2006), DSQ exhibits a series of digital capabilities, such as dynamic customer insights, tailored experiences, and customer engagement in innovation.

Definition 1

DSQ refers to users’ subjective satisfaction in how digital services meet their digital needs. It is a dynamic construct that not only reflects the integration effectiveness in digital marketing life cycle but also concerns the outcomes of the digital service.

The DSQ of digital marketing platform represents the TRE’s satisfaction with the digital service functions of a systematic solution, such as real-time data collection, smart preference recognition, accurate customer portrait, precise marketing push, and AI. Emerging information technologies have made the most important developments in the field of interactivity through the shifting from general mass marketing to individual precise marketing (Demirel, 2022). According to user expectations on digital platform, DSQ highly relies on extracting information from big data to enhance marketing performance.

For example, during Alibaba’s Double Eleven campaign, DSQ manifested as the seamless alignment of technical performance and customer experience on its digital marketing platform. Real-time data collection ensures system reliability and sub-3-second latency. Smart preference recognition uses ML models to effectively predict purchase intention and significantly reduce customers’ acquisition costs. Precise marketing push servers’ dynamic advertisements to high-value segments identified via the Recency-Frequency-Monetary Value analysis. These DSQ-driven capabilities not only align with customer expectations but also demonstrate how big data extraction and AI integration contribute to measurable business outcomes (Kamble & Gunasekaran, 2020; Elia et al, 2022).

According to Büyüközkan (2020), the indicators of DSQ comprise five dimensions as follows: digital tangibles, digital trust, digital interaction, customer centricity, and reliability. Some indicators reflect the application of digital technologies in the supply chain, such as traffic, time spent on page visit, customer information assets, and packet loss rate. Other indicators present the improvement of marketing performance because of the application of digital technology, such as average transaction value, ROI, and customer acquisition cost.

The indicators in the digital tangibles dimension represent digitized equipment, facilities, and their digital properties (Büyüközkan et al., 2019). In particular, functionality reflects the availability of digital channel and service characteristics (Chan et al., 2020; Melović et al., 2021). Efficiency reflects the capability of providing suitable products and information with minimum effort (Liu et al., 2022; Varadarajan, 2020).

The indicators in the digital trust dimension represent the performance and the stability of the digital platform, which can be measured by network performance indicators such as packet loss rate, transmission delay, and throughput (Skaka‐Čekić et al., 2023; Huang et al., 2018; Alnawas & Al Khateeb, 2022).

The indicators in the digital interaction dimension consider the digital communication networks between companies and the supply chain members through digital platforms (Büyüközkan et al., 2019). Collaboration and mobile communication have been selected in this study to reflect the capability of digital interaction, which will be enhanced using digital technology in the marketing activities.

The indicators in the customer centricity dimension represent an “outside-in” approach through innovative service delivery experience to fulfill the customer’s emotional needs by putting them at the heart of an organization (Büyüközkan et al., 2019). In particular, customer segmentation measures the ability to understand precisely the customers’ preferences and shopping behavior, such as frequency, recency, and monetary (Si et al., 2015). Customer insights are used to measure the transforming ability from customer analysis into marketing performance.

The indicators in the reliability dimension consider the role of digital technology in achieving marketing objectives and reducing input costs (Büyüközkan et al., 2019). Some financial indicators, such as marketing ROI, marketing cost, and customer acquisition cost, are selected as the second-grade indicators. Some market performance indicators, such as international market share, trade competitiveness index, and revealed comparative advantage index, are included to reflect the improved performance after the trial operation on the digital platform.

This indicator system is designed to provide an evaluation framework for the core operational dimensions of digital platforms. However, as different enterprises may have varying strategic priorities and operational environments, organizations can adapt or supplement relevant indicators according to their development goals and business needs in practical applications, ensuring that the indicator system aligns closely with strategic objectives.

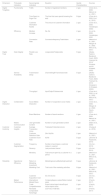
Note: Ns: Number of customers at the start of the period; Ne: Number of customers at the end of the period; Na: Number of customers acquired during the period; Nc: Number of chained customers in the given period; Nt: Total number of customers at the start of the period; Sc: overall marketing campaign costs spent on acquisition; St: marketing team salary; Ss: the cost of marketing software; So: overhead related to marketing (e.g. designers, consultants); CE: Company's Export; TCE: Total Company's Export; GE: Global Export; TGE: Total Global Export

Standardization and aggregation of DSQ

To ensure additivity and consistency across diverse DSQ indicators (with varying units, ranges, and definitions), data standardization is required. Additionally, there are three kinds of quality characteristics: the large-the-better (L type), the small-the-better (S type), and the nominal-the-better (N type). Suppose that the tolerance interval of characteristic Y is [yl,yu], in which yl and yu refer to the minimum and maximum boundaries, μ is the optimal target value. Let ε be an infinitesimal positive number extremely close to 0. The standardized quality level of the large-the-better, small-the-better and nominal-the-better quality characteristics, qL,qS and qN, can be designed as

For aggregation, let n DSQ indicators have weights ωi(ωi≥0,∑i=1nωi=1). The DSQ can be comprehensively described as the weighted sum of qL, qS and qN.

Here, r∈[0,1]. If any quality performance of an indicator is not located in the quality interval, r=0. Only if the performances of all the quality characteristics meet the quality requirement r>0. Especially, if any metric is located at the boundary, r=ε→0+.

TRE’s perceived DSQ and optimistic preference concerning dual DSQ reference knowledgeTRE’s perceived DSQ based on prospect theory

According to the prospect theory, the participant’s gain-loss state significantly impacts psychological utility, especially when it faces reference level (Barberis, 2013). The essence of a user’s perceived utility is the outcome of the psychological accounting process determining the gain/loss interval through reference points and an asymmetric value function (Tian et al., 2022). Different from the “absolute utility maximization” assumption, perceived utility in the prospect theory reflects the differential psychological feelings regarding benefits and losses (Jin et al., 2024). In this study, TREs’ perceived DSQ represent principals’ subjective utilities—gain and loss—because of the dynamic comparison between DSQ and the external reference points.

In the digital service supply chain, the prospect theory can reveal how external reference knowledge influence TREs’ perceived DSQ. TREs may have reference knowledge based on past experiences, industry norms, or anticipated future scenarios. Consequently, the prospect theory can help TREs gain deeper insights into the psychological dynamics driving the preferences and choices. The prospect theory is essentially applied to model TREs’ preferences for adopting digital technologies in precision marketing in the digital retailing era. Consequently, perceived DSQ is conceptualized as the TREs’ subjective evaluation of the digital performance derived from digital marketing platforms, caused by the cognitive comparisons between actual DSQ outcomes and external reference points. Guided by the prospect theory (Tversky & Kahneman, 1981), the formation of perceived DSQ involves two interdependent psychological elements as follows: reference dependence and loss aversion. Reference dependence means that the TRE evaluates the DSQ not only in absolute digital performance but also relative to external knowledge as benchmarks. Loss aversion shows that negative deviations from reference knowledge can generate stronger psychological impacts than equivalent gains.

In particular, if the TRE’s DSQ is larger than an external reference, it will obtain the additional positive psychological benefit caused by leading position, and vice versa. Additionally, the distances between actual DSQ and external reference points can show the future development space and influence the TRE’s perceived DSQ as well. If the actual DSQ is lower than a referencing level, the TRE’s pessimistic perspective damages its perceived DSQ. As the gap is continuously changing, the TRE’s optimistic attitudes regarding external reference points are dynamically switching, which creates the varying dominance of external reference points.

If the TRE’s received DSQ level is r, let us assume that the DSQ reference point, such as industrial DSQ or competitor’s DSQ, is r0. The TRE’s perceived DSQ under the influence of DSQ reference point r0 is as follows:

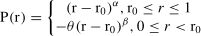
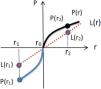
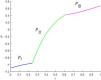
According to empirical data, α=β=0.88, and θ=2.25 (Barberis, 2013). The relationship between TRE’s perceived DSQ, P(r), and DSQ level, r, can be represented as shown in Figure 5, let P(r=r0)=0.

Figure 5.

TRE’s psychological utility curve.

If there is no DSQ reference point, assume that TRE’s psychological utility is a linear function L(r),∂L∂r>0, L(r0)=0. As illustrated by Figure 5, the DSQ reference point enhances the TRE’s perceived DSQ brought by the gap between actual quality r and referenced level r0. In particular, when r=r1r0, the risk preference coefficient, α, will let TRE be more proud because of quality leading, P(r2)>L(r2).

TRE’s optimistic preference-driven dynamic aggregation of perceived DSQ

In addition to its reference points, the TRE exhibits an optimistic preference—a behavioral propensity to prioritize future development potential over current performance gaps, which can be formalized through the second derivative of the value function

Definition 2: Optimistic preference is the decision-makers’ positive perception for future development, which is induced by the gaps between actual performance and reference levels. The TRE’s optimistic preference can be designed as follows:

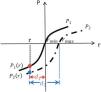
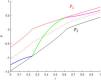
Suppose that industrial DSQ reference is rh and the competitive DSQ reference is rc, rmax=max{rh,rc},rmin=min{rh,rc}. As shown in Figure 6, TRE’s perceived DSQ caused by rmin and rmax are P1(r) and P2(r), which behaves the weight as λ1 and λ2. The second derivative of the value functions k1, k2 are

Figure 6.

The TRE’s value function under double reference points.

The weights of DSQ reference point are related to the optimistic preference coefficients, which reflect the TRE’s attitude on the future development potential of various DSQ reference points. If the TRE is in the lagging position, i.e. the perceived DSQ is positive but has a more promising future potential, it is more inclined to endure current unpleasant events and alleviate its sense of apprehension, which leads to a lower weight to this reference knowledge. If the TRE is in the dominance competition position, it experiences a more declining trend, the restricted opportunity for quality development will result in reduced prospects and less positive attitude on perceived DSQ. The changing dominant position of reference points creates varying weights of industrial and competitive psychological utilities, which can be designed as

The comprehensive utility function is

When rλ1.

When rmin≤rλ1. If r is far from rmin, the development space of P2 is higher than the deterioration space of P1, which induces TRE’s comprehensive focus on the positive utility P1, λ2<λ1.

Whenr≥rmax>rmin, the TRE’s DSQ is higher than all reference levels, which generates dual positive utilities, P1=(r−rmin)α>0,P2=(r−rmax)α≥0. According to the dual references rmin and rmax, the corresponding reference weighs are λ1=k2k1+k2 and λ2=k1k1+k2. Because the comparative larger P2 creates more satisfying feeling, P2 occupies more dominant position than P1, λ2>λ1.

Further discussion on geographic location and firm size

Let us suppose that a targeted TRE, i, in a certain city, has determined its industrial DSQ, rh, and competitor’s DSQ, rc; its annual sale revenue is sri, and the city’s annual GDP is gdpi. To expand the reference knowledge to another firm in another city, the prosperity efficient and the scale efficient can be used to describe the influence of the TRE’s geographic location and firm size on external reference levels.

Prosperity efficient, θj, shows the influence of geographic locations, such as city j, on industrial DSQ, rh, comparing to that of the targeted city i. Let us assume that the annual GDP of city j is gdpj. The prosperity efficient equals the ratio of annual GDPs: θj=gdpjgdpi. If another TRE in city j wants to determine its industrial DSQ, rhj, it will be directly based on city’s industrial DSQ, rh, rhj=θjrh=gdpjgdpirh.

Scale efficient, ϑk, denotes the influence of firm size, such as sale revenue srk, on the competitor’s DSQ rh, compared to the targeted TRE i. Let us assume that TRE k’s annual sale revenue is srk. The size efficient can be set as the ratio of annual sale revenue, ϑk=srksri. If another TRE k determines its competitor’s DSQ, rck, it will be directly based on city’s industrial DSQ, rc, rck=ϑjrc=srksrirc.

Incentive mechanism for improving TRE’s DSQ

After achieving the TRE’s perceived DSQ, a “principal-agent” model describing the outsourcing cooperation between it and the DSP is established to explore the incentive mechanism, and the analysis process is demonstrated in Figure 7. Section 5.1 illustrates the benefits and costs of TREs and DSPs. In Section 5.2, the “principal-agent” model containing the cost-sharing incentive solution, individual rationality constraint (IR), and incentive compatibility constraint (IC) is designed to explore the cooperative relationship. In Section 5.3, the incentive solution design process is explored.

Figure 7.

Steps of incentive mechanism.

The incentive mechanism plays a crucial role in motivating the DSPs to improve the DSQ of the digital marketing platform and providing stronger marketing support for the TREs. Concerning the influence of the incentive mechanism, the DSPs actively strive to improve the DSQ from multiple dimensions. Specially, in the digital tangible dimension, DSPs can innovatively optimize the infrastructure and functional modules to increase the online review time and page visiting length. According to the digital trust dimension, they could optimize algorithms to enhance data security and service stability. In the digital interaction dimension, DSPs can update the interactive functions by developing interfaces for deep integration with social media and sharing modules. Referring to the customer centricity dimension, DSPs can improve the shopping data analysis models by developing intelligent systems. In the reliability dimension, DSPs could adopt novel analysis methods and develop evaluation, prediction, and competitive analysis tools to strengthen the platform’s competitiveness. Driven by technological innovation, the overall improvement in DSQ can be achieved.

However, the technology enhancement will generate additional beneficial investment. As the principals, TREs need to suitably consider the IR and IC. IR ensures the basic benefits of DSPs’ project participation, while the IC provides additional rewards on the DSQ improvement of the platform, prompting DSPs to continuously enhance the platform performance to meet the TREs’ marketing innovation and performance improvement requirements.

The cooperation benefit and cost of TRE and DSP

In the outsourcing process of digital platform development, TREs purchase digital marketing platform with a certain DSQ from DSPs with fixed payment and incentive reward. There are two kinds of constraints in cooperation as follows: IR and IC (Figure 8).

Figure 8.

Participants’ benefits and costs.

TREs’ benefit and cost composition

In the outsourcing cooperation, TREs are primarily responsible for supervising the DSP to deliver digital platform development services that meet quality standards. However, because of the asymmetric information, to avoid the moral hazard of DSPs, TREs often need to pay a certain amount of incentive fees in addition to the fixed payment.

Perceived value-added benefits

TREs’ value-added benefits are positive at the DSQ level. According to the diminishing marginal utility, when the DSQ reaches a certain level, the increase of r will no longer bring an additional increase in economic benefits, inducing that the growth rate of TREs’ value-added income tends to be flat. TREs’ psychological utility is influenced by the external competitive reference points as well. Thus, TREs’ perceived value-added benefits can be described as φ(P(r)).

Fixed purchase fee to the DSP

If the digital platform is accepted, TREs will need to pay a fixed fee B to the DSP, which can be regarded as a constant.

Cost-sharing incentive fees

When TREs perceive the additional benefit brought by the improved competitiveness of the digital platform delivered by the DSPs, they may be willing to pay additional DSQ incentive fee, ∅(r), encouraging the providers to continuously improve the digital service. The incentive fee, ∅(r), is positive with the DSQ level, r. ∂∅(r)∂r>0. However, the continuous increase of r will no longer bring additional increase in TREs’ economic benefits, inducing that the growth rate of the incentive fee, ∅(r), tends to be flat, ∂2∅(r)∂2r≤0. Cost-sharing incentive encourages DSPs to pay additional assurance cost because of the improvement of DSQ.

DSPs’ benefit and cost composition

In the outsourcing cooperation, DSPs are responsible for providing the digital platform development service that meets certain standards. Their income is generated from TREs’ fixed purchase price and cost-sharing incentive fee.

To provide a digital platform that meets the certain standards, the DSP needs to invest resources in the research and development process, such as the construction of development environment, the formation of research team, the purchase of development equipment, and costs of quality testing and cost of system maintenance. These DSQ-assurance costs CS(r) are related to the DSQ level of the digital platform. Let us suppose that CS(r) is a monotonically increasing function to DSQ, ∂CS(r)∂r>0, ∂2CS(r)∂2r>0.

“Principal-agent” model

In business relationships in a digital service supply chain, the TRE plays the role of a principal and authorizes a supplier to provide DSQ-satisfying services. In cooperation, there may exist different situations caused by different information asymmetry. The TRE and the DSP are performing the bargaining game about seizing the dominance of the digital service supply-chain transaction, which is directly related to their utility achievements and the equilibrium of the “principal-agent” problem. Let us assume that the TRE’s dominance weight is ω, ω∈[0,1], which is generally influenced by the competitive environment, cooperation strategy, and patent protection. Influenced by information asymmetry, the DSP can hide its DSQ-assurance investment and specific DSQ performance, which may harm the TRE’s comprehensive cooperation utility.

TRE is the buyer of digital marketing platform and expect effective control over outsourcing DSQ. To reduce the negative influence brought by asymmetry information, the TRE should design incentive solutions to induce the DSP into improving the DSQ. The purpose of incentive is to motivate the DSP to invest in proper DSQ-assurance resources, which can guarantee the optimal outsourcing DSQ and maximize the TRE’s perceived utility. Consequently, the optimal objective of the principal-agent model in the situation containing various information asymmetry contents is that the principal’s cooperative profit can reach the maximum, maximize{ωV[πT(r)]+(1−ω)V[πS(r)]}. In this study, the incentive objectives have been optimized, which not only include economic benefits but also take into account the influence of reference knowledge. Moreover, dynamic weights are set based on the TRE’s relative optimism toward different reference knowledge. The incentive objectives are transformed from single economic benefits to dynamic comprehensive utilities.

Additionally, to construct and maintain a business relationship between the TRE and the DSP, the following two kinds of constraints need to be considered:

Individual rationality constraint (IR)

The IR is known as the participation constraint, which ensures that a mutually beneficial cooperation can be established between a principal and its agent. In the digital service supply-chain cooperation, the IR means that the DSP’s revenue should not be less than its opportunity profit in the market according to its capability and reputation. In other words, the profit, when the DSP cooperates with the TRE, should exceed the maximum benefit when it cooperates with others. Let us assume that the TRE’s and the DSP’s opportunity profits are πT‾ and πS‾, respectively. Considering the principal’s psychological utility, the individual rationality constraint can be expressed as V[πT(r)]≥V[πT‾], V[πS(r)]≥V[πs‾].

Incentive compatibility constraint (IC)

The IC means the agent chooses its optimal behavior to pursue its maximum profit to maintain an efficient collaboration between the participants. Thus, the DSP selects its optimal DSQ-assurance capability, CS(r*), to maximize its profit, which can be obtained from ∂V[πS(r)]/∂r=0. Specially, assume that the DSP’s psychological utility depends only on its economic benefits, V[πS(r)]=πS(r).

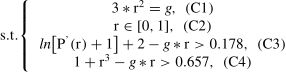
Based on the above analysis, the principal-agent model between the TRE and the DSP is as follows:

maximize{ωV[πS(r)]+(1−ω)V[πT(r)]},(obj−I)

In the above programming model, the objective is maximizing the total utility of the service supply chain. The TRE’s psychological utility is its perceived DSQ, V[πT(r)]=φ(P(r))−B−∅(r), which is influenced by external references and varying reference weights. The DSP’s utility equals its cooperative profit, V[πS(r)]=πS(r)=B−CS(r)+∅(r). In the objective, ω is the TRE’s dominance weight. If ω=1, the TRE occupies absolute information power and creates completely symmetric information situation. If ω=0, the DSP owns the absolute information advantage, and the TRE has to accept the consequence of adverse selection. If 0<ω<1, the TRE and the DSP are seizing the cooperative dominance. Larger ω means the TRE gets the larger discourse power to realize its optimal utility in advance.

Additionally, the achievement of the objective strictly comes from the feasible domain, which comprises several constraints: C1−C4. C1 is the DSP’s IC, which means that it initially realizes its maximum utility by selecting its optimal DSQ investment. C2 and C3 are the TRE and the DSP’s rationality constrains, respectively, which present their minimal utilities as the bottom line. C4 describes the standardized DSQ, which is located in the tolerance interval. When ω∈(0,1), there will be the bargaining game between the TRE and the DSP.

The participants’ dominance positions can lead to the different numbers of ω.

If the DSP completely dominates supply-chain transaction, ω=0. In the complete asymmetric information situation, the DSP takes absolute advantage of private cost information, such as operational costs, quality assurance expenditures, and profit margins. In this scenario, the DSP may exploit its private cost information and determine its minimum investment to maximize its own profit in priority. Meanwhile, the TRE is at a disadvantage position in the cooperation and suffers from the bad feeling of adverse selection. The TRE has to accept the minimum contract-satisfied outsourcing DSQ and only obtain the opportunity to profit.

If the TRE completely possesses cooperation dominance, ω=1, a mandatory contract can be designed to assure its optimal utility. In the scenario of complete information symmetry, both the TRE and the DSP are clear on operational costs, quality assurance measures, and market dynamics. This transparency allows the TRE to determine its most expected DSQ, and the DSP should ensure specific investment and performance standards. Consequently, the DSP may only receive opportunity profit, πS‾.

If neither participant can fully achieve dominance in the digital service supply-chain transaction, ω∈(0,1), the TRE and the DSP will engage in a bargaining game and chase for dominance, which directly influences the equilibrium of the principal-agent relationship. The partly asymmetric information creates a situation where the TRE may possess superior knowledge about market conditions and customer expectations, while the DSP may have insights into operational capabilities and cost structures. This divergence in information complicates the negotiation process, as the TRE seeks to establish contract terms that protect its interests, while the DSP aims to secure favorable conditions that allow for adequate profit margins. Consequently, the principal-agent model plays a critical role in navigating the complexities of this relationship, helping to identify mechanisms that mitigate potential conflicts of interest and align incentives between the TRE and the DSP.

Incentive solution design process

In the cooperation process, the DSP prioritizes determining the DSQ that can achieve its own best benefit because of the information advantage. Later, the TRE concerns the behavior of the DSP and its maximum perceived benefits by designing incentive measures to reach the equilibrium of both participants.

Step 1 (DSPs determine their optimal DSQ as the first-best): In cooperation, the increasing of DSQ indicates an increase in the assurance costs for the DSP, consequently, the DSP only provides a limited DSQ of digital services to maximize its own economic benefit. Let us assume that the first-best DSQ level determined by the DSP is r*, which can maximize DSP’s benefit. ∂V[πS(r)]∂r|r=r*=0.

Step 2 (TREs determine their optimal DSQ as the second-best): Let us assume that the TRE’s psychological utility will increase with an enhanced DSQ level, i.e., ∂V[πT(r)]∂r>0. Therefore, the TRE expects to obtain higher DSQ within the scope of the contract, in which IR (C3) is the hard constraint of the principal-agent model. When the TRE achieves its optimal psychological utility, there will be the second-best DSQ status r**, πS(r**)=πS‾, which can ensure all the constraints to be feasible. The TRE’s optimal DSQ level is not lower than that of the DSP, r**≥r*.

Step 3 (Bargaining equilibrium between the first-best and the second-best): Then, the DSQ equilibrium conditions are discussed according to the comparison between r* and r**.

  • (1)

    If the second-best DSQ level is equal to the first-best one, both participants can achieve their optimal benefit at the same DSQ. If so, the TRE no longer needs to adjust the payment condition. As a rational participant, the DSP will spontaneously provide a digital service at the level of r*, where r**=r*.

  • (2)

    If the first-best DSQ level is lower than the second-best one, the DSP is reluctant to provide a higher DSQ level because of the increase in the DSQ-assurance cost. In this situation, the TRE needs to adjust the payment and offer additional incentive to the DSP as a compensation for the additional cost of DSQ improvement. The incentive fee, ∅(r), can be positively linear and correlative to the DSQ level. The role of the incentive is to reduce the gap between the first-best and the second-best DSQs. Let Z=min{r**−r*} as the optimal objective, and the incentive fee, ∅(r), can be changed to maximize the TRE’s benefit, in which optimal incentive ratio can be calculated. The algorithm can be designed as shown in Figure 9.

    Figure 9.

    Algorithm flow chart.

Incentive solutions for improving DSQ in specific scenarios

As shown in Figure 10, Section 6.1 presents the condition of completely symmetric information, and the optimization on TRE’s psychological utility is discussed considering dual reference points. The incentive solution of “principal-agent” model in the condition of completely asymmetric information is analyzed in Section 6.2. In Section 6.3, the equilibrium of the transaction is explored under partly asymmetric information.

Figure 10.

Steps of incentive solutions in specific situation.

Incentive solution for improving the TRE’s DSQ in completely symmetric information situation

In the case of completely symmetric information, the TRE can directly observe the DSP’s DSQ-assurance investment and DSQ performance, which leads to TRE’s dominant position in the supply-chain cooperation. Through contractual agreement, the TRE can prioritize its optimal psychological utility without paying additional incentive costs. In this situation, the IR is a hard constraint, which ensures the cooperation can be realized. Concerning the impact of dual reference points and varying weights, the TRE’s psychological utility can be described as V[πT(r)]=φ(P(r))−B.

Theorem 1

Assume that there is r1*∈[0,1], the DSP’s economic benefit is equal to its opportunity benefit πS‾ and TRE achieves its optimal utility. Under completely symmetric information, the equilibrium of the transaction can be obtained at r1* concerning dual reference points.

Proof: As shown in Figure 6, TRE’s psychological utility is dynamically change due to the varying DSQ distance between the actual DSQ level and the reference level. According to the improvement of DSQ, TRE’s psychological utility will increase, ∂V[πT(r)]∂r>0. In symmetric information, TRE will prioritize maximizing its own utility due to the dominant position, in which DSP can only obtain the opportunity benefit πS‾. When r1*∈[0,1],the TRE reaches its optimal solution, i.e., r1**=r1*. Meanwhile, the DSP’s economic benefit is equal to its opportunity benefit πS‾, i.e., πS(r1*)=B−CS(r1*)=πS‾.

In the contract, the DSP will obtain the fixed fee, B, only when the deliver DSQ level, r, is no less than the specified level, r1*, i.e., r≥r1*. As the rational partner, the DSP pursues the higher economic profit and invests suitable assurance costs, which can also achieve the TRE’s optimal psychological utility, i.e. r1*=r1**. Proved.

According to the DSQ, r, the TRE can design a reward function, B, in a forcing contract to its supplier as

where πS˜ refers to the value which is sufficiently smaller than CS(r1*)+πS‾.

Incentive solution for improving the TRE’s DSQ in completely asymmetric information situation

In the completely asymmetric situation, the DSP has the entire advantage of private cost information, which brings the discourse power. The TRE does not know any information about the DSP’s assurance information and profit. If so, the DSP will take advantage of private information and guide the transaction direction. Specifically, the DSP can firstly realize its maximal utility by determining its optimal choice of the cooperation. Then the TRE has to passively accept the DSP’s optimal combination if its opportunity profit can be realized. Consequently, the incentive solution design process needs to be proposed.

Step 1: In the condition of completely asymmetric information, DSP has priority to maximize its own economic benefits due to its dominance position in the supply-chain cooperation. Due to πS(r)=∅(r)−CS(r)+B, then ∂V[πS(r)]∂r=∅′(r)−CS′(r). Assume there exists r2*∈[0,1], in which satisfies ∂V[πS(r)]∂r|r=r2*=0; When r∈[0,r2*),∂V[πS(r)]∂r>0; Whenr∈[r2*,1), ∂V[πS(r)]∂r<0.

Step 2: The TRE’s psychological utility is positive with the increase of DSQ level, i.e,.∂V[πT(r)]∂r>0. Assume there exists r2**∈[0,1], where TRE's psychological utility reaches the optimal value. In this situation, the IC(C3) is the hard constraint to ensure the realization of the supply-chain cooperation, i.e., πS(r2**)=B−CS(r2**)+∅(r2**)=πS‾. Obviously, r2**≥r2*.

Under fixed payments, the TRE can only obtain a DSQ with the level of r2* due to the DSP’s moral hazard, which leads to the requirement for incentive mechanism. The improvement of DSQ can be induced by the cost-sharing incentive function ∅(r).

Step 3: TRE needs to pay additional incentive fee,∅(r), to DSP as the cost-sharing compensation for the cost of DSQ improvement. Suppose that the incentive cooperative equilibrium is obtained at r2, ∂Z∂∅(r2)=0. Once πS(r2)=B−CS(r2)+∅(r2)≥πS‾, the incentive function ∅(r) can drive r2* closing to r2**. As r2* and r2** are the functions with ∅(r), let r2*=f*(∅(r)) and r2*=f**(∅(r)). If r2*=r2**, both TRE and DSP will achieve their optimal benefit at r2*=r2**. If so, one can obtain the expression of ∅(r) by solving f*(∅(r))=f**(∅(r)), the optimal incentive intensity can be calculated.

Additionally, due to differential competition intensity, different TREs may concern the incentive budgets as another kind of constrain, which can moderate the incentive effect. Suppose that a TRE’s incentive budget is ρ, performing as the incentive threshold. The incentive budget constrain can be expressed as ∅(r)≤ρ.

Incentive solution for improving the TRE’s DSQ in partly asymmetric information situation

In the partly asymmetric information situation, neither DSP nor TRE is dominant in the cooperation, which induces a game between the participants. DSP can hide part of the cost and benefit information in this condition, while the TRE can also capture part of the DSQ assurance cost of the DSP. The status of the TRE is better than that of incomplete information, but weaker than that of complete information.

Step 1: In the condition of partly asymmetric information, the DSP has priority to deciding the delivery DSQ due to its partly dominance position in the cooperation. Due to πS(r)=∅(r)−CS(r)+B, then ∂V[πS(r)]∂r=∅′(r)−CS′(r). Assume there exists r3*∈[0,1], in which satisfies ∂V[πS(r)]∂r|r=r3*=0; When r∈[0,r3*),∂V[πS(r)]∂r>0; Whenr∈[r3*,1), ∂V[πS(r)]∂r<0.

Step 2: In this situation, the TRE and DSP are competing for the dominance position in cooperation, which is mainly related to the degree of information symmetry situation. Based on Section 4, TRE’s perceived DSQ P(r) can be obtained. According to the degree of information, the goal of motivation can be drawn as V1(r)=(1−ω)V[πS(r)]+ωV[πT(r)]. Due to V[πT(r)]=πT[P(r)]=φ[P(r)]−B−∅(r), V[πS(r)]=πS(r)=B−CS(r)+∅(r). Then V1(r)=(1−ω)(B−CS(r)+∅(r))+ω{φ[P(r)]−B−∅(r)}.

In the case of partly symmetric information, the TRE can obtain part of the information such as DSQ assurance costs and economic benefits of DSP. Therefore, the information advantage of DSP is weaker than that of completely incomplete information but stronger than that of complete information, which resulting in r3** meets ∂V1(r3**)∂r3*=0. When r∈[0,r3**), ∂V1(r)∂r>0; When r∈[r3**,1), ∂V1(r)∂r<0.

Step 3: The TRE needs to pay additional incentive fee,∅(r), to the DSP as the cost-sharing compensation for the cost of DSQ improvement. The incentive function ∅(r) can drive r3* closing to r3**. As r3* and r3** are the functions with ∅(r), let r3*=S*(∅(r)) and r3**=S**(∅(r)). If r3*=r3**, both the TRE and the DSP will achieve their optimal benefit at r3*=r3**. If so, one can obtain the expression of ∅(r) by solving S*(∅(r))=S**(∅(r)), the optimal incentive intensity can be calculated.

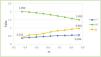
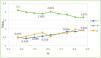
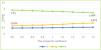
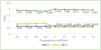
Numerical study and the result of the discussionBackground and data preparation

The study considered the following case to verify the proposed model in the stated conditions, which could demonstrate how external references could be integrated into a DSQ incentive framework. The assessment on the TRE’s perceived DSQ shows that the adoption of psychological utility can optimize the incentive goal and realize higher DSQ level under competitive environment. The prospect theory and the varying weight method were illustrated in Section 7.2 to analyze the influence of dual reference knowledge on the TRE’s perceived DSQ. A game-theoretic approach was utilized in Section 7.3 to examine cost-sharing incentive methods. A comparative analysis was conducted in Section 7.4 to evaluate different incentive models, and sensitivity analysis was applied in Section 7.5. Section 7.6 explores the influence of regional prosperity and enterprise scale on the incentive effect.

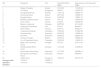
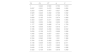
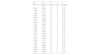
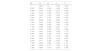
Let us consider the following example. As the TRE, the Jiebai group owned several offline shopping malls in Hangzhou city, Zhejiang province and met several business challenges in the digital economy, such as competition from online shopping, loss of precise consumer portrait, and inefficient marketing push. To enhance its DSQ, the Jiebai group cooperated with a DSP to develop a digital marketing platform. In the service supply chain, the Jiebai group was the principal and the DSP was the agent. During negotiation, they determined the development of KPIs in contract, such as CRR (unit: %), CAC (unit: million) and MC (unit: million), to aggregate the DSQ level. Through the analytic hierarchy process, the weights of CRR, CAC, and MC were determined as 0.4, 0.4, and 0.2, respectively. According to the results of the three-step design, the tolerance intervals of CRR, CAC and MC are determined as [10,30], [0.01,0.05] and [25,35], respectively, in which the corresponding target value is 30, 0.01, and 30. In Table 3, the raw information of KPIs, weights, tolerance intervals and target values are presented in the columns ①, ③, ④ and ⑤, respectively.

Through a marketing survey, a competitor’s and industrial service quality performances were treated as the external reference knowledge, which are listed the columns ⑥ and ⑧ of Table 3. According to Equation (1), the standardized level of competitors’ DSQ and industry average DSQ are illustrated in the columns ⑦ and ⑨ of Table 3.

Following the standardization process, the competitor’s standard DSQ and industry average standard DSQ can be calculated using Equation (1), with rc=0.62 and rh=0.24.

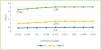
The influence of DSQ on the TRE’s comprehensive perceived DSQ

According to empirical data (Barberis, 2013), α=β=0.88,θ=2.25. Because rh

As r∈[0,1], the principal’s comprehensive perceived DSQ can be explored in the following three situations.

(1) Situation 1: The TRE’s actual DSQ is worse than both external reference levels (0≤r<0.24)

If rEquation (5), the optimistic coefficients of P1 and P2 are as follows:

Through Equation (6), the weights of dual reference points rh and rc are as follows:

Referring to Equation (7), the principal’s comprehensive perceived DSQ when 0≤r

which is shown as the blue part in Figure 11.

Figure 11.

The principal’s perceived DSQ under dual reference points.

If 0≤r<0.24, the principal’s received DSQ will be worse than external DSQ reference levels. Due to DSQ lags, P2IIλ1II. With the increase of r, received DSQ is close to rh and relieve the principal’s panic feeling on P1II, which causes the more obvious dominance of P2II. The varying weighting method fits the principal’s fluctuation psychological change caused by dynamic DSQ comparison.

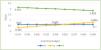
(2) Situation 2: The TRE’s actual DSQ is in the middle between external reference levels (0.24≤r<0.62)

In this situation, the principal’s received DSQ is in the middle of the industry average DSQ, rh, and the competitor’s DSQ, rc. The principal’s perceived DSQ includes positive feelings brought by leading on rh and negative feelings caused by lagging behind to rc.

According to Equation (5), optimistic coefficients of P1 and P2 are as follows:

As k1<0, although there is a positive perceived DSQ caused by rh, limited development prospects could reduce the principal’s good feeling. Due to k2>0, even if the perceived DSQ is negative concerning rc, expected future potential and possible developing acceleration could mitigate the principal’s bad feeling.

Consequently, the weights of dual reference points rh and rc can be obtained through Equation (13) as follows:

Referring to Equation (6), the principal’s comprehensive perceived DSQ when rh≤r

which can be described as the green part in Figure 11.

If 0.24≤r<0.62, the principal’s received DSQ will be better than the industrial reference level but worse than the competitor’s reference level. On the one hand, because r≥rh, the principal obtains the positive perceived DSQ from DSQ leading, P1III≥0. At the beginning, r=rh=0.24, P1III=0, the TRE pays complete attention to the competitor’s reference level, which results in the obvious dominance of P2III, λ2III=1. If r continuously increases, the positive perceived DSQ created by industrial reference will be enhanced, P1III>0, which can attract TRE’s intention to grant weight towards P1III. Additionally, the decrease in DSQ lag will relieve the TRE’s uncomfortable feeling, which directly reduces the dominance of λ2III.

(3) Situation 3: The TRE’s actual DSQ is better than both external reference levels (0.62≤r≤1)

If r>rh and r>rc, the received DSQ is higher than both the industry average DSQ and the competitor’s DSQ. The principal will obtain optimistic psychological feelings because of positive DSQ distance. According to Equation (5), the optimistic coefficients of P1 and P2 are as follows:

Although there is a positive perceived DSQ generated by rh and rc, there is a limited development space in principal’s mind due to k1<0 and k2<0.

Through Equation (6), the weights of dual reference points rh and rc are as follows:

Referring to Equation (7), the TRE’s comprehensive perceived DSQ is as follows:

which is shown as the purple part in Figure 11.

If 0.62≤r≤1, the principal’s received DSQ will not be worse than all the reference levels and create positive psychological utilities, P1I>P2I≥0. At the beginning, P2Istarts increasing from 0 and P1Ioccupies the dominant position, λ1I≫λ2I. Especially when r=rc=0.62, P2I=0, the principal’s comprehensive perceived DSQ is fully determined by P1I, λ1I=1. With the continuous increase of P2I, the principal will notice its enhanced contribution to comprehensive utility. The weight of P2I, λ2Iis increased. The gap between λ1I and λ2I is decreasing.

In summary, the complete perceived DSQ curve, shown in Figure 11, has three parts, exhibiting a positive association with its actual DSQ, r, which is consistent with previous research findings (Chai et al., 2023). However, the previous research mostly used the subjective weighting method to assign equal weight to each reference point (Wei et al., 2019; Uppari & Hasija, 2019; Zhong et al., 2022; Wang et al., 2020; Weingarten et al., 2019). The curve trend shows the difference because of the novel varying weighing method. The TRE’s comparative considerations on reference points are dynamically changing according to the real-time judgment on development, which leads to varying weights of reference points. By comparing the future development potential between the two reference points, the dominant role of reference points in the perceived DSQ is determined to reasonably describes the process of the TRE’s fluctuating psychological changes.

Cost sharing incentive method in digital service supply chain

In the digital service cooperation, if the TRE’s received DSQ level is r, the DSQ-added value φ(r)=ln[P(r)+1]+4. The fixed cost B=2, and the development cost CS(r)=r3+1, the cost-sharing fee ∅(r)=g*r. The TRE’s comprehensive utility is V[πT(r)]=ln[P(r)+1]+2and the DSP’s profit without incentive is πS(r)=1−r3.

Incentive solution for improving the TRE’s DSQ in completely symmetric information situation

Under dual reference points, when r∈[0,1], ∂V[πT(r)]∂r>0, which means the TRE’s perceived DSQ increases with the enhancement of DSQ level, r. However, the DSP will participate in the cooperation only if the economic benefits from participating in the cooperation at least reach its opportunity benefits, πS‾. Assume that πS‾=0.657. Let πS(r1*)=B−CS(r1*)=1−(r1*)3=0.657, that is r1*=0.7, g1=0. Because the TRE has absolute dominance, there is no need to design the incentive in the completely symmetric information situation. In this situation, the TRE can receive DSQ as 0.7 by providing the fixed payment. If so, the TRE’s competitive utilization is V[πT(r1)]=2.37.

Incentive solution for improving the TRE’s DSQ in completely asymmetric information situation

When the TRE only pays a fixed fee, πS(r)=1−r3,πT(r)=3r+1,∂V[πS(r)]∂r=−3r2. In this case, ∂V[πS(r)]∂r<0. The participation constraint is a hard constraint, V[πT(r)]=V[πT‾]. Assume there exists r2*‾∈[0,1], in which V[πT(r2*‾)]=V[πT‾]=0.178. Let ln[P(r)+1]+2=0.178, thenr2*‾=0.26, g2−=0.

In completely asymmetric information situation, the TRE can design linear cost-sharing incentive function as ∅(r)=g*r. Therefore, V[πS(r)]=g*r−r3+1, V[πT(r)]=ln[P(r)+1]+2−g*r.

Due to ∂V[πS(r)]∂r=g−3*r2, for r2*∈[0,1], ∂V[πS(r2*)]∂r2*=0. When r∈[0,r2*),∂V[πS(r2*)]∂r>0, When r∈[r2*,1), ∂V[πS(r2*)]∂r<0. Implemented the cost-sharing method, the TRE’s psychological utility is V[πT(r)]=ln[P(r)+1]+2−g*r.

Referring to Equation (8) the “principal-agent” model under incomplete information can be designed as:

The equilibrium solution of this model is obtained through Lingo. In the optimal condition, the cost-sharing ratio, g2=0.75, r2*=0.5, andV[πT(r2*)]=1.81.

Before incentive solution, the First-best will be obtained at r2*‾=0.26, in which the TRE’s and the DSP’s psychological utility are V[πT(r)]=0.178, V[πS(r)]=0.982, respectively. The comparison is presented in Table 4.

As shown in Table 4, through cost sharing incentive, the second-best will be obtained at r2*=0.5. The DSP will actively improve the DSQ level from r2*‾(0.26) to r2*(0.5), achieving an increase of 92.31%. The TRE’s psychologically utility is increased from 0.178 to 1.81, reaching a promotion of 916.85%. And the DSP’s psychologically utility is improved from 0.982 to 1.25, obtaining an elevation of 27.29%.

Optimal solution of the outsourcing cooperation under partly asymmetric information condition

In this situation, let V[πS(r)]=πS(r)=1−r3+g*r, V1(r)=(1−ω)V[πS(r)]+ωV[πT(r)] andω=0.4. The TRE’s perceived DSQ increases as the enhancement of the received DSQ level. In this situation,

The information advantage of the DSP is weaker than that of completely incomplete information but stronger than that of complete information, resulting in r3* meets ∂V[πS(r3*)]∂r3*=0. When r∈[0,r3*), ∂V[πS(r3*)]∂r3*>0; When r∈[r3*,1), ∂V[πS(r3*)]∂r3*<0. At the same time, the TRE’s psychological utility should not be lower than that in the completely asymmetric information condition, i.e. V[πT(r)]>1.81. Referencing to Equation (8) the “principal-agent” model under partly asymmetric information can be designed as

The equilibrium solution of this model is obtained through Lingo. The cost-sharing ratio, g3, is 0.554, r3*=0.643, and V[πT(r3*)]=2.015.

In summary, the comparison of incentive effects in different situations is shown in Table 5.

According to Table 5, high DSQ level, r1*=0.7, is achieved without additional incentive fees in the completely symmetric information situation, i.e. g1=0. In the asymmetric information, if no incentive fees, g2−=0, are given to the DSP, the delivered DSQ was at a low level as r2*‾=0.26. However, the DSQ level was significantly improved as r3*(0.643)>r2*(0.5)>r2*‾(0.26) after the implement of incentives. Especially, the DSQ levels in the asymmetric information are lower than that in the completely symmetric information, r1*, which is mainly caused by the TRE’s dominance position.

Comparison analysis

To aggregate the specific psychological utilities in different reference points, the subjective weighting method is commonly used by attaching fixed weights to different reference points (Wei et al., 2019; Uppari & Hasija, 2019; Zhong et al., 2022; Wang et al., 2020; Weingarten et al., 2019; Tu et al., 2022). However, the fixed weights failed to describe the principal’s psychological fluctuation in the dominance of reference points. Especially when r=ri, i=c,h, Vi=0, the principal will pay complete notice on another reference point by giving absolute dominant weight.

Comparison of the perceived DSQ

For example, Zhong introduced equal weights to dual reference points (Zhong et al., 2022), P′(r)=0.5P1+0.5P2, which is described as a red line in the absolute middle of P1 and P2. The result comparison between Zhong’s equal and dynamic weights proposed in this study provides the curve displays in Figure 12.

Figure 12.

Comparison of different psychological utility measurement method.

In the part of 0≤r<0.24, the comprehensive psychological utility PII(r) is flatter than P′(r). Due to P2II

In the part of 0.24≤r<0.62, the positive P1III is increasing from 0, which starts to play a role in comprehensive utility. Driven by the increase in positive P1III and its weight λ1III, PIII(r) is rapidly rising. Additionally, when r is closer to rh, DSQ gap d2 is eliminating and negative P2III is increasing up to 0, which causes the absolute dominance of P1III.

In the part of 0.62≤r≤1, both P1I and P2I are positive, P1I>P2I>0, which contributes to the increase of comprehensive utility. The principal determines the different weights on dual reference points according to future development prospects. Due to k2P′(r). With the gap between P2I and P1I is reducing, λ1I and λ2I are tending to equal condition.

Comparison of the optimal solutionIn the symmetric information situation

Under dual reference points, considering varying weights, r1*=0.7, g1=0, V[πT(r1)]=2.37. Similarly, for the fixed weights, λ1=λ2=0.5, the DSP’s IR is a hard constraint, and it will cooperate only if its actual benefit is not less than its opportunity benefits, πS‾. Therefore, the optimal solution is located at r1*′=0.7, g1′=0, V′[πT(r1)]=2.27. Because of the consideration of prospect, the TRE’s comprehensive utility increases.

In the completely asymmetric information situation

In a completely asymmetric information situation, considering the varying weight, the optimal solution can be obtained at r2*=0.47, g2=0.66, and V[πT(r2*)]=1.61. Similarly, when the fixed weights, λ1=λ2=0.5, the “principal-agent” model under incomplete information can be designed as follows:

The equilibrium solution of this model is obtained through Lingo. Using the fixed weights, the optimal solution is obtained at r2*′=0.47, g2′=0.66, and V′[πT(r2*)]=1.61.

In the partly asymmetric information situation

In a partly asymmetric information situation, considering the varying weight, the optimal solution can be obtained at r3*=0.643, g3=0.554, and V[πT(r3*)]=2.015. Similarly, when the fixed weights, λ1=λ2=0.5, the “principal-agent” model under incomplete information can be designed as

The equilibrium solution of this model is obtained through Lingo. Under fixed weights, the optimal solution is located at r3*′=0.62, g3′=0.94, and V′[πT(r3*)]=1.62. According to the result in Table 6, in the symmetric information situation, the optimal solution is obtained at the same DSQ level under the dual weighting method, which is mainly caused by the same hard constraint. However, although the DSQ level and cost-sharing ratio is equal, the TRE’s psychological utility is different, V[πT(r1)]>V′[πT(r1)], due to the consideration on the development potential. In the completely asymmetric information situation, the incentive ratio is lower than the situation under varying weights. However, the TRE’s psychological utility, V[πT(r2*)], is higher than that in fixed weight method, V′[πT(r2*)], which is consistent with the conclusion of the perceived DSQ comparison above.

In the partly asymmetric information situation, the DSQ level in the fixed weighting method is lower than that under varying weights, i.e., r3*>r3*′, which is is mainly caused by the impact of future development potential on the TRE’s psychological utility. In general, considering the varying weights, higher DSQ levels and psychological utility can be obtained with a lower incentive cost.

Sensitivity analysis on incentive effectSensitivity analysis of reference knowledge

Let us suppose that the industry-average reference level is fixed, rh=0.24 and rc>rh. The sensitivity analysis of the cost-sharing incentive ratio on the changing reference level can be conducted. In particular, when the reference level gradually changes 10% from 0.62, the set of rc values is obtained by increasing and decreasing it by 10%,20%, 30%,and 40%, respectively (rc=0.372, 0.434, 0.496, 0.558, 0.62, 0.744, 0.806, and 0.868). Repeating the incentive design process above, the optimal solution under different information situation can be obtained.

Symmetric information situation

In a completely symmetric information situation, referring to Theorem 1, the optimal solution is located where r1*=0.7, g1=0. If so, the TRE’s competitive utilization is V[πT(r1)]=2.37.

Similarly, repeating the steps, one can obtain the optimal solution under different information situations, shown in Table 7.

In completely symmetric information, the optimal DSQ is not related to the competitor’s reference level, which depends only on the DSP’s opportunity benefit πS‾. As the TRE handles the information advantage, it can directly observe the DSP’s DSQ investment and force the latter to choose its most expected level. In this situation, the TRE does not need to pay additional incentive fee.

Completely asymmetric information situation

When rc=0.558, rh=0.24, referring to Equation (8), the “principal-agent” model can be designed as

The equilibrium solution of this model is obtained through Lingo. In the optimal condition, the cost-sharing ratio, g2=0.288, r2*=0.31, and V[πT(r2*)]=1.874.

Similarly, repeating the above steps, one can obtain the optimal solution under different information situations when rc=0.372, 0.434, 0.496, 0.558, 0.62, 0.744, 0.806, and 0.868, respectively, which are shown in Table 8.

In completely asymmetric information situation, the DSQ equilibrium is positively correlated to the main competitor's reference level. Because the DSP absolutely handle the the information advantage, it can hide its DSQ investment. In this situation, the TRE needs to pay additional incentive fee to improve the DSQ level. The TRE’s comprehensive utility is negatively correlated to the main competitor's reference level, which is mainly due to the increasing incentive fee as the improvement of DSQ level.

As shown in Figure 13, influenced by the completely asymmetric information, the graphical trends illustrate the dynamic interplay among the competitive reference knowledge, rc, cooperative equilibrium, r2*, cost incentive coefficient, g, and the TRE’s comprehensive utility, V. As the reference knowledge, rc, increases, the blue curve exhibits a gradual upward trajectory with decelerating growth, indicating diminishing marginal improvement of DSQ regarding incentives on cooperation. Concurrently, the yellow curve rises sharply (from 0.415 to 0.961) reflecting the additional costs required to sustain cooperation. The interaction between these trends drives the green curve into a persistent decline (from 1.999 to 1.493), suggesting accelerated erosion of the TRE’s comprehensive utility by incentive costs. Therefore, the TRE needs to identify a reasonable competitive reference level to prevent the blind improvement in DSQ and pay more incentive costs, which may lead to a reduction in overall utility.

Figure 13.

Sensitivity analysis of rc in completely asymmetric information situation.

In partly asymmetric information situation

In partly asymmetric information situation, when rc=0.558, rh=0.24, referring to Equation (8), the “principal-agent” model can be designed as follows:

The equilibrium solution of this model is obtained through Lingo. The cost-sharing ratio, g3, is 0.278, r3*=0.513, and V[πT(r3*)]=2.114.

Similarly, repeating the above operations, we can obtain the optimal solutions under different information situations when rc=0.372, 0.434, 0.496, 0.558, 0.62, 0.744, 0.806, and 0.868, respectively, shown in Table 9.

In partly asymmetric information situation, the DSQ equilibrium and the TRE’s comprehensive utility are lower than that at the completely symmetric information situation but higher than that at the completely asymmetric information. The incentive equilibrium solution, r3*, and the TRE’s comprehensive utility, V[πT(r3*)], is primarily related to the bargaining power between the DSP and the TRE, where neither can prioritize their own utility. In this case, the DSP’s relative information advantage prioritizes its comprehensive utility in the incentive goal, resulting in an overall decline in the TRE’s comprehensive utility. Particularly, at a certain reference level (rc=0.62), the TRE’s incentive fee decreased because of participation constraints, resulting in a temporary rebound in its comprehensive utility.

As shown in Figure 14, the increase in competitive reference knowledge, rc, drives complex interactions among the cooperative equilibrium, r3*, cost incentive coefficient, g, and the TRE’s comprehensive utility, V. The adjustment of incentive cost, g, keeps nonlinear correlation to the competitive reference knowledge, rc, which is primarily caused by the TRE’s partly information advantage.

Figure 14.

Sensitivity analysis of rc in partly asymmetric information situation.

The sensitivity of r3* on the reference knowledge, rc, is characterized by non–monotonic fluctuations with an overall upward trend. In the initial stage (rc=0.372→0.496), the cooperative equilibrium, r3* drops from 0.495 to 0.434 and then rebounds to 0.496, reflecting short-term suppression of cooperation by competitive pressure. In the mid-phase (rc=0.558→0.744), the cooperative equilibrium, r3*, rises steadily to 0.836, indicating significant efficiency gains from incentives under moderate competition. In the late phase (rc>0.744), the growth of rc slows (0.836→0.925) as the surge in incentive fee offsetting the positive effects of competition. Overall, rc exhibits phase-specific optimization, but incentive efficiency diminishes under high competition intensity.

The sensitivity of V to the reference knowledge, rc, follows a “decline-brief rebound-accelerated decline” pattern. In the initial stage (rc=0.372→0.558), the TRE’s comprehensive utility, V, drops from 2.100 to 1.895 because of the rising incentive fee, which erodes its utility. In the mid-stage (rc=0.620), V briefly rebounds to 2.015, consistent with the dip in the incentive fee, g, suggesting transient efficiency gains from partly asymmetric information. In the late stage (rc>0.620), the incentive fee, g, rebounds sharply (up to 0.974), driving the TRE’s comprehensive utility down from 1.892 to 1.675. Overall, the TRE’s comprehensive utility, V, is dominated by the nonlinear fluctuations of incentive fee, where high competition intensity leading to the utility decreases because of prohibitive incentive costs.

Sensitivity analysis of the degree of information symmetry

To explore the influence of the degree of information symmetry on incentive effect, let ω increase from 0.1 to 0.9. Repeating the calculation process as ω=0.4, the corresponding excitation equilibrium solution can be obtained.

For example, whenω=0.1, the TRE’s perceived DSQ increases as the enhancement of the received DSQ level. V1(r)=0.9*(1−r3+g*r)+0.1{ln[P(r)+1]+2−g*r}.

Referencing to Equation (8) the “principal-agent” model under partly asymmetric information can be designed as follows:

The equilibrium solution of this model is obtained through Lingo. The cost-sharing ratio, g3, is 0.721, r3*=0.708, and V[πT(r3*)]=1.871.

In summary, the comparison of incentive effects in different situations is shown in Table 10.

According to Table 10, when ω is in the range of 0.1–0.3, r3* remains stable at 0.708, and the incentive fee keeps at 0.721 because both parties have limited information. The DSP occupies the dominance because of its larger weight. Asω increases, r3* decreases and, then, remains stable within a certain range and finally shows a small-scale changing trend. The reason is the TRE constantly adjusts its incentive strategy because of the change in its dominant power. The incentive fee decreases significantly when ω increases. When the degree of information symmetry is low, high incentives are needed to mobilize enthusiasm. However, when the degree of information symmetry increases, the TRE can guide the cooperation through a reasonable mechanism by virtue of its dominant power, and no high-level incentives are required.

Regarding on the TRE’s utility, when ω is lower than 0.3, due to the stability of the cooperation model and the incentive cost, the utility remains unchanged at 1.871. Asω increases, the TRE’s utility is positively related to the degree of information symmetry. The adjustment of the equilibrium solution and the decrease in the incentive cost enable the enterprise to better integrate resources, reduce costs and risks, and create more value. That is the reason of continuous promotion and increasing cooperation utility.

In the completely symmetric information situation, the TRE’s psychological utility V[πT(r1*)]=2.37, is higher than that in other situations, which is caused by its dominance position in the supply-chain cooperation. In completely asymmetric information situation, with the implementation of incentives, the TRE’s psychological utility, V[πT(r2*‾)], is gradually improved from 0.178 to 1.81. In particular, the TRE’s psychological utility, V[πT(r3*)], is higher than V[πT(r2*)], but lower than V[πT(r1*)], which is consistent with the TRE’s information advantage.

Sensitivity Analysis of geographic location

When the GDP of the targeted city is fluctuating compared to Hangzhou GDP, the prosperity coefficient, θj=gdpjgdpHangzhou, gradually changes from 1. Let the set of θjvalues increase and decrease by 10%,20%, 30%,and 40%, respectively (rhj=0.144, 0.168, 0.192, 0.216, 0.24, 0.264, 0.288, 0.312, and 0.336). Repeating the above incentive process, the optimal solution under different information situation can be obtained in the following situations.

Symmetric information situation

In the completely symmetric information situation, referring to Theorem 1, the optimal solution is determined by the DSP’s opportunity benefit πS‾, where r1*=0.7, g1=0. TRE's competitive utilization is V[πT(r1)]=2.37.

Similarly, one can obtain the optimal solution when rhj=0.144,0.168,0.192,0.216,0.24,0.264,0.288,0.312,and0.336, respectively (Table 11). In completely symmetric information, the optimal DSQ is not related to the prosperity coefficient, θj, which shows the validation of Theorem 1.

Completely asymmetric information situation

In this situation, when rh=0.24, rhj=90%rh=0.216, referring to Equation (8), the “principal-agent” model can be designed as follows:

The equilibrium solution of this model is obtained through Lingo. In the optimal condition, the cost-sharing ratio, g2=0.288, r2*=0.484, and V[πT(r2*)]=1.836.

Similarly, one can obtain the optimal solution under different information situations when rhj=0.372, 0.434, 0.496, 0.558, 0.62, 0.744, 0.806, and 0.868, respectively, which are shown in Table 12. The trends of equilibrium, incentive cost and the TRE’s utility are shown in Figure 15.

Figure 15.

The sensitivity influence of geographic location (completely asymmetric information).

As shown in Figure 15, influenced by the completely asymmetric information, the graphical trends illustrate the dynamic interplay of the prosperity coefficient, θj, cooperative equilibrium, r2*, incentive coefficient, g, and the TRE’s comprehensive utility, V. As the GDP of geographic location, θj, increases, the blue curve (equilibrium trend) exhibits a gradual upward trajectory with decelerating growth, indicating diminishing marginal improvement on the DSQ of incentives on cooperation. In addition to that, the yellow curve (incentive intensity) rises sharply (from 0.654 to 0.872), reflecting the additional costs required to maintain the cooperation. The interaction between these trends drives the green curve, the TRE’s utility trend, into a persistent decline (from 1.91 to 1.694), presenting the accelerated erosion of the TRE’s comprehensive utility influenced by the additional incentive cost.

To sum up, in a completely asymmetric information situation, the DSQ equilibrium is positively correlated to the prosperity coefficient, θj, because of the increasing industrial level in the prosperity area. In this situation, the TRE needs to pay an additional incentive fee to improve the DSQ level. The TRE’s comprehensive utility is negatively correlated to the prosperity coefficient, θj, because of the increasing incentive fee for improving the DSQ level.

In partly asymmetric information situation

In the partly asymmetric information situation, when rc=0.62, rhj=90%rh=0.216, referring to Equation (8), the “principal-agent” model can be designed as

The equilibrium solution of this model is obtained through Lingo. The cost-sharing ratio, g3, is 0.848, r3*=0.62, and V[πT(r3*)]=1.845.

Similarly, repeating the above operations, the optimal solutions under different situations can be gained when rhj=0.372,0.434,0.496,0.558,0.62,0.744,0.806,and0.868, respectively, shown in Table 13. The trends of changing equilibrium, incentive cost and TRE’s utility are shown in Figure 16.

Figure 16.

The sensitivity influence of geographic location (partly asymmetric information).

As shown in Figure 16, the cooperative equilibrium solutionr3*remains at 0.62 when θj ranges from 0.6 to 0.9, consistent with the competitive reference knowledge (rc=0.62). That indicates thatr3* is absolutely influenced by the competitive reference point during this range, and there is no obvious effect caused by varying θj∈[0.6,0.9]. When θj≥1, the increasing θj leads to the raise of industrial knowledge, and r3* jumps to 0.643and remains stable. In addition to that, the incentive fee, g, increases when θj∈[0.6,0.9] but drops sharply to 0.554when θj≥1 and remains constant. Additionally, the TRE’s comprehensive utility, V, decreases from 1.921 to 1.845 according to the increase in incentive ratio when θj∈[0.6,0.9]. When θj=1, because of the jump of r3* and the sharp drop in incentive fee, g, the TRE’s comprehensive utility, V, rises to 2.015. When θj>1, the TRE’s comprehensive utility decreases from 2.015 to 1.934, responding to the increase of θj, which is primarily caused by the DSQ lag.

To sum up, in partly asymmetric information, the prosperity coefficient, θj, does not directly affect the outcomes, including the incentive equilibrium solution, r3*, incentive ratio, g, and the TRE’s comprehensive utility, V. However, there is a turning point on trends. When the prosperity coefficient is lower than 1 (i.e., θj<1), the incentive equilibrium solution equals to the main competitor’s DSQ level. Moreover, when the prosperity coefficient is higher than 1 (i.e., θj>1), the TRE’s psychological utility is improved because of the improving DSQ and lower incentive fee.

Sensitivity analysis of firm size

When the scale of the targeted enterprise is fluctuating compared to that of the Jiebai group, the scale coefficient, ϑk=srksrJiebai, gradually changes from 1 . Let the set of values increase and decrease by 10%, 20%, 30%and 40%, respectively. The competitor’s reference level, rck=0.372,0.434,0.496,0.558,0.62,0.682,0.744,0.806 and 0.868, as shown in Table 14. The detailed analysis of equilibrium, incentive parameter, and the TRE’s utility are the same as shown in Section 7.5.1.

Sensitivity analysis of incentive budget

To consider the incentive budget’s impact on the TRE’s incentive solution, the incentive fee under the optimal solution, φ(ri*), can be used to set the constraint of incentive budget, ρ=φ(ri*), which can be treated as the incentive threshold.

When the incentive budget, ρ, gradually changes from the original optimallevel, φ(ri*). Let the set of ρ values increase and decrease by 10%, 20%, 30%and 40%, respectively. Repeating the above incentive process, the optimal solution under different information situation can be obtained in the following situations.

Symmetric information situation

In the completely symmetric information situation, referring to Theorem 1, the optimal solution is located at where r1*=0.7, g1=0. The TRE’s comprehensive utilization is V[πT(r1)]=2.37. Similarly, repeat the steps, we can obtain the optimal solution under different information situations can be shown in Table 15.

In the completely symmetric information situation, the optimal DSQ is not related to the incentive budget, in which the TRE need not to pay additional incentive fee because of the information advantage.

Completely asymmetric information situation

In this situation, when ρ=0.9*φ(r2*)=0.9*0.375=0.338, referring to Equation (8), the “principal-agent” model can be designed as follows:

The equilibrium solution of this model is obtained through Lingo. In the optimal condition, the cost-sharing ratio, g2=0.696, r2*=0.482, and V[πT(r2*)]=1.808.

Similarly, repeat the steps, we can obtain the optimal solution under different incentive budgets can be shown in Table 16. The trends of equilibrium, incentive cost and the TRE’s utility are shown in Figure 17.

Figure 17.

The sensitivity influence of incentive budgets (completely asymmetric information).

As shown in Figure 17, influenced by the completely asymmetric information, the graphical trends illustrate the dynamic interplay of the incentive budget, ρ, cooperative equilibrium, r2*, incentive coefficient, g, and the TRE’s comprehensive utility, V. When the incentive budget, ρ, is lower than the original level (i.e., ρ≤0.375), both the cooperative equilibrium solution, r2*, and the incentive ratio,g, will increase. The increasing incentive budget boosts the increase of the TRE’s comprehensive utility,V, from 1.761 to 1.81. Once the incentive budget,ρ, is higher than the original level (i.e., ρ>0.375), the cooperative equilibrium solution r2*=0.5, incentive ratio g=0.75, and the TRE’s comprehensive utility V=1.81, remain stable, indicating that the incentive budget’s impact on incentives becomes ineffective under such conditions.

To sum up, in a completely asymmetric information situation, when the incentive budget is changing lower than the optimal condition, the DSQ equilibrium will be positively correlated to the incentive budget. Once the incentive budget is enhanced more than the optimal condition, the DSQ equilibrium, incentive ratio, and the TRE’s comprehensive utility will keep stable, which equal to that at the original optimal level. Therefore, there is an optimal budget threshold for incentive when ρ=0.375, where the DSQ equilibrium, r2*, and the TRE’s optimal psychological utility, V, can be achieved at the lowest budget.

In partly asymmetric information situation

In partly asymmetric information, when ρ=0.9*φ(r3*)=0.9*0.356=0.322, referring to Equation (8), the “principal-agent” model can be designed as follows:

The equilibrium solution can be achieved through smart algorithms. In the optimization condition, the cost-sharing ratio g3=0.518, the equilibrium DSQ r3*=0.62, and the TRE’s utility is V[πT(r3*)]=2.034.

Similarly, repeating the above operations, we can obtain the optimal solutions, shown in Table 17. The trends of changing equilibrium, incentive cost and utility are shown in Figure 18.

Figure 18.

The sensitivity influence of incentive budget (partly asymmetric information).

As shown in Figure 18, when the incentive budget, ρ, increases from 0.214 to 0.498, the incentive ratio, g, is enhanced from 0.345 to 0.804. However, the incentive equilibrium solution, r3*, remains stable at 0.62, only when ρ=0.356, r3* has a small increase to the equilibrium point 0.643. In this situation, the TRE’s comprehensive utility, V, keeps decreasing from 2.142 to 1.855, inducing by the increasing incentive ratio, g, and stable DSQ level, r3*.

In summary, in a partly asymmetric information situation, the incentive ratio, g, is positively related to the incentive budget, ρ. However, the cooperative equilibrium solution, r3*, is almost unaffected by incentive budgets, primarily because the TRE and the DSP implement a bargaining game in partial asymmetric information. The TRE’s comprehensive utility, V, is negatively related to the incentive budget, ρ, which is primarily caused by the increasing incentive ratio as the raise of total cost.

Further discussions on the applications across regions

To extend the application across regions, 20 Chinese TREs are selected and their detailed information is shown in Table 18. The TREs’ sale revenue data are from the enterprises’ annual financial reports in 2023, and their location city GDP data are collected from National Bureau of Statistics in 2023. Comparing to benchmark TRE data and Hangzhou GDP, the prosperity coefficients and the scale coefficients can be calculated to the cross- regional applications of the incentive method.

The influence of geographic location on incentive effect

To extend the application from the current city Hangzhou to more targeted cities, prosperity coefficient, θj=gdpjgdpHangzhou, can be used to normalize the industrial reference knowledge in the city j. The external industrial reference in city j can be rhj=gdpjgdpHangzhourh.

Symmetric information situation

Based on the GDP of each region and Hangzhou, the prosperity coefficients, θj, of each region and the revised industrial reference knowledge are presented in Table 11. In a completely symmetric information situation, the optimal solution is determined by the DSP’s opportunity benefit πS‾, where r1*=0.7, g1=0, and V[πT(r1)]=2.37. Similarly, referring to Theorem 1, one can obtain the optimal solution when rhj at different levels, which are shown in Table 19.

According to the equilibrium DSQ, r1*, and incentive parameter, g, because the TRE absolutely exploits the information advantage, it can force the DSPs to take the basic opportunity benefit. The forcing contract can ensure that the optimal DSQ is not related to regional GDP and no additional incentive is needed.

Completely asymmetric information situation

Let us consider the Ningbo Zhongbai company in Ningbo city as an example. The GDP of Ningbo city is 15704.30 and the prosperity coefficients is 0.837. In this situation, when the adjusted industrial reference rhj=0.837*0.24=0.201 and competitor reference rc=0.62, referring to Equation (8), the “principal-agent” model can be designed as follows:

The equilibrium solution of this model is obtained through Lingo. In the optimal condition, the cost-sharing ratio, g2=0.668, r2*=0.472, and V[πT(r2*)]=1.856.

Similarly, one can obtain the optimal solutions in other cities. The equilibrium conditions are provided in Table 20. Because of the increasing regional GDPs, the industrial reference levels,rhj, will be raised as well, creating more serious marketing competition and reducing the TREs’ feelings on their DSQ levels. The trends of the equilibrium DSQ, r2*, incentive parameter, g, the TRE’s comprehensive utility, V, are shown in Figure 19, which have a clear relationship with the prosperity coefficient, θj.

  • 1)

    The equilibrium DSQ, r2*, and the incentive parameter, g, are positively related to regional GDP level. Because of the TRE’s participant constraint, V[πT(r)]≥V[πT‾], the increasing industrial reference improves its opportunity profit πT‾, which leads to the increasing equilibrium DSQ, r2*. To induce the DSP to provide higher DSQ, there should be more incentive intensity, and the incentive parameter, g, should be increased to maintain cooperation in more prosperous regions.

  • 2)

    The TRE’s comprehensive utility, V, is negatively related to regional GDP level. The increasing regional GDP improves the industrial reference level and reduces the TRE’s feeling on perceived DSQ. Higher regional GDP signifies a more developed industrial base and stronger market potential. However, the positive association is accompanied by the diminishing marginal effect. The incremental gains in cooperation stability slow down when θj reaches an advanced level. The increasing equilibrium DSQ, r2*, and the incentive parameter, g, greatly improve the TRE’s outsourcing payment, which imposes heavier cost burden and harms its cooperative utility. The TRE’s comprehensive utility, V, declines persistently from 2.011 to 1.368, which is caused by the growth rate of additional incentive costs exceeding the growth rate of cooperative equilibrium, r2*.

Figure 19.

The influence of the prosperity coefficient in completely asymmetric information.

The influence of firm size on incentive effort

To extend the application from the current enterprise to more targeted enterprises, the scale coefficient, ϑk, is used to adjust the competitor’s reference knowledge between the target enterprise, k, and the Jiebai group, where ϑk=srksrJiebai. The scale level considering the influence of company size as rck=ϑkrc=srksrJiebairc.

Symmetric information situation

Through the transformation of TREs’ sale revenue, the scale coefficients, ϑk, and the revised competitor reference levels are presented in Table 21. In a completely symmetric information situation, the optimal solution is determined by the DSP’s opportunity benefit πS‾, where r1*=0.7, g1=0, V[πT(r1)]=2.37. Similarly, referring to Theorem 1, one can obtain the optimal solution when rck is in different levels. In completely symmetric information, the optimal DSQ is not related to the prosperity coefficient, ϑk.

Completely asymmetric information situation

Let us consider Ningbo Zhongbai as an example. In this situation, when the sale revenue of 119030.84 is and its scale coefficient is 0.587. Its adjusted competitor reference rck=0.587*0.62=0.364 and the industrial reference rh=0.24. Referring to Equation (8), the “principal-agent” model can be designed as follows:

The equilibrium solution of this model is obtained through Lingo. In the optimal condition, the cost-sharing ratio, g2=0.389, r2*=0.360, and V[πT(r2*)]=2.000.

Repeating the above operation to the other TREs, one can obtain the optimal solutions with varying competitor references, rck, shown in Table 22. Because of increasing firm sizes, the TREs’ competitor references, rck will be improved and reduce TREs’ subjective feeling on their DSQ values. As shown in Figure 20, the trends of the equilibrium DSQ, r2*, incentive parameter, g, TRE’s comprehensive utility, V, have clear relationships with the scale coefficient, ϑk.

Figure 20.

The influence of the scale coefficient in completely asymmetric information.

The equilibrium DSQ, r2*, and the incentive parameter, g, exhibit positive correlation with the scale coefficient, ϑk. As the enlarged firm size leads to the increased competitor reference level, the TRE should change its focus on its competitor to reach better DSQ. Larger scale signifies a stronger market influence, more complex supply chain, and higher resource integration capability. To compete with a stronger rival, the TRE needs to improve the incentive intensity and induce the DSP to guarantee larger DSQ of the digital marketing platform.

The TRE’s comprehensive utility, V, has a negative relationship with scale coefficient, ϑk. The increasing firm size makes the TRE focus on a more powerful competitor, and the larger competitor reference directly reduces the TRE’s feeling on perceived DSQ. To keep comparative advantage, the TRE has to improve its requirements on DSQ level and incentive investment, which reduce its economic utility. The TRE’s comprehensive utility, V, declines persistently from 2.002 to 1.339, which is caused by the growth rate of additional incentive cost.

Conclusions, implications, and future workResearch conclusions

In the digital service supply chain, the DSP designs and develops the digital marketing platform for the TRE, trying to satisfy the latter’s digital requirements, such as data mining, business operations, and sales prediction. Regarding the trend of digital marketing transformation, the TRE’s perceived DSQ is greatly influenced by external reference knowledge, such as the main competitor’s DSQ and industrial DSQ. Regarding the service supply chain containing asymmetric information, the TRE lacks the information advantage and has to face the DSP’s adverse selection. Consequently, DSQ incentive solutions concerning external reference knowledge should be suitably exploded to regulate the DSP’s DSQ-assurance investment and eliminate the negative influence of information asymmetry.

This study contributes to the incentive mechanism in digital service supply chain influenced by external reference knowledge. In theoretical level, two Nobel Prize theories—the prospect theory and the principal-agent theory—are effectively integrated to explore the role of external reference knowledge on the utility equilibrium and incentive strategy. The introduction of the TRE’s psychological utility caused by external reference knowledge is the core driving force to evaluate the DSQ effect and future potential. The objective of the principal-agent model is updated to psychological utility, and the outcome of incentive strategy concerns external reference constraints. Regarding methodology, the study explores a dynamic varying weighting method to describe the optimistic preference and dynamic dominance of external references. The novel varying weighing method can overcome the rigidity of traditional fixed weighting approach. On a practical level, this study provides the incentive tools for TREs to appraise the DSQ level and design differential DSQ incentive strategies. The incentive effect can improve TREs’ psychological DSQ utility by mitigating the DSPs’ moral hazard under asymmetric information. The above theoretical, methodological, and practical explorations concerning the external reference knowledge not only fill gaps in revealing the psychological DSQ utility but also offer novel incentive method and practical tool to enhance the managerial ability in digital service supply chain.

Managerial implications

In the digital service supply chain, TREs outsource the digital marketing platform development missions to DSPs. A competitive digital marketing platform can precisely recognize potential customers, effectively develop online customer adherence, highly enhance social media influence, and consistently improve customers’ loyalty, which directly represents the enterprise’s core competitiveness. In a competitive environment, the DSQ benchmarks, such as competitor’s and industrial reference levels, directly reflect the competitive position of digital marketing platforms. In the outsourcing development process, the DSP utilizes private investment information and prioritizes and assures optimized benefit. Consequently, the TRE should design incentive solutions to reduce the negative influence brought by moral hazard and improve the DSQ of the digital marketing platform.

  • (1)

    The KPIs of DSQ should be appropriately selected according to digital marketing strategy. To obtain a differentiated competitive advantage, the KPIs of DSQ should be systematically determined per the aspect of digital development. In particular, customer centricity presents the value claim, and digital interaction refers to efficient communication channels. Digital trust and system reliability stand for the operational guarantee for sustainable development. Digital tangibles are the final goal for achieving competitive market advantages. In addition to that, the KPIs should be flexibly adjusted according to the competitive environment and development situation, such as firm size and the prosperity degree. In particular, small-scale enterprises in low-prosperity areas need to focus on “cost-efficiency KPIs”, such as customer retention rate, average transaction value, and conversion rate, to avoid resource dispersion. Large-scale enterprises in high prosperous regions need to strengthen the “technology leadership KPIs”, such as social media interaction and packet loss rate, to adjust the weights according to the regional prosperity coefficient.

  • (2)

    Competitive benchmarks should be reasonably determined according to the prosperity coefficient and scale coefficient fitting the enterprise's own development status. According to the Kano model, in less prosperous regions or for small-scale enterprises, the industry reference level should be adjusted based on the average industry level as a foundational “survival benchmark” to ensure basic competitiveness, with key indicators (e.g., customer retention rate and conversion rate) aligned with regional practical conditions. In moderately prosperous regions or for benchmark-scale enterprises, the benchmark should be elevated to a “synergy benchmark” that integrates both industry-average competitiveness and emerging technological application targets (e.g., social media interaction metrics), positioning the enterprise in the upper-middle level of the industry. In highly prosperous regions or for large-scale enterprises, a “leading benchmark” is required to ensure that the core indicators (e.g., data transmission efficiency and user-generated content volume) should surpass major competitors by a reasonable margin, reflecting technological leadership and market dominance. For TREs, establishing a dynamic database of digital marketing benchmarks categorized by regional prosperity and enterprise scale is critical for selecting reference knowledge and formulating development strategies, ensuring that the DSQ benchmark process fully considers both environmental characteristics and internal capabilities.

  • (3)

    Varying weights should be adopted to reflect the dynamic dominance of external references. In the digital economy and mobile Internet era, emerging digital marketing technologies are being continuously developed, such as live-streaming, virtual reality, AI, and metaverse. The frontier mode has significantly pushed forward digital marketing, which creates dynamic benchmarks. The conventional approach of fixed weighting should be discarded. The dominance of reference points should be dynamically modified in light of the fluctuating levels. The development potential should be highly considered, closely related to the principal’s optimism about future development. In particular, when comprehensively considering the influence of dual reference knowledge, if the TRE is lagging in the industry, it is more optimistic about the development prospects of the industrial reference level, and inducing the utility under this reference point should be encouraged. If the TRE’s DSQ level is higher than the industrial reference level but lower than that of the main competitor, it is relatively optimistic about the reference points with large future development space and should give greater weight in the comprehensive effect. If the TRE’s DSQ level is in a competitively advantageous position, the future development trend under the industrial reference point is relatively optimistic, and a higher weight should be powered by the industrial reference knowledge.

  • (4)

    Monitoring measures should be implemented to reduce the degree of information asymmetry. In the principal-agent relationship, asymmetry information enables the agent to hide some key information as private information, such as schedule arrangement, resource investment, and quality assurance. The DSP will use its private information and prioritize obtaining the cooperative benefit. By reaching the minimum requirement in the contract, the DSP’s adverse selection behavior will harm the principal’s interest. As an effective data storage, a robust information system should be constructed to monitor and collect the outsourcing data in the cooperation process in several dimensions. The process data include the project information, operation records, and process details, resource investment, and important achievements in milestones. Moreover, compulsory rules in the information system should be designed to supervise the DSP’s development process. Only all the information meeting the standard in previous milestones can trigger the following workflow, which can reduce the information asymmetry in the outsourcing process.

  • (5)

    Incentive solutions should be explored to induce the DSP improving its DSQ according to different supply-chain cooperation dominance and development situations. To control the DSQ provided by suppliers as a beforehand strategy, the TRE needs to design incentive and assurance provisions in contracts. As a rational participant, the DSP will select its suitable DSQ-assurance investment, and incentive plays a guidance role in reaching mutual benefits. Especially in the digital service supply-chain having asymmetric information, the TRE does not have an information advantage and may face a moral hazard. Therefore, it is advisable for the TRE to design effective incentive contracts to govern the suppliers’ DSQ-assurance activities and encourage them to produce the digital service with optimum competitiveness, which can reduce the negative influence brought by asymmetric information. In particular, for the small-scale TREs in less prosperous regions, a conservative reference and lower incentive cost can meet local market cost needs effectively. Medium-scale TREs in moderately prosperous areas should pursue a balanced reference and invest in a medium incentive fee to enhance competitiveness. Large-scale TREs in high prosperous regions can choose to lead references and invest in competitive incentive fees to achieve higher DSQ and maximize utility, with strict monitoring in contracts to ensure effectiveness.

Research limitations and future work

Because of differential marketing environment, different marketing companies have varying development emphasis on digital marketing platform. The DSQ assessment requirements are diverse in indicators and external references. Although this study explores a novel DSQ assessment and incentive solutions, the lack of extensive industrial applications in broader geographical contexts is its primary limitation. First, the multi-case comparisons should be expanded to show wider scalability and deep validity. Future research can collaborate with industry associations to collect updated cross-regional panel data. The data collection cycle will be operated in semi-annual period, starting with a pilot phase targeting enterprises in the Yangtze River Delta (Shanghai, Zhejiang, Jiangsu) and Pearl River Delta (Guangdong) regions to capture data on DSQ metrics and industrial and main competitor benchmarks. In the second phase, coverage will expand to central China (Wuhan, Chongqing) and coastal provinces (Fujian, Shandong), while the third phase will integrate data from northwest and northeast regions to form a national representative database. More variables should be considered to reveal the effects of external factors, such as geographic location, development stage, enterprise size, and marketing competition, to enhance the framework generalization. Second, the DSQ indicators originate from the current technology-driven understanding, which may not be complete in forthcoming development of AI. With the emerging digital technologies, the indicator system needs to be continuously updated. The external reference level is strictly determined by a certain value in the study. However, in reality, because of business secrets and information asymmetry, it is very difficult to obtain an exact value. In the future, the uncertain reference and its influence should be explored. Tables 1–22

Table 2.

Some Indicators of DSQ.

Dimension  First-grade indicators  Second-grade indicators  Equation  Quality Characteristics  Sources 
Digital Tangibles  Functionality  Traffic  Number of registered members  L type  (Chan et al., 2020; Melović et al., 2021
    Time Spent on Page Visit  The time that users spend browsing the web  N type  (Chan et al., 2020; Si et al., 2015
    Customer Information Assets  The amount of customer information  L type  (Chan et al., 2020; Varadarajan, 2020
  Efficiency  Member Increase  Ne−Ns  L type  (Liu et al., 2022; Varadarajan, 2020 
    Conversion Rate  ConversionfrequencyTotalvisitors  L type  (Melović et al., 2021; Morgan et al., 2022; Mintz et al., 2021
Digital Trust  Data Integrity  Packet Loss Rate  LosspocketsTotalpockets  S type  (Skaka-Čekić & Baraković Husić, 2023; Huang et al., 2018; Alnawas and Al Khateeb, 2022
  Service Availability  Transmission Delay  ChannellengthTransmissionrate  S type  (Skaka-Čekić & Baraković Husić, 2023; Huang et al., 2018; Alnawas & Al Khateeb, 2022)
    Throughput  Input/OutputTotalseconds  L type  (Chan et al., 2020; Liu et al., 2022; Mintz et al., 2021
Digital Interaction  Collaboration  Social Media Interaction  Number of cooperation social media  L type  (Chan et al., 2020; Morgan et al., 2022; Saura, 2021
    Brand Mentions  Number of brand mentions  L type  (Chan et al., 2020; Melović et al., 2021
  Mobile Communication  User-generated Content  Number of user-generated content  L type  (Babić et al., 2020
Customer Centricity  Customer Insights  Average Transaction Value  TotalsalesTotalordervolume  L type  (Huang et al., 2018
    Customer Retention Rate  (Ne−Na)/Ns  L type  (Melović et al., 2021
    Customer Churn Rate  Nc/Nt  S type  (Järvinen & Karjaluoto, 2015
  Customer Segmentation  Frequency  Number of purchases a customer makes in a period  L type  (Si et al., 2015
    Recency  Last purchase interval  S type  (Si et al., 2015
    Monetary  Total amount spent by a customer in a period  L type  (Melović et al., 2021; Mintz et al., 2021
Reliability  Operational Efficiency  Return on Marketing Investment  MarketingrevenueMarketingInvestment  S type  (Järvinen & Karjaluoto, 2015
    Marketing Cost  Total cost of the marketing activities  N type  (Melović et al., 2021; Mintz et al., 2021
    Customer Acquisition Cost  SC+St+Ss+So  S type  (Si et al., 2015
  Market Performance  International Market Share  Company's sales/Global market sales  L type  (French, 2017
    Trade Competitiveness  Export value-Import value/Export value+Import value  L type  (French, 2017
    Revealed Comparative Advantage  (CE/TCE)*(TGE/GE)  L type  (French, 2017
Table 3.

Service quality requirement and performance information.

KPI ①  Type ②  Weight ③  Tolerance interval ④  Optimal target value ⑤  Competitor’s DSQIndustry average DSQ
          Actual DSQ ⑥  Standard DSQ ⑦  Actual value ⑧  Standard DSQ ⑨ 
CRR  0.4  [10,30]  30  25  0.75  15  0.25 
CAC  0.4  [0.01,0.05]  0.01  0.03  0.5  0.04  0.25 
MC  0.2  [25,35]  30  32  0.6  34  0.2 
Table 4.

Incentive effect analysis in the completely asymmetric information situation.

Completely asymmetric information  Fixed fee  Cost-sharing incentive  Increase rate 
r2*‾=0.26  r2*=0.5  92.31% 
V[πT(r)]  V[πT(r2*‾)]=0.178  V[πT(r2*)]=1.81  916.85% 
V[πS(r)]  V[πS(r2*‾)]=0.982  V[πS(r2*)]=1.25  27.29% 
Table 5.

Incentive effect and cost sharing ratio under different scenarios.

Scenario  Completely symmetric information  Completely asymmetric information without incentive  Completely asymmetric information under incentive  Partly asymmetric information under incentive 
r1*=0.7  r2*‾=0.26  r2*=0.5  r3*=0.643 
V[πT(r)]  V[πT(r1*)]=2.37  V[πT(r2*‾)]=0.178  V[πT(r2*)]=1.81  V[πT(r3*)]=2.015 
g1=0  g2−=0  g2=0.75  g3=0.554 
Table 6.

Incentive effect comparison of different weighting methods.

Scenario  Completely symmetric informationCompletely asymmetric information under incentivePartly asymmetric information under incentive
  Fixed weight  Varying weight  Fixed weight  Varying weight  Fixed weight  Varying weight 
r1*′=0.7  r1*=0.7  r2*′=0.47  r2*=0.5  r3*′=0.62  r3*=0.643 
V[πT(r)]  V′[πT(r1)]=2.37  V[πT(r1)]=2.37  V′[πT(r2*)]=1.61  V[πT(r2*)]=1.81  V′[πT(r3*)]=1.62  V[πT(r3*)]=2.015 
g1′=0  g1=0  g2′=0.66  g2=0.75  g3′=0.94  g3=0.554 
Table 7.

Optimal solutions caused by changing rc in symmetric information situation.

rc  40% decrease  30% decrease  20% decrease  10% decrease  0.62  10% increase  20% increase  30% increase  40% increase 
r1*  0.7  0.7  0.7  0.7  0.7  0.7  0.7  0.7  0.7 
2.37  2.37  2.37  2.37  2.37  2.37  2.37  2.37  2.37 
Table 8.

Optimal solution by changing rc in completely asymmetric information situation.

rc  0.372  0.434  0.496  0.558  0.62  0.682  0.744  0.806  0.868 
r2*  0.372  0.413  0.441  0.467  0.5  0.524  0.537  0.554  0.566 
0.415  0.565  0.583  0.654  0.75  0.824  0.865  0.921  0.961 
1.999  1.973  1.929  1.874  1.810  1.738  1.661  1.581  1.493 
Table 9.

Optimal solutions caused by changing rc in partly asymmetric information.

rc  0.372  0.434  0.496  0.558  0.620  0.682  0.744  0.806  0.868 
r3*  0.495  0.434  0.496  0.558  0.643  0.708  0.836  0.843  0.925 
0.464  0.551  0.674  0.783  0.554  0.721  0.733  0.974  0.910 
2.100  1.984  1.932  1.895  2.015  1.892  1.844  1.688  1.675 
Table 10.

Incentive effect and cost sharing ratio under different ω.

ω  0.1  0.2  0.3  0.4  0.5  >0.6  0.7  0.8  0.9 
r3*  0.708  0.708  0.708  0.643  0.62  0.62  0.62  0.621  0.679 
V[πT(r)]  1.871  1.871  1.871  2.015  2.170  2.355  2.355  2.359  2.368 
0.721  0.721  0.721  0.554  0.3 
Table 11.

Optimal solutions caused by changing θj under symmetric information situation.

θj  0.6  0.7  0.8  0.9  1  1.1  1.2  1.3  1.4 
rhj  0.144  0.168  0.192  0.216  0.24  0.264  0.288  0.312  0.336 
r1*  0.7  0.7  0.7  0.7  0.7  0.7  0.7  0.7  0.7 
2.37  2.37  2.37  2.37  2.37  2.37  2.37  2.37  2.37 
Table 12.

Optimal solutions caused by changing θj in completely asymmetric information.

θj  0.6  0.7  0.8  0.9  1  1.1  1.2  1.3  1.4 
rhj  0.144  0.168  0.192  0.216  0.24  0.264  0.288  0.312  0.336 
r2*  0.467  0.475  0.483  0.484  0.5  0.506  0.525  0.532  0.539 
0.654  0.677  0.699  0.703  0.75  0.768  0.827  0.849  0.872 
1.91  1.886  1.861  1.836  1.810  1.783  1.751  1.723  1.694 
Table 13.

Optimal solutions caused by changing θj in partly asymmetric information situation.

θj  0.6  0.7  0.8  0.9  1  1.1  1.2  1.3  1.4 
rhj  0.144  0.168  0.192  0.216  0.24  0.264  0.288  0.312  0.336 
r3*  0.62  0.62  0.62  0.62  0.643  0.643  0.643  0.643  0.643 
0.804  0.819  0.834  0.848  0.554  0.554  0.554  0.554  0.554 
1.921  1.897  1.872  1.845  2.015  1.987  1.971  1.953  1.934 
Table 14.

Optimal solutions caused by changing ϑk in symmetric information situation.

ϑj  0.6  0.7  0.8  0.9  1  1.1  1.2  1.3  1.4 
rck  0.372  0.434  0.496  0.558  0.62  0.682  0.744  0.806  0.868 
Table 15.

Optimal solutions caused by ρ in symmetric information situation.

ρ  40% decrease  30% decrease  20% decrease  10% decrease  ρ=φ(ri*)  10% increase  20% increase  30% increase  40% increase 
r1*  0.7  0.7  0.7  0.7  0.7  0.7  0.7  0.7  0.7 
2.37  2.37  2.37  2.37  2.37  2.37  2.37  2.37  2.37 
φ′(r) 
Table 16.

Optimal solutions caused by ρ in symmetric information situation.

ρ40% decrease  30% decrease  20% decrease  10% decrease  ρ= 0.37510% increase  20% increase  30% increase  40% increase 
0.225  0.263  0.3  0.338  0.413  0.45  0.488  0.525 
0.534  0.591  0.646  0.696  0.75  0.75  0.75  0.75  0.75 
r2*  0.422  0.444  0.464  0.482  0.5  0.5  0.5  0.5  0.5 
1.761  1.783  1.804  1.808  1.81  1.81  1.81  1.81  1.81 
Table 17.

Optimal solutions caused by caused by ρ in partly asymmetric information.

ρ40% decrease  30% decrease  20% decrease  10% decrease  ρ= 0.37510% increase  20% increase  30% increase  40% increase 
0.214  0.245  0.285  0.322  0.392  0.427  0.463  0.498 
0.345  0.395  0.46  0.518  0.554  0.632  0.689  0.747  0.804 
r3*  0.62  0.62  0.62  0.62  0.643  0.62  0.62  0.62  0.62 
2.142  2.110  2.070  2.034  2.015  1.964  1.928  1.893  1.855 
Table 18.

The TREs’ sale revenue data and urban GDP in 2023.

NO  Enterprise  City  City GDP (Billion RMB)  Sale revenue (Ten thousand RMB) 
Ningbo Zhongbai  Ningbo  15704.30  119030.84 
Lifu Group  Xianggang  3808.10  134897.50 
Zhongshang Group  Nanjing  17421.00  249697.27 
Hanshang Group  Wuhan  20012.00  138960.13 
Dongbai Group  Fuzhou  12928.00  188607.16 
Marketing Dajiang Group  Hainan  7551.18  140000.95 
Huijia Times  Urumqi  4168.46  249420.53 
Maoye Commercial  Chengdu  22075.00  241194.33 
Huaguang Commercial  Jian  2735.07  606542.7 
10  Gofun Group  Lanzhou  3487.00  96962.74 
11  Tongcheng Holdings  Changsha  12332.00  213286.99 
12  Shenzhen Seg  Shenzhen  34606.00  194906.55 
13  Renrenle  Shenzhen  34606.00  285267.95 
14  Hualian Holdings  Beijing  43760.70  109946.23 
15  You-A Department Store  Changsha  14332.00  134245.19 
16  Better Life Commerce Group  Xiangtan  2741.84  310114.33 
17  Wenfeng Great World Chain  Nantong  11813.30  216565.63 
18  New Huadu Retail Group  Quanzhou  12172.33  282392.16 
19  Zhongxing Commercial Group  Shenyang  8122.00  80994.67 
20  Jiebai Group  Hangzhou  18753.07  202731.78 
Average value  15156.47  195288.17     
Standard deviation  11470.14  115188.81     
Table 19.

Optimal solutions under symmetric information situation.

θj  rhj  r1* 
0.240  0.7  2.37 
0.837  0.201  0.7  2.37 
0.203  0.049  0.7  2.37 
0.929  0.223  0.7  2.37 
1.067  0.256  0.7  2.37 
0.689  0.165  0.7  2.37 
0.403  0.097  0.7  2.37 
0.222  0.053  0.7  2.37 
1.177  0.283  0.7  2.37 
0.146  0.035  0.7  2.37 
0.186  0.045  0.7  2.37 
0.658  0.158  0.7  2.37 
1.845  0.443  0.7  2.37 
1.845  0.443  0.7  2.37 
2.334  0.560  0.7  2.37 
0.764  0.183  0.7  2.37 
0.146  0.035  0.7  2.37 
0.630  0.151  0.7  2.37 
0.649  0.156  0.7  2.37 
0.433  0.104  0.7  2.37 
Table 20.

Optimal solutions under completely asymmetric information situation.

θj  rhj  r2* 
0.240  0.500  0.750  1.810 
0.837  0.201  0.472  0.668  1.852 
0.203  0.049  0.457  0.627  1.998 
0.929  0.223  0.492  0.726  1.832 
1.067  0.256  0.503  0.759  1.792 
0.689  0.165  0.474  0.674  1.889 
0.403  0.097  0.471  0.666  1.954 
0.222  0.053  0.458  0.629  1.995 
1.177  0.283  0.488  0.714  1.759 
0.146  0.035  0.453  0.616  2.011 
0.186  0.045  0.456  0.624  2.002 
0.658  0.158  0.472  0.668  1.896 
1.845  0.443  0.557  0.931  1.562 
1.845  0.443  0.557  0.931  1.562 
2.334  0.560  0.592  1.051  1.368 
0.764  0.183  0.480  0.691  1.871 
0.146  0.035  0.453  0.616  2.011 
0.630  0.151  0.470  0.663  1.903 
0.649  0.156  0.471  0.666  1.898 
0.433  0.104  0.454  0.618  1.949 
Table 21.

Optimal solutions under symmetric information situation.

ϑk  rck  r1* 
0.24  0.7  2.37 
0.587  0.364  0.7  2.37 
0.665  0.413  0.7  2.37 
1.232  0.764  0.7  2.37 
0.685  0.425  0.7  2.37 
0.930  0.577  0.7  2.37 
0.691  0.428  0.7  2.37 
1.230  0.763  0.7  2.37 
1.561  0.968  0.7  2.37 
1.190  0.738  0.7  2.37 
0.478  0.297  0.7  2.37 
1.052  0.652  0.7  2.37 
0.961  0.596  0.7  2.37 
1.407  0.872  0.7  2.37 
0.542  0.336  0.7  2.37 
0.662  0.411  0.7  2.37 
1.530  0.948  0.7  2.37 
1.068  0.662  0.7  2.37 
1.393  0.864  0.7  2.37 
0.400  0.248  0.7  2.37 
0.587  0.364  0.7  2.37 
Table 22.

Optimal solutions under completely asymmetric information situation.

ϑk  rck  r2* 
0.620  0.5  0.750  1.810 
0.587  0.364  0.360  0.389  2.000 
0.665  0.413  0.398  0.475  1.984 
1.232  0.764  0.539  0.872  1.638 
0.685  0.425  0.409  0.502  1.978 
0.930  0.577  0.481  0.694  1.855 
0.691  0.428  0.418  0.524  1.975 
1.230  0.763  0.538  0.868  1.639 
1.561  0.968  0.604  1.094  1.339 
1.190  0.738  0.525  0.827  1.671 
0.478  0.297  0.302  0.274  1.996 
1.052  0.652  0.505  0.765  1.775 
0.961  0.596  0.494  0.732  1.834 
1.407  0.872  0.581  1.013  1.486 
0.542  0.336  0.326  0.319  2.001 
0.662  0.411  0.396  0.470  1.985 
1.530  0.948  0.594  1.059  1.371 
1.068  0.662  0.511  0.783  1.763 
1.393  0.864  0.576  0.995  1.498 
CRediT authorship contribution statement

Jingjing Hao: Supervision, Project administration, Methodology. Xin Zou: Writing – original draft, Software, Formal analysis, Conceptualization. Yufeng Chen: Supervision, Resources, Conceptualization. Yuan Liu: Writing – review & editing, Resources, Investigation, Funding acquisition.

Acknowledgement

The relevant researches done in this paper are supported by National Natural Science Foundation of China (No. 72071181, No.72174180), Natural Science Foundation of Zhejiang Province (No. LY21G020004), Major Projects of the Key Research Base of Humanities Under the Ministry of Education (No.22JJD790080).

References
[Agnihotri, 2020]
R. Agnihotri.
Social media, customer engagement, and sales organizations: A research agenda.
Industrial Marketing Management, 90 (2020), pp. 291-299
[Alnawas and Al Khateeb, 2022]
I. Alnawas, A. Al Khateeb.
Developing and validating a multidisciplinary scale of E-retailing website elements.
Journal of Retailing and Consumer Services, 66 (2022),
[Anand and Goyal, 2019]
K.S. Anand, M. Goyal.
Ethics, bounded rationality, and IP sharing in IT outsourcing.
Management Science, 65 (2019), pp. 5252-5267
[Azemi et al., 2022]
Y. Azemi, W. Ozuem, R. Wiid, A. Hobson.
Luxury fashion brand customers’ perceptions of mobile marketing: Evidence of multiple communications and marketing channels.
Journal of Retailing and Consumer Services, 66 (2022),
[Babić Rosario et al., 2020]
A. Babić Rosario, K. De Valck, F. Sotgiu.
Conceptualizing the electronic word-of-mouth process: What we know and need to know about eWOM creation, exposure, and evaluation.
Journal of the Academy of Marketing Science, 48 (2020), pp. 422-448
[Barakabitze et al., 2019]
A.A. Barakabitze, N. Barman, A. Ahmad, S. Zadtootaghaj, L. Sun, M.G. Martini, L. Atzori.
QoE management of multimedia streaming services in future networks: A tutorial and survey.
IEEE Communications Surveys & Tutorials, 22 (2019), pp. 526-565
[Barberis, 2013]
N.C. Barberis.
Thirty years of prospect theory in economics: A review and assessment.
Journal of Economic Perspectives, 27 (2013), pp. 173-196
[Büyüközkan et al., 2020]
G. Büyüközkan, C.A. Havle, O. Feyzioğlu.
A new digital service quality model and its strategic analysis in aviation industry using interval-valued intuitionistic fuzzy.
AHP. Journal of Air Transport Management, 86 (2020),
[Chai et al., 2023]
N. Chai, W. Zhou, Z. Jiang.
Sustainable supplier selection using an intuitionistic and interval-valued fuzzy MCDM approach based on cumulative prospect theory.
Information Sciences, 626 (2023), pp. 710-737
[Chakraborty et al., 2019]
T. Chakraborty, S.S. Chauhan, M. Ouhimmou.
Cost-sharing mechanism for product quality improvement in a supply chain under competition.
International Journal of Production Economics, 208 (2019), pp. 566-587
[Chan et al., 2020]
L. Chan, B. O&apos;Hara, P. Phongsavan, A. Bauman, B. Freeman.
Review of evaluation metrics used in digital and traditional tobacco control campaigns.
Journal of Medical Internet Research, 22 (2020),
[Chao et al., 2024]
S.L. Chao, M.M. Yu, S.Y. Wei.
Ascertaining the impact of e-service quality on e-loyalty for the e-commerce platform of liner shipping companies.
Transportation Research Part E: Logistics and Transportation Review, 184 (2024),
[Collier and Bienstock, 2006]
J.E. Collier, C.C. Bienstock.
Measuring service quality in e-retailing.
Journal of Service Research, 8 (2006), pp. 260-275
[Chen et al., 2022]
Q. Chen, Y. Gong, Y. Lu, J. Tang.
Classifying and measuring the service quality of AI chatbot in frontline service.
Journal of Business Research, 145 (2022), pp. 552-568
[Chou et al., 2022]
Y.C. Chou, C.T. Chen, S.H. Huang.
Modeling behavior sequence for personalized fund recommendation with graphical deep collaborative filtering.
Expert Systems with Applications, 192 (2022),
[Das et al., 2021]
R. Das, P.K. De, A. Barman.
Pricing and ordering strategies in a two-echelon supply chain under price discount policy: a Stackelberg game approach.
Journal of Management Analytics, 8 (2021), pp. 646-672
[De Caigny et al., 2020]
A. De Caigny, K. Coussement, K.W. De Bock.
Leveraging fine-grained transaction data for customer life event predictions.
Decision Support Systems, 130 (2020),
[Demirel, 2022]
D. Demirel.
The effect of service quality on customer satisfaction in digital age: Customer satisfaction based examination of digital CRM.
Journal of Business Economics and Management, 23 (2022), pp. 507-531
[Dolega et al., 2021]
L. Dolega, F. Rowe, E. Branagan.
Going digital? The impact of social media marketing on retail website traffic, orders and sales.
Journal of Retailing and Consumer Services, 60 (2021),
[Elia et al., 2022]
G. Elia, E. Raguseo, G. Solazzo, F. Pigni.
Strategic business value from big data analytics: An empirical analysis of the mediating effects of value creation mechanisms.
Information & Management, 59 (2022),
[French, 2017]
S. French.
Revealed comparative advantage: What is it good for?.
Journal of International Economics, 106 (2017), pp. 83-103
[Fu and Xing, 2021]
F. Fu, W. Xing.
An agent-based approach for project-driven supply chain problem under information asymmetry and decentralized decision-making.
Computers & Industrial Engineering, 158 (2021),
[Gao et al., 2023]
M. Gao, L. Xia, Q. Xiao, M. Goh.
Incentive strategies for low-carbon supply chains with information updating of customer preferences.
Journal of Cleaner Production, 410 (2023),
[Greenstone et al., 2022]
M. Greenstone, G. He, R. Jia, T. Liu.
Can technology solve the principal-agent problem? Evidence from China&apos;s war on air pollution.
American Economic Review: Insights, 4 (2022), pp. 54-70
[Huang et al., 2018]
R. Huang, X. Wei, Y. Gao, C. Lv, J. Mao, Q. Bao.
Data-driven QoE prediction for IPTV service.
Computer Communications, 118 (2018), pp. 195-204
[Järvinen and Karjaluoto, 2015]
J. Järvinen, H. Karjaluoto.
The use of web analytics for digital marketing performance measurement.
Industrial Marketing Management, 50 (2015), pp. 117-127
[Jin et al., 2024]
F. Jin, H. Lin, L. Zhou.
Bounded rationality consensus reaching process with prospect theory and preventing individual weight manipulation for multi-attribute group decision making.
Information Fusion, 112 (2024),
[Kalia et al., 2022]
P. Kalia, Y.K. Dwivedi, Á. Acevedo-Duque.
Cellulographics©: A novel smartphone user classification metrics.
Journal of Innovation & Knowledge, 7 (2022),
[Kamble and Gunasekaran, 2020]
S.S. Kamble, A. Gunasekaran.
Big data-driven supply chain performance measurement system: A review and framework for implementation.
International Journal of Production Research, 58 (2020), pp. 65-86
[Kashyap et al., 2025]
A. Kashyap, O.J. Shukla, R. Kumar, M.M. Alam, S.S. Oberoi.
Online retailing and the metaverse: Addressing stakeholder impediments in e-commerce.
Journal of Retailing and Consumer Services, 84 (2025),
[Li and Zhang, 2021]
M. Li, X. Zhang.
Information acquisition and its incentives in an E-commerce supply chain under the offline showroom model.
Journal of Theoretical and Applied Electronic Commerce Research, 16 (2021), pp. 1791-1804
[Liang et al., 2020]
W. Liang, M. Goh, Y.M. Wang.
Multi-attribute group decision making method based on prospect theory under hesitant probabilistic fuzzy environment.
Computers & Industrial Engineering, 149 (2020),
[Liang et al., 2022]
Y. Liang, Y. Ju, L. Martínez, Y. Tu.
Sustainable battery supplier evaluation of new energy vehicles using a distributed linguistic outranking method considering bounded rational behavior.
Journal of Energy Storage, 48 (2022),
[Lin et al., 2020]
H.H. Lin, T.H. Tseng, C.H. Yeh, Y.W. Liao, Y.S. Wang.
What drives customers&apos; post-purchase price search intention in the context of online price matching guarantees.
Journal of Retailing and Consumer Services, 54 (2020),
[Liu and Chen, 2019]
C. Liu, W. Chen.
Decision making in green supply chains under the impact of the stochastic and multiple-variable dependent reference point.
Transportation Research Part E: Logistics and Transportation Review, 128 (2019), pp. 443-469
[Liu et al., 2022]
W. Liu, S. Wei, K.W. Li, S. Long.
Supplier participation in digital transformation of a two-echelon supply chain: Monetary and symbolic incentives.
Transportation Research Part E: Logistics and Transportation Review, 161 (2022),
[Llopis-Albert et al., 2021]
C. Llopis-Albert, F. Rubio, F. Valero.
Impact of digital transformation on the automotive industry.
Technological Forecasting and Social Change, 162 (2021),
[Melović et al., 2021]
B. Melović, M. Dabić, M. Vukčević, D. Ćirović, T. Backović.
Strategic business decision making: The use and relevance of marketing metrics and knowledge management.
Journal of Knowledge Management, 25 (2021), pp. 175-202
[Mintz et al., 2021]
O. Mintz, T.J. Gilbride, P. Lenk, I.S. Currim.
The right metrics for marketing-mix decisions.
International Journal of Research in Marketing, 38 (2021), pp. 32-49
[Morgan et al., 2022]
N.A. Morgan, S. Jayachandran, J. Hulland, B. Kumar, C. Katsikeas, A. Somosi.
Marketing performance assessment and accountability: Process and outcomes.
International Journal of Research in Marketing, 39 (2022), pp. 462-481
[Palmié et al., 2022]
M. Palmié, L. Miehé, P. Oghazi, V. Parida, J. Wincent.
The evolution of the digital service ecosystem and digital business model innovation in retail: The emergence of meta-ecosystems and the value of physical interactions.
Technological Forecasting and Social Change, 177 (2022),
[Parasuraman et al., 2002]
A. Parasuraman, L. Berry, V. Zeithaml.
Refinement and reassessment of the SERVQUAL scale.
Journal of Retailing, 67 (2002), pp. 114
[Pavlov et al., 2022]
V. Pavlov, E. Katok, W. Zhang.
Optimal contract under asymmetric information about fairness.
Manufacturing & Service Operations Management, 24 (2022), pp. 305-314
[Qiu et al., 2022]
R. Qiu, Y. Yu, M. Sun.
Supply chain coordination by contracts considering dynamic reference quality effect under the O2O environment.
Computers & Industrial Engineering, 163 (2022),
[Ratchford et al., 2022]
B. Ratchford, G. Soysal, A. Zentner, D.K. Gauri.
Online and offline retailing: What we know and directions for future research.
Journal of Retailing, 98 (2022), pp. 152-177
[Reim et al., 2022]
W. Reim, P. Yli-Viitala, J. Arrasvuori, V. Parida.
Tackling business model challenges in SME internationalization through digitalization.
Journal of Innovation & Knowledge, 7 (2022),
[Royle and Laing, 2014]
J. Royle, A. Laing.
The digital marketing skills gap: Developing a Digital Marketer Model for the communication industries.
International Journal of Information Management, 34 (2014), pp. 65-73
[Saura, 2021]
J.R. Saura.
Using data sciences in digital marketing: Framework, methods, and performance metrics.
Journal of Innovation & Knowledge, 6 (2021), pp. 92-102
[Si et al., 2015]
Si, Y. W., Zhang, D., Zeng, X., Leung, S. C., & Li, T. (2015). A decision-making framework for precision marketing. http://dx.doi.org/10.1016/j.eswa.2014.12.022.
[Skaka-Čekić and Baraković Husić, 2023]
F. Skaka-Čekić, J. Baraković Husić.
A feature selection for video quality of experience modeling: A systematic literature review.
Wiley Interdisciplinary Reviews: Data Mining and Knowledge Discovery, 13 (2023), pp. e1497
[Šola et al., 2022]
H.M. Šola, M. Mikac, I. Rončević.
Tracking unconscious response to visual stimuli to better understand a pattern of human behavior on a Facebook page.
Journal of Innovation & Knowledge, 7 (2022),
[Taguchi, 1986]
Taguchi, G. (1986). Introduction to quality engineering: designing quality into products and processes.
[Tian et al., 2022]
X. Tian, J. Ma, L. Li, Z. Xu, M. Tang.
Development of prospect theory in decision making with different types of fuzzy sets: A state-of-the-art literature review.
Information Sciences, 615 (2022), pp. 504-528
[Tu et al., 2022]
Y. Tu, H. Shi, K. Chen, Y. Liang, X. Zhou, B. Lev.
Three-reference-point based group ELECTRE III method for urban flood resilience evaluation.
Expert Systems with Applications, 210 (2022),
[Tversky and Kahneman, 1981]
A. Tversky, D. Kahneman.
The framing of decisions and the psychology of choice.
Science, 211 (1981), pp. 453-458
[Uppari & Hasija, 2019]
B.S. Uppari, S. Hasija.
Modeling newsvendor behavior: A prospect theory approach.
Manufacturing & Service Operations Management, 21 (2019), pp. 481-500
[Varadarajan, 2020]
R. Varadarajan.
Customer information resources advantage, marketing strategy and business performance: A market resources based view.
Industrial Marketing Management, 89 (2020), pp. 89-97
[Veile et al., 2022]
J.W. Veile, M.C. Schmidt, K.I. Voigt.
Toward a new era of cooperation: How industrial digital platforms transform business models in Industry 4.0.
Journal of Business Research, 143 (2022), pp. 387-405
[Vipin and Amit, 2021]
B. Vipin, R.K. Amit.
Wholesale price versus buyback: A comparison of contracts in a supply chain with a behavioral retailer.
Computers & Industrial Engineering, 162 (2021),
[Wang et al., 2020]
Z. Wang, H. Nie, H. Zhao.
An extended GEDM method with heterogeneous reference points of decision makers and a new hesitant fuzzy distance formula.
Computers & Industrial Engineering, 146 (2020),
[Wei et al., 2019]
Y. Wei, S. Xiong, F. Li.
Ordering bias with two reference profits: Exogenous benchmark and minimum requirement.
Transportation Research Part E: Logistics and Transportation Review, 128 (2019), pp. 229-250
[Weingarten, Bhatia, & Mellers, 2019]
E. Weingarten, S. Bhatia, B. Mellers.
Multiple goals as reference points: One failure makes everything else feel worse.
Management Science, 65 (2019), pp. 3337-3352
[Yang et al., 2021]
X. Yang, H. Li, L. Ni, T. Li.
Application of artificial intelligence in precision marketing.
Journal of Organizational and End User Computing (JOEUC), 33 (2021), pp. 209-219
[Zhang et al., 2023]
Y. Zhang, Q. Xu, G. Zhang.
Optimal contracts with moral hazard and adverse selection in a live streaming commerce market.
Journal of Retailing and Consumer Services, 74 (2023),
[Zhong et al., 2022]
Y. Zhong, Y. Li, Y. Yang, T. Li, Y. Jia.
An improved three-way decision model based on prospect theory.
International Journal of Approximate Reasoning, 142 (2022), pp. 109-129
[Zhu et al., 2017]
J. Zhu, Z. Ma, H. Wang, Y. Chen.
Risk decision-making method using interval numbers and its application based on the prospect value with multiple reference points.
Information Sciences, 385 (2017), pp. 415-437
Copyright © 2025. The Author(s)
Download PDF
Article options
Tools