


This study analyzes cross-sectional time-series data of 276 prefecture-level Chinese cities for the period 2012–2022. It employs the coupling coordination degree, dynamic spatial models, and threshold models to investigate the coupled and coordinated development (CCD) level between artificial intelligence (AI) and digital government construction (DGC), further, it examines the AI–DGC CCD’s impact on green economic efficiency (GEE). This study reveals that a coupling and coordination mechanism exists between AI and DGC. The AI–DGC CCD enhances local GEE by facilitating industrial structure upgrading and ecosystem resilience, while exerting a nonlinear inverted U-shaped spatial spillover effect on neighboring regions, as confirmed by multiple robustness tests. Heterogeneity analysis demonstrates that the AI–DGC CCD’s impact on GEE is more pronounced in non-resource-dependent cities, as well as those with high levels of digital economy, stringent environmental regulations, and robust intellectual-property protection. Additionally, the AI–DGC CCD’s influence on GEE exhibits a threshold effect based on public environmental concern.
Green economic efficiency (GEE) serves as a vital indicator measuring government policies’ degree of friendliness toward natural resources and the environment during periods of national or regional economic growth. Since the widespread acceptance of the concept of eco-friendly economic growth in the late 20th century, GEE has gradually accrued attention from both academics and policymakers (Aini et al., 2023; Gakh, 2023; Hasanov et al., 2024; Li & Deng, 2024; Ma et al., 2024; Ovchynnykova et al., 2024; Sumiati et al., 2024). Moreover, with the advance of economic globalization, resource and environmental concerns have gained increasing public attention. Meanwhile, balancing economic growth with ecological environmental protection poses a common challenge for the global community. As the most populous emerging economy worldwide, China has achieved remarkable economic growth since it implemented market-oriented reforms; however, this has been accompanied by increasingly severe resource consumption and environmental pollution problems. In response, the Chinese government has emphasized the significance of eco-friendly development in several key reports and has put forward the long-term goal of fostering a sustainable and eco-conscious society. In the context of this new paradigm, enhancing GEE has emerged as a focal point across various sectors of society (Chen & You, 2021).
Moreover, as significant forces driving socio-economic development, artificial intelligence (AI) and digital government construction (DGC) are tightly connected to green economic growth and have increasingly significant impacts on GEE. AI, as a pivotal catalyst in the latest phase of technological and industrial evolution, shows tremendous potential in enhancing productivity, refining resource distribution, minimizing energy use, and curbing environmental harm (Zhou et al., 2024). For its part, DGC is a crucial path for advancing the modernization of governance. This leveraging of digital technologies increases the rationality of administrative judgments, the convenience of services, and the effectiveness of supervision, thus providing strong support for the advancement of the green economy (Bakari, 2022; Bakari et al., 2022; Zhao et al., 2023).
Accordingly, over the past decade, China has steadily intensified its efforts to expand AI’s scope, elevating it to a national strategy. AI, with its efficient and intelligent characteristics, provides powerful technical support for DGC. In turn, DGC, through concepts such as open data, optimized services, and enhanced governance efficiency, offers abundant application scenarios and a vast practical platform for AI development. Thus, there is an intrinsic link between AI and DGC.
Although some advances have been made in academic research on AI, DGC, and GEE, related studies have called for further deepening and expansion. Existing studies tend to focus on the analysis of single factors or pairwise relationships, thus exhibiting a fragmented nature. Specifically, numerous studies have thoroughly examined AI’s unidirectional impact on GEE (e.g., Lin & Zhou, 2025) or DGC’s promotional effect on GEE (e.g., Chen et al., 2025). However, most of these studies either treat AI or DGC as independent variables acting on GEE or they limit their focus to exploring the AI–DGC interaction—e.g., the empowerment of AI technology in digital government services (Zhang & Li, 2025). Accordingly, they fail to systematically regard AI and DGC as a dynamically coupled, synergistically evolving technology–governance system. Furthermore, there is a lack of quantitative measures to assess the coupling coordination degree of this system, while empirical tests and mechanism analyses of how the system’s dynamic evolution affects GEE are also lacking. Therefore, the existing literature fails to fully address the following questions: To what extent do AI and DGC achieve coordinated development? How does a change in the strength of this coordination affect GEE? What is the specific transmission mechanism underlying this effect? These questions constitute the gap that our study aims to fill: namely, measuring the coupling coordination degree of AI and DGC and empirically testing its impact and mechanism of action on GEE.
Compared with existing studies, the present study makes significant original contributions. Theoretically, by treating AI and DGC as an integrated whole, this paper introduces a coupling coordination degree model to systematically examine the impact of their synergistic evolution on GEE, breaking through the traditional single-factor analysis paradigm. Methodologically, it constructs a multi-dimensional indicator system and combines spatial econometric models with panel threshold models, not only to reveal the spatial heterogeneity of the relationships among the three but also to identify the action mechanisms of key influencing factors. This not only remedies the deficiencies in the prevalent theoretical frameworks and research methodologies but also offers a novel perspective for interdisciplinary research on the green economy, thereby contributing to deepening the academic understanding of the synergistic effects between digital technologies and government governance.
At the practical level, against the dual backdrop of the global green transition and rapid digital technology advancement, enhancing GEE significantly proves challenging when relying solely on single technology or governance models. The coupled and coordinated development (CCD) between AI and DGC (i.e., the AI–DGC CCD) integrates the advantages of technological innovation and institutional innovation: the former optimizes resource allocation and predicts environmental risks through intelligent algorithms, while the latter perfects the green policy system via data sharing and precision governance. Their synergistic effects operate across links such as green industrial upgrading and strengthened environmental regulation. By exploring the mechanism of the AI–DGC CCD’s impact on GEE, this study provides theoretical foundations and practical insights for governments to formulate scientific digital governance policies, enterprises to optimize green supply chain management, and research institutions to conduct technological innovation. This propels the formation of a new pattern of multi-stakeholder collaborative green economic development, ensuring that AI and DGC, while promoting green economic growth, achieve harmonious coexistence with the ecological environment. Thus, this study investigates the mechanism of the AI–DGC CCD’s impact on GEE, aiming to provide theoretical and practical insights for realizing the green transition and sustainable development of China’s economy.
Literature reviewResearch on AI, DGC, and GEE has primarily addressed three key areas. The first concerns the development of concepts and indicators for AI, DGC, and GEE. Regarding AI-development measures, Yang (2022) employed the number of AI patents, while Zhao et al. (2024) used the number of industrial robots. For DGC, few articles have focused on its measurement indicators. Hao et al. (2024) constructed a keyword library for DGC, used Python to conduct text analysis on government reports, and measured DGC based on the frequency of keyword occurrences; meanwhile, Xu and Jin (2024) took the guidance opinions on “Internet + Government Services,” issued in 2016, as a quasi-experimental design and constructed DGC indicators by setting up dummy variables. Regarding GEE measures, Yuan et al. (2020) and Chen et al. (2024) adopted the super-efficiency slack-based model with unwanted outcomes from both input and output perspectives. Meanwhile, Mo et al. (2024) utilized data envelopment analysis for this purpose.
The second area comprises the pairwise relationships among AI, DGC, and GEE. Research on the AI–GEE relationship is scarce, focusing mainly on AI’s impact on eco-innovation, green transformation, and green economic growth. Studies have found that AI can foster green transformation and eco-innovation efficiency in manufacturing enterprises (Feng et al., 2024a; Zhang et al., 2024), thereby fostering green economic growth (Feng et al., 2024b; Zhao et al., 2022). Similarly, direct work on the relationship between DGC and GEE is limited, primarily focusing on DGC’s impact on eco-innovation. Tan et al. (2024) employed the “Internet + Government Services” initiative as a quasi-experimental design and found that the development of digital governance contributes to improvements in corporate eco-innovation. This is achieved by advancing the digital transformation of the business ecosystem, lowering enterprises’ business expenses, and encouraging greater input in R&D and environmentally sustainable practices. According to Hao et al. (2024), government digital transformation, as a prominent indicator of digital economic development, acts a crucial role in cultivating eco-innovation and supporting business expansion. Studies on the AI–DGC relationship are also rare. Pan et al. (2024) found that governments’ use of AI for financial supervision significantly strengthens the latter’s intensity, while Valle-Cruz et al. (2024) argued that insufficient comprehension of AI outputs, inherent biases, and potential errors—along with the manipulation of intelligent algorithms and cognitive systems—may adversely affect governmental functions.
The third area examines the relationships between other indicators and AI, DGC, and GEE. Regarding other indicators related to AI, Acemoglu and Restrepo (2020) showed that robot adoption reduces both employment and wages. Meanwhile, according to Fu et al. (2024), AI helps cut energy consumption by driving innovation and fostering enterprise digitalization. Additionally, AI’s negative effect on energy consumption is more significant in state-owned enterprises, high-tech companies, and non-heavy polluting industries. Additionally, Zou and Xiong (2023) found that AI not only facilitates industrial upgrading but also significantly inhibits deviations from industrial structural balance, thus contributing to industrial rationalization. In terms of other indicators related to DGC, Jin et al. (2023) found that DGC can reduce the incidence of corporate environmental misconduct, primarily through administrative environmental regulation and public environmental audits. With the reduction in environmental violations, companies’ total factor productivity also improves (Zhu & Yu, 2024). Finally, regarding other indicators related to GEE, Li et al. (2022) found that eco-innovation can significantly reduce corporate GEE. This negative impact is more pronounced in situations with inadequate preservation of innovative outcomes and insufficient knowledge and technological foundation, as well as in enterprises engaging in severely polluting production and operational activities. Chen et al. (2024) used smart city construction as a quasi-experimental design and found that smart cities’ construction can raise GEE through technological, structural, and energy effects. Similarly, Lv and Chen (2024) used the pilot program for national e-commerce cities as a quasi-experimental design for regional digital transformation and found that implementing the national e-commerce pilot policy can significantly improve GEE.
As made evident by this literature review, research on AI, DGC, and GEE has been fruitful. However, a limitation is that research on the relationships among AI, DGC, and GEE focuses on unilateral impacts or pairwise relationships, with insufficient studies addressing the AI–DGC CCD’s impact on GEE. To fill this gap, this study examines data of 276 prefecture-level Chinese cities for the period 2012–2022 to determine AI–DGC CCD and its impact on GEE. First, we construct indicators for AI, DGC, and GEE. Then, we calculate the AI–DGC CCD, while we also determine the region’s development stage. Subsequently, we explore the AI–DGC CCD’s impact on GEE using dynamic spatial econometric models and threshold models, while proposing corresponding countermeasures and suggestions. However, at that point, it remains unclear whether a coupling coordination relationship exists between AI and DGC, as well as which specific conditions moderate the impact pathways and action mechanisms of their coupling coordination’s impact on GEE. Thus the subsequent analysis dissects the impact mechanisms through which the AI–DGC CCD influences GEE, followed by the proposal of corresponding hypotheses.
Theoretical analysis and research hypothesesThe coupling and coordination mechanism between AI and DGCFrom the perspective of subject and object, AI and DGC serve as mutual subjects and objects. When AI is considered the subject, several facets emerge: Firstly, in terms of efficiency, AI and advanced digital tools (e.g., big data analytics, AI algorithms, and language comprehension systems) enable governments to swiftly handle and interpret large-scale datasets, thus significantly enhancing government decisions’ rationality and public service delivery’ effectiveness. Secondly, from the viewpoint of service optimization, AI technologies (including intelligent customer service, automated processes, and personalized services) improve the quality and response speed of governmental services. These technologies not only elevate service efficiency but also bolster the public’s satisfaction with governmental services (Hazar & Babuşcu, 2023; Yigitcanlar et al., 2023). Thirdly, regarding innovation drive, AI technologies propel innovations in governance models. Through AI, governments can explore new service models and governance strategies, such as utilizing AI for urban planning, environmental monitoring, and public safety early warning, thus providing fresh insights and methodologies for DGC (Mestiri, 2023; Yigitcanlar et al., 2024). Lastly, from the synergy perspective, AI technologies facilitate information sharing and operational coordination among governmental departments. By constructing unified data platforms and intelligent analysis systems, different departments within the government can collaborate more effectively, thereby enhancing the government’s operational efficiency.
Conversely, when digital government is considered the subject, AI technologies play a crucial supporting and driving role. Firstly, DGC offers abundant application scenarios for AI technologies. Within the framework of a digital government, AI technologies are extensively applied in areas such as intelligent approval, intelligent supervision, and intelligent services, thus elevating the level of intelligence in governmental work (Li et al., 2023). Secondly, DGC offers data support for the advancement of AI technologies. The vast amounts of data generated by governments in the provision of public services offer invaluable resources for algorithm training and model optimization. Thirdly, DGC promotes innovative uses of AI technologies in the sector of public services. For instance, through AI technologies, governments can provide more personalized and precise public services, catering to citizens’ diverse needs (De Sousa et al., 2019). Summarily, a close intrinsic link exists between AI and DGC, with both mutually promoting and developing together, forming a CCD relationship. AI technologies provide technical support for DGC, while DGC offers diverse opportunities for AI technologies’ utilization and advancement. On this basis, the following hypothesis was developed:
Hypothesis 1 There exists a coupling and coordination mechanism between AI and DGC.
On the one hand, AI can effectively enhance local GEE through DGC. Innovation diffusion theory posits that the adoption and application of innovations follow a process evolving from initial slowness to accelerated progression in later stages (Xiao et al., 2024). In the early phase, the pace of green economic transition remains relatively slow due to AI technologies’ immaturity and DGC’s incompleteness. However, with AI technologies’ rapid advancement and the increasing maturity of digital government platforms, the synergistic effect between the two gradually emerges. AI, through means such as big data analysis and machine learning, enhances the scientific validity and precision of digital governments’ decision-making, thereby providing robust support for the formulation and implementation of green economic policies. This dynamic aligns with the mid-to-late-stage acceleration characteristic of innovation diffusion theory, in which technological complementarity and institutional adaptation drive exponential improvements in efficiency (Liu et al., 2021). Specifically, AI optimizes government resource allocation, enhances public service efficiency, and achieves intelligent management in fields such as environmental monitoring and energy management, minimizing resource inefficiency and ecological degradation, thereby promoting local GEE’s improvement.
On the other hand, DGC, by leveraging AI, can also effectively enhance local GEE. DGC aims to improve government services’ transparency and efficiency, while AI implementation further strengthens this function (Zheng et al., 2020). Through AI technologies, digital governments can more efficiently manage and extract insights from massive data, providing a scientific basis for the formulation of green economic policies. Additionally, AI technologies can assist governments in achieving more refined management, such as through intelligent monitoring and warning systems, promptly identifying and resolving environmental issues, and reducing pollutant emissions. These efforts not only enhance local GEE but also support enduring economic development.
Studies have shown that GEE exhibits spatial variability; thus, it is necessary to examine whether the AI–DGC CCD produces spatial spillover effects (Ma et al., 2024). Spatial spillover effect theory posits that economic activities and policy initiatives in one region influence neighboring areas through multiple channels (Hu et al., 2023). Firstly, the CCD of local AI and DGC promotes local green economic transformation and upgrading, thus enhancing GEE. The ongoing AI–DGC CCD has resulted in the weakening of spatial and temporal barriers between regions, resulting in increasingly frequent exchange of information and technological cooperation (Olan et al., 2021). In line with policy diffusion theory, successful policy practices serve as an example of how to incentivize and guide neighboring regions to adopt similar policies and measures, thereby advancing their green economic transformation. However, the continuous CCD of local AI and DGC may also affect neighboring regions’ GEE. On the one hand, as local AI and DGC continue to couple and develop, the local market may gradually reach saturation, thereby making competition increasingly fierce. Meanwhile, as DGC emphasizes eco-friendly construction, local high-pollution, resource-intensive enterprises may gradually lose their competitive advantages. According to the pollution haven hypothesis, disparities in environmental regulations or standards may lead to the migration of polluting industries to regions with lower standards. In this scenario, energy-intensive and high-pollution enterprises may relocate to neighboring regions with greater development potential, potentially increasing environmental pressures and reducing GEE in those areas (Fu et al., 2021). Simultaneously, if a region excels in AI and DGC, it may attract talent and capital from adjacent regions in the green economy through the siphon effect, thus slowing the pace of green economic transformation in neighboring areas (Luo et al., 2023). Therefore, two hypotheses are proposed:
Hypothesis 2a The AI–DGC CCD has a positive influence on local GEE.
Hypothesis 2b The AI–DGC CCD produces a nonlinear inverted U-shaped spatial spillover effect on neighboring GEE.
From the perspective of industrial upgrading theory (from the field of industrial economics), the optimization of industrial structure serves as a key driver for economic growth and efficiency enhancement (Zhou & Shan, 2023). AI focuses on intelligent management and decision optimization, while DGC emphasizes information openness and transparent governance. The integration of these two facilitates the establishment of a more efficient and transparent governance system. Within cities, intelligent algorithms optimize resource allocation, guiding industries toward high-value-added and low-energy-consumption development, thereby forming competitive industrial clusters. Between urban and rural areas, digital technology enables seamless information flow, promoting balanced resource allocation and complementary advantages; fostering harmonized growth across large, medium, and small cities and towns; and advancing urban–rural integration. This optimization of the industrial layout not only enhances overall competitiveness but also promotes the upgrading of the industrial structure (Zou & Xiong, 2023). With the optimization of the industrial structure, digital technology implementation can drive traditional industries’ green transformation. Through intelligent transformation, enterprises achieve automation, precision, and low carbonization in manufacturing procedures, thus reducing resource inefficiency and ecological degradation (Wang et al., 2018). Meanwhile, DGC provides policy support and regulatory guarantees for these transformations, ensuring a smooth green transition. Summarily, the AI–DGC CCD can significantly enhance local GEE by facilitating industrial structure optimization. Accordingly, the following hypothesis is proposed:
Hypothesis 3a The AI–DGC CCD enhances local GEE by promoting the upgrading of the industrial structure.
In the context of urban governance, resilience theory emphasizes a system’s capacity to adapt, recover, and transform in the face of internal and external shocks. The deep implementation of AI technologies—e.g., intelligent monitoring, big data analysis, and predictive early-warning systems—provides governments with real-time and accurate urban operation data, enabling the precise identification of urban ecological risks and the timely implementation of countermeasures. Meanwhile, DGC achieves refined and efficient urban governance by building unified data-sharing platforms, optimizing government service processes, and enhancing decision-making intelligence. The combination of these two not only strengthens cities’ capacity to withstand external disruptions such as natural disasters and pollution but also promotes coordination and balance among various elements within the urban ecosystem, thereby significantly enhancing urban UERI (Dai et al., 2024). This enhancement of urban UERI lays a solid foundation for GEE development. On the one hand, a highly resilient urban ecosystem can more effectively resist external disturbances and maintain stable urban functions, providing a stable socio-economic environment for the growth of the sustainable economy. On the other hand, enhancing the urban ecosystem’s resilience promotes efficient resource utilization and recycling, reduces resource waste and environmental pollution, and offers useful support for the eco-friendly development of the green economy (Peng et al., 2023). In a highly resilient urban environment, enterprises can leverage AI technologies to streamline manufacturing procedures, enhance the efficiency of resource use, and lower both energy consumption and environmental emissions, thereby achieving a green transformation of production methods. Simultaneously, governments can use digital government platforms to provide more precise and efficient public services, promote green industries’ rapid development, and enhance local GEE. Thus, the following hypothesis is proposed:
Hypothesis 3b The AI–DGC CCD enhances local GEE by promoting the improvement of urban UERI.
Innovation diffusion theory posits that the diffusion and implementation of innovations are influenced by multiple factors, including the social environment. In situations where PEC is relatively low, societal environmental awareness tends to be weaker. Consequently, enterprises and governments face less environmental pressure and social oversight in advancing the AI–DGC CCD. This provides them with greater freedom and resources to focus on technological innovation, data integration, and the optimization of government services, thereby facilitating the rapid development of this coupled model. Such a relatively relaxed social environment is conducive to stimulating innovative potential, leading to the continuous emergence of a multitude of cutting-edge AI technologies and efficient digital government platforms. In line with the Porter hypothesis, appropriate social environmental regulations or pressures help stimulate innovative potential, thus prompting the continuous emergence of cutting-edge AI technologies and efficient digital government platforms (Yu et al., 2023). Implementing these technologies and platforms can significantly enhance government service efficiency and improve resource deployment strategies, thereby promoting GEE’s improvement. However, as PEC gradually increases, societal expectations and demands for environmental protection also intensify. Enterprises and governments, when advancing AI and DGC, must confront stricter environmental standards and public oversight (Tao et al., 2023); to meet these requirements, they must invest more materials and funds in the advancement of environmentally friendly technologies, the execution of energy conservation and emissions mitigation measures, and the initiation of ecological governance projects. Although these additional environmental investments are crucial for improving the ecological environment, they may, to some extent, crowd out resources and funds originally allocated to AI technological innovation and the optimization and upgrading of digital government platforms. Especially in situations of limited resources, enterprises and governments must strike a balance between eco-protection and technological innovation, which may lead to a reduction in direct investment and attention towards enhancing GEE in the process of advancing the AI–DGC CCD. In the short term, this balance may manifest as a slowdown in the improvement of GEE—or even a temporary decline. Thus, the following hypothesis is proposed:
Hypothesis 4 The AI–DGC CCD’s impact on GEE exhibits a threshold effect based on the level of PEC.
GEE serves as a metric for measuring and assessing the economic performance of a region based on specific resource input and environmental costs. In this study, based on the approach of Chen et al. (2024), we considered five types of resource inputs, three types of desired outputs, and three types of undesired outputs, from both the input and output dimensions, employing the undesired outputs super-efficiency slack-based model to measure GEE.
Explanatory variables: AI–DGC CCD (AGC)First, separate indicator systems for AI and DGC are constructed, followed by the calculation of the CCD degree between AI and DGC.
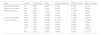
DGCThere is no consensus regarding what constitutes digital government; however, it is often defined as the application of information and communication technology. Information and communication technology’s implementation relies on certain foundational conditions. This study measures DGC from four dimensions: technology, government, market, and society, constructing a comprehensive indicator system as listed in Table 1.
DGC Evaluation Indicator System.
This work employs the volume of AI intellectual property requests to signify the degree of AI implementation. Utilizing Python web-scraping technology, AI patents are collected from the Chinese Patent Database and categorized at the city level, thereby obtaining the AI patent application volume for different cities.
The core research question of this study centers on the synergistic effect arising from the interaction between two systems—AI and DGC—and how their development level influences GEE, as opposed to analyzing each system’s impact or their simple correlation. The coupling coordination model enables accurate quantitative assessment of the degree of interdependence and mutual promotion between these two complex systems (AI and DGC), as well as the coordinated development status of the two when viewed as an integrated system. Thus, the coupling coordination model is employed in this study to calculate the CCD.
Mediator variablesIndustrial structure upgrading is assessed through the rationalization of industrial structure (RIS) and the advancement of industrial structure (AIS). The RIS adopts the method proposed by Wang et al. (2021), while it employs the Theil index to quantify. The further the value deviates from 0, the more imbalanced the industrial structure is deemed; thus, this is a negative indicator. The AIS is assessed through the proportion of the tertiary sector’s added value relative to the secondary sector.
UERIThis work employs the method proposed by Li and Wang (2023), deriving the UERI from three distinct dimensions: the state resilience index, the pressure resilience index, and the response resilience index, employing the entropy method for computation.
Threshold variable: PEC (Index)This study follows the approach proposed by Tao et al. (2023), using the Baidu smog search index as a proxy variable regarding public awareness of environmental issues. The Baidu smog index can be categorized based on search channels into the total search index, PC search index, and mobile search index. The total search index is the weighted sum of the PC search index and the mobile search index; hence this work uses Baidu’s total smog search index divided by 100 to measure the PEC.
Control variablesFollowing Yuan et al. (2020) and Chen et al. (2024), this study uses the following control variables:
- •
Human capital (HNC): Measured by the number of college students per 10,000 people.
- •
Openness to foreign investment (OUL): Measured by the proportion of actual foreign capital used relative to the regional gross domestic product.
- •
Government intervention intensity (GOV): Expressed as the share of local government general budget spending relative to GDP.
- •
Urban scale (SCAL): Expressed by the logarithm of the year-end total population.
- •
Fiscal investment intensity (FII): Calculated by comparing fixed asset investment against fiscal expenditure.
- •
Financial development level (FDL): Calculated by comparing the deposit and loan balances of financial institutions with the regional GDP.
To verify the AI–DGC CCD’s direct impact on local GEE, the following regression model is constructed. Serving as the foundational framework of this study, this model directly tests the AI–DGC CCD’s linear influence on GEE through regression analysis, offering a straightforward approach to evaluate the primary research hypotheses. By incorporating time-fixed and individual-fixed effects, the model effectively controls for city-level heterogeneity and common shocks at the temporal dimension—such as macroeconomic fluctuations and policy changes—thereby avoiding estimation biases caused by omitted variables. Meanwhile, the stochastic disturbance term captures the influence of unobserved factors, ensuring the consistency of coefficient estimation for core explanatory variables and enabling the estimated results to accurately reflect the relationship between independent and dependent variables.

In the model, i denotes the city, and t represents the year. GFit signifies ecological efficiency. AGCit represents the CCD degree between AI and DGC; Controlsit indicates the control variables;γt,ui, and εitcorrespond to the time-fixed effects, individual-fixed effects, and stochastic disturbance terms, respectively.
Design of the mediation effect modelFollowing the identification of the direct impact of coupled coordinated development on GEE, the mediating mechanisms are further explored. This model, featuring transparent operation and clear logic, is widely applicable in empirical research of economics. It enables in-depth excavation of the potential roles played by industrial structure and ecological resilience in the relationship, uncovering underlying transmission pathways. To examine the mediating effects of industrial structure and ecological resilience, following Lv et al. (2021), models are built upon the foundation of Model (1) to establish a mediation effect model as follows:
where Mit represents the mediating variables of industrial structure and UERI, and other variables remain consistent with those in Eq. (1).Threshold model development

Differences in public environmental attention across cities may alter the AI–DGC CCD’s effect on GEE. Introducing a threshold model captures this nonlinear relationship and identifies the heterogeneity of coordination effects under different attention levels. Compared with artificial interval division, threshold regression endogenously determines critical values via the bootstrapping method, avoiding subjectivity and enhancing statistical efficiency. To explore the AI–DGC CCD’s differential impact on local GEE under varying levels of PEC, this study conducts a threshold effect test with PEC as the threshold variable, according to Model (1), a threshold model is constructed:
where Index represents the threshold variable, λ1 represents the corresponding threshold value, I(·) represents the indicator function, and other variables remain consistent with those in Eq. (1).Design of the spatial econometric model
On the one hand, significant spatial correlation is exhibited by GEE: due to behaviors such as inter-regional resource flows, technology spillovers, and coordinated environmental regulations, the GEE of a region is influenced by the development status of adjacent regions. However, traditional econometric models (e.g., ordinary least squares) are based on the assumption that spatial units are independent of each other. This assumption prevents such models from capturing cross-regional spatial interaction effects, which often leads to biased estimation results. On the other hand, distinct spatial spillover characteristics are demonstrated by the AI–GC CCD. Through channels including shared digital infrastructure, cross-regional coordination of government services, and the diffusion of intelligent technologies, this coupled development not only exerts an impact on local GEE but also potentially generates a radiating effect on neighboring regions. By introducing a spatial weight matrix, spatial econometric models allow the “neighborhood effect” to be incorporated into the econometric analysis framework. This enables more accurate separation of two types of impacts: the AI–GC CCD’s direct impact on local GEE and its indirect impact on neighboring regions through spatial transmission mechanisms. Thus, by constructing spatial econometric models, this study not only tests whether the core explanatory variable exerts a significant spatial spillover effect on the GEE of neighboring regions but also further quantifies the direction and magnitude of this effect. This approach effectively addresses the limitations of traditional econometric models—specifically, their inability to characterize spatial dependence and spatial heterogeneity, as well as their failure to identify cross-regional policy effects.
Selection of spatial weight matrixSpatial weight matrices typically include four categories: geographic adjacency weight matrix, geographic distance weight matrix, economic distance weight matrix, and economic-geographic distance weight matrix. To incorporate both spatial and economic aspects, this study employed the following geographic adjacency weight matrix and economic distance weight matrix as spatial weight matrices for calculations, while the economic-geographic distance weight matrix was used in the robustness tests.
The geographic adjacency weight matrix is formulated as follows:

The economic distance weight matrix is formulated as follows:

The economic-geographic distance weight matrix is formulated as follows:
where i and j represent cities i and j, GDPi and GDPj represent the GDP of cities i and j, and dij2 represents the squared distance between cities i and j.Spatial econometric model construction
To investigate the inverted U-shaped spatial spillovers of GEE resulting from the AI–DGC CCD, and considering the endogeneity issues that may arise from time-dependent effects in GEE, a dynamic model is validated by introducing a one-period lagged ecological efficiency in the static model. Based on this, the following dynamic spatial econometric model is constructed:
where i represents the city and t represents the year. GFit signifies GEE, with GFi,t-1 representing its one-period lag. AGCit represents the CCD degree between AI and DGC, and (AGCit)² captures the nonlinearity of spatial spillover effects associated with this coupling. Controlsit encompasses the control variables. Wit signifies the geographical adjacency weight matrix and the economic distance weight matrix, respectively. The regression coefficient β1 for the core explanatory variable, if significant, indicates a notable impact of the AI–DGC CCD on GEE. Similarly, β2, the regression coefficient for the quadratic term of the core explanatory variable, if significant simultaneously with β1 and of opposite sign, suggests a significant nonlinear impact. The spatial autoregressive coefficient β3, if significant, meaning a significant influence of the CCD on the GEE of neighboring areas. Furthermore, β4, the spatial quadratic term regression coefficient, if significant simultaneously with β3 and of opposite sign, indicates a significant nonlinear impact on the GEE of neighboring regions. γt, ui, and εit represent the time-fixed effect, the individual-fixed effect, and the random disturbance term, respectively. The model is considered static when both ρ1 and ρ2 are 0; otherwise, the model is dynamic.Data sources and descriptive statistics
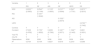
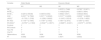
The primary sources of the raw data used in this study were the China Energy Statistical Yearbook, the China Regional Economic Database, the China City Statistical Yearbook, the EPS Database, the official Baidu Index website, and the China Patent Database. The data in this study were pre-processed using Stata 15 software. Due to data availability, linear interpolation was applied to fill in missing data for prefecture-level cities with minimal data gaps, while those with substantial data deficiencies were excluded. Ultimately, 276 prefecture-level cities and above from the period 2012–2022 were included in this study. Descriptive statistics for the variables are presented in Table 2.
Descriptive Statistics for Variables.
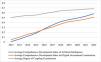
Through calculations, the comprehensive indices for two indicators—AI and DGC—for 276 cities over the period from 2012 to 2022, along with the CCD levels of these two indicators, are depicted in Fig. 1. Firstly, Fig. 2 illustrates that the overall comprehensive index for AI in China exhibits an upward trend, from 0.01 in 2012 to 0.58, in 2022. Secondly, the average comprehensive index for DGC in China exhibits a rising trend, from 0.05 in 2012 to 0.51, in 2022. Additionally, after 2019, the upward trends in both the average comprehensive index for AI and the average comprehensive index for DGC decline, potentially due to the COVID-19 pandemic. Lastly, the average degree of coupled coordination generally trends upwards during the sample period, ranging from [0.504, 0.587] between 2012 and 2016, reaching a primary level of coordination. From 2017 to 2022, it falls within the range of [0.611, 0.683], achieving an intermediate level of coordination. Consequently, it is apparent that AI and DGC possess a coupling mechanism, thus validating Hypothesis 1.
Baseline regression analysis

The AI–DGC CCD’s direct impact on local GEE is examined based on Model (1). The regression results show that the regression coefficients of the core explanatory variable AGC are significantly positive at least at the 10 % level through the gradual introduction of control variables (Table 3). In case that all control variables are introduced, the regression coefficient of AGC is significant at the 1 % level, meaning that the AI–DGC CCD can foster GEE. Thus, Hypothesis 2a is tentatively confirmed.
Baseline Regression Analysis Results.
| Variable | GF | GF |
|---|---|---|
| AGC | 0.2342** | 0.2593*** |
| (2.3042) | (2.8401) | |
| Controls | Y | Y |
| Constant | −1.0125* | 0.4971 |
| (−1.7385) | (0.8056) | |
| Year FE | Y | Y |
| City FE | Y | Y |
| Observations | 3036 | 3036 |
| R2 | 0.4172 | 0.5342 |
Notes: The numbers shown in parentheses represent t-values, with ***, **, and * denoting statistical significance at the 1 %, 5 %, and 10 % confidence levels, respectively. The same applies below.
Based on the preceding baseline regression results, the prerequisite that the AI–DGC CCD positively impacts GEE has been fulfilled. Subsequently, a mediation effect test is conducted based on Models (2) and (3). As evident from the regression results presented in Table 4, the regression coefficients of AGC in Columns (1) and (3) are both significantly positive, indicating that the AI–DGC CCD can promote industrial structure upgrading. Furthermore, the regression coefficients of AGC, RIS, and AIS in Columns (2) and (4) are also significantly positive, suggesting that the industrial structure partially mediates the AI–DGC CCD’s impact on GEE. In other words, the AI–DGC CCD can enhance GEE by facilitating industrial structure upgrading. Hence, Hypothesis 3a is confirmed. Additionally, the regression coefficient of AGC in Column (5) is significantly positive, demonstrating that the AI–DGC CCD can improve UERI. Simultaneously, the regression coefficients of AGC and UERI in Column (6) are also significantly positive, indicating that UERI partially mediates the AI–DGC CCD’s impact on GEE. That is, the AI–DGC CCD can enhance GEE by enhancing UERI. Thus, Hypothesis 3b is also confirmed.
Mediation Effect Test.
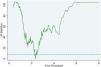
Prior to estimating parameters using the panel threshold model, it is essential to determine the number of thresholds and the threshold values for the threshold variable. In this study, the bootstrapping method with 300 repetitions is employed to test for single, double, and triple thresholds for ATT. As shown in the threshold test results presented in Table 5, the p-values for the double and triple thresholds are 0.7043 and 0.6552, respectively, thus failing to pass the test of significance. In contrast, the single threshold is significant at the 1 % level. Additionally, the likelihood ratio function plot in Fig. 2 indicates that the critical value of 7.35 at the dashed line is significantly greater than the threshold value. Therefore, a single threshold should be adopted for analysis.
The threshold regression results listed in Table 6 reveal that, in case of a threshold variable Index < 0.2373, the AI–DGC CCD has an apparent positive impact on GEE. Conversely, when the threshold variable ATT exceeds the threshold value of 0.2373, the AI–DGC CCD exert a significant negative influence on GEE. This indicates the existence of a threshold effect based on PEC in the impact of the AI–DGC CCD on GEE. When PEC surpasses the threshold value, it exerts a negative effect on GEE. Therefore, Hypothesis 4 is validated.
Endogeneity testInstrumental variable methodThe instrumental variable (IV) method (two-stage least squares [2SLS]) is employed to cope with potential endogeneity matters. Two IVs are constructed in this paper: The first IV (IV1) is urban terrain ruggedness, which serves as an IV for the AI–DGC CCD. On the one hand, urban terrain ruggedness exhibits a close correlation with both AI and DGC. In the field of AI, the complexity of terrain ruggedness significantly influences the layout and effectiveness of intelligent infrastructure. Specifically, cities with greater terrain ruggedness face increased deployment difficulty and cost for infrastructure such as intelligent sensing devices and data transmission networks due to varied landforms and undulating terrain. This, to a certain extent, constrains the widespread application and in-depth development of AI technologies in these areas. Similarly, DGC is also constrained by terrain ruggedness. In cities with complex terrain, the intelligent upgrading of government services, the integration and sharing of data resources, and other aspects face more geographical and technical challenges. Taking Guizhou Province as an example, despite significant achievements in AI and DGC, its service coverage in terms of breadth and depth still needs to be improved, compared with regions with flat terrain. Therefore, terrain ruggedness satisfies the relevance condition for being an IV. On the other hand, the relationship between urban terrain ruggedness and GEE is not direct and significant. The core of GEE lies in the efficient use of resources and sustainable environmental protection. As a natural geographical feature, terrain ruggedness, although it may have indirect impacts on certain economic activities such as transportation layout and land use, does not directly determine the level of GEE. Therefore, terrain ruggedness meets the irrelevance requirement for an IV and can be used as an effective one.
The second IV (IV2) is optical fiber cable density. On the one hand, optical fiber cable density is closely related to both AI and DGC. The level of optical fiber cable density is directly linked to the speed and quality of data transmission. Regions with higher optical fiber cable density (owed to their more developed fiber-optic network infrastructure) can support high-speed, large-capacity data transmission. Efficient data transmission networks can accelerate the circulation of government information and enhance the level of intelligence in government services; moreover, they are crucial for the training of AI algorithms, real-time data processing, and rapid response of intelligent applications. Such an environment provides a solid foundation for the deep integration of AI and DGC, promoting their CCD. Therefore, optical fiber cable density as an IV satisfies the relevance condition. On the other hand, the relationship between optical fiber cable density and GEE is not direct and significant. As an indicator of technical infrastructure, although optical fiber cable density has a direct impact on data transmission efficiency, it does not directly determine the level of GEE. Therefore, optical fiber cable density meets the irrelevance requirement for an IV.
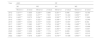
Regression is conducted based on Model (1). Columns (1) and (2) in Table 7 present the regression results for the first IV, while Columns (3) and (4) present the results for the second IV. The LM statistics for both IVs are significant at the 1 % level, thus rejecting the null hypothesis of under identification of IVs. The Wald F values for both IVs are greater than the critical value of 16.38 at the 10 % significance level, rejecting the null hypothesis of weak IVs and meaning that the IVs chosen in this work are reasonable. Meanwhile, the regression results in the second stage show that the regression coefficients of both IVs are obviously positive at least at the 5 % level, consistent with previous studies, suggesting that the present study’s findings are somewhat robust.
Endogeneity Regression Results.
To mitigate the endogeneity issue arising from potential omitted variables due to GEE’s time-dependent effect—i.e., the current level of GEE in a city may be influenced by its past levels—this study employs the GMM approach. Based on the benchmark regression model, the lagged term of GEE is introduced to construct the following dynamic panel model to alleviate endogeneity issues:
where GFi,t−1is the lagged term of GEE, and other variables remain consistent with those in Eq. (1).
The regression results show that the values of the AR(2) and Sargan tests are both > 0.1, indicating that there is no serial correlation in the random disturbance term of the model. Additionally, the model passes the overidentification test. Therefore, this study is suitable for using the GMM approach. Meanwhile, the regression results in Column (5) of Table 7 suggest that the coefficient of the core explanatory variable, AGC, is obviously positive at the level of 1 %, consistent with previous research conclusions, meaning that this study’s findings have certain robustness.
Heterogeneity analysis in benchmark regressionResource-dependent and non-resource-dependent citiesChina boasts a vast territory, with significant variations in resource endowments, economic structures, and development models among cities. Drawing on the classification criteria outlined in the National Sustainable Development Plan for Resource-Based Cities, issued by the State Council, this study classified the research samples into 105 resource-dependent cities and 171 non-resource-dependent cities, conducting grouped regression analyses.
According to the regression results presented in Table 8, a notable heterogeneity is observed in the AI–DGC CCD’s impact on GEE between resource-dependent and non-resource-dependent cities. Specifically, the AI–DGC CCD significantly enhances GEE in non-resource-dependent cities. This is attributed to the diversity and flexibility of their economic structures, which often feature a more balanced and diversified industrial layout, not reliant on a single natural resource extraction and processing. Facilitated by DGC, non-resource-dependent cities can better integrate and utilize data resources, enhancing the rationality and precision of government decision-making. Simultaneously, the introduction of AI technology enhances the intelligence and automation levels of government services, improving administrative efficiency and service quality.
Benchmark Heterogeneity Grouping Regression Results.
This CCD model optimizes and upgrades the industrial structure of non-resource-dependent cities, promotes the development of the green economy and reduces energy consumption and emissions, thereby significantly enhancing GEE. However, in resource-dependent cities, the AI–DGC CCD’s impact on GEE is not significant. This is primarily due to resource-dependent cities’ long-term dominance by resource extraction and processing industries, leading to a relatively monolithic economic development model and often unreasonable industrial structures and low resource-utilization efficiency. In the process of transformation and upgrading, resource-dependent cities face significant technical and market risks, making the transformation challenging. Although DGC and the introduction of AI technology have somewhat improved the level of intelligent governance, due to the weak foundation for industrial restructuring and green economic development, these technologies have not fully realized their potential and have limited effects on enhancing GEE.
Level of digital economyThe level of digital economy influences the development of AI and DGC, subsequently impacting GEE. Therefore, there is a need to investigate the heterogeneity in the impact of the digital economy level on GEE. This study classifies cities with above-average digital economy levels as high-level digital economy cities and those with a below-average level as low-level digital economy cities. Based on this classification, heterogeneity in the digital economy’s impact on GEE is examined through grouping.
As shown in Table 8, the AI–DGC CCD significantly improves ecological efficiency in high-level digital economy cities, with insignificant impacts on low-level digital economy cities. This may be because high-level digital economy cities typically possess strong technological innovation and industrial integration capabilities. These cities can fully leverage AI technology to promote the intelligent upgrading of DGC, achieving precision and efficiency in government services, decision-making, and supervision. Meanwhile, high-level digital economy cities possess abundant data resources and efficient data processing and analysis capabilities. These data resources provide a solid foundation for the implementation of AI technology, enabling governments to more accurately grasp market dynamics, predict trends, and formulate more scientific and reasonable policies. This, in turn, optimizes resource allocation, enhances production efficiency, and promotes the development of the green economy.
In contrast, for low-level digital economy cities, the AI–DGC CCD’s impact on GEE is insignificant. This may be due to the lack of sufficient technological infrastructure and innovation capabilities to support AI technology’s widespread application and DGC’s intelligent upgrading in these cities, posing significant technical barriers and constraints in promoting the green economy. Additionally, low-level digital economy cities often face issues such as monolithic industrial structures and difficulties in transformation and upgrading. Dominated by traditional industries, these cities lack the support of emerging and high-tech industries. Although they are striving to optimize and upgrade their industrial structures under the impetus of AI and DGC, due to the lack of sufficient policy, technical, and financial support, the progress and effectiveness of transformation and upgrading are not significant, resulting in the AI–DGC CCD’s insignificant impact on GEE.
Intensity of environmental regulationThe intensity of environmental regulation influences the environmental protection measures adopted by enterprises, subsequently impacting GEE. Therefore, it is necessary to investigate the heterogeneity in the impact of environmental regulation intensity on GEE. In this study, we follow the approach of Xu et al. (2022) to measure the intensity of environmental regulation. Cities with an intensity of environmental regulation above the mean value are classified as having high levels of environmental regulation, whereas those with an intensity below the mean value are categorized as having low levels of environmental regulation. Based on this classification, heterogeneity in environmental regulation’s impact on GEE is examined through grouping. As listed in Table 8, the AI–DGC CCD significantly improves GEE in cities with high-intensity environmental regulation, with insignificant impacts on cities with low-intensity environmental regulation. This may be because cities with high-intensity environmental regulation typically have higher requirements for environmental protection and eco-friendly development, thus prompting enterprises to increase technological innovation efforts to meet stricter environmental standards. With the introduction of AI technology, enterprises can achieve more efficient and environmentally friendly production methods. Simultaneously, DGC can provide more precise policy support and regulatory services, promoting the development of the green economy. In contrast, cities with low-intensity environmental regulation seldom prioritize environmental protection sufficiently, while enterprises in these cities often have relatively weak environmental awareness and technological innovation capabilities. This makes it difficult for enterprises to effectively respond to stricter environmental standards. Although introducing AI technology can bring about certain technological innovations and efficiency improvements, in the absence of sufficient environmental awareness and policy support, its role in promoting the green economy is limited.
Intensity of intellectual property protectionStudies have shown that intellectual property protection can significantly incentivize enterprises to increase R&D investment and also promote green technological innovation. Different intensities of intellectual property protection may have different impacts on GEE (Nasirov et al., 2022). In this study, we adopt Luo and Wang’s (2024) methodology to measure the intensity of intellectual property protection. Cities with an intensity of intellectual property protection above the mean are designated as having high protection, while those with an intensity below the mean are considered to have low protection. Based on this classification, heterogeneity in the impact of intellectual property protection on GEE is examined through grouping. As shown in Table 8, the AI–DGC CCD significantly improves green efficiency in high-protection cities, with insignificant impacts on low-protection cities. This is primarily attributed to high-protection cities’ robust legal protection for technological innovation, reducing the risk of technology leakage and imitation, thereby incentivizing more AI technological innovations and innovations in digital government service models. In this environment, the widespread application of AI technology can optimize government decision-making processes, improve public service efficiency, promote precise resource allocation and efficient utilization, and drive the green economy’s development. Meanwhile, DGC can strengthen environmental regulation, promote the implementation of green and low-carbon policies, and provide strong support for GEE’s improvement. In contrast, in low-protection cities, the AI–DGC CCD’s impact on GEE is relatively insignificant. This is primarily because these cities often lack effective intellectual-property protection mechanisms, leading to AI technological innovations being easily stolen or imitated, thus dampening innovators’ enthusiasm. In this situation, even if AI technology and DGC achieve CCD, due to the lack of continuous innovation momentum, their ability to promote GEE improvement will be limited. Furthermore, inadequate intellectual-property protection may hinder the introduction of foreign investment and advanced technology, further weakening the potential for green economic development.
Spatial econometric analysis of AI and DGC's impact on GEESpatial correlation testGlobal Moran IndexThis study employs the Global Moran Index to conduct spatial autocorrelation tests on the CCD degree of AI and DGC, as well as green ecological efficiency across 276 cities from 2012 to 2022. The Global Moran Index ranges from [−1,1], where a value > 0 indicates positive spatial autocorrelation, and a value < 0 indicates negative spatial autocorrelation. As shown in Table 9, from 2012 to 2022, both the CCD degree of AI and DGC and GEE exhibit positive Moran’s I values, which are significant at the 1 % level, indicating a significant positive spatial autocorrelation characteristic. This suggests that the spatial correlation effect is significant overall, making the adoption of spatial econometric models appropriate.
Global Moran Index.
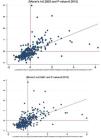
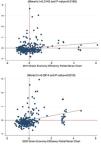
To examine the spatial correlation between a city and its neighboring cities, this paper uses a geographic adjacency matrix to plot local Moran’s I maps for the CCD index of AI and DGC, as well as GEE. Due to space limitations, only the results for the years 2014 and 2020 are reported, with each point representing a city, totaling 276 cities. As shown in Figs. 3 and 4, most points corresponding to the local Moran’s I for the CCD index of AI and DGC and GEE are distributed in the first and third quadrants, suggesting an obvious positive spatial spillover effect at the local level, consistent with the results of the Global Moran’s I. This suggests that the choice of spatial econometric models to study the AI–DGC CCD’s impact on GEE is appropriate.
Selection of spatial econometric models

The test results for the spatial econometric models are presented in Table 10. Initially, results from both the LM and robust LM tests show statistical significance at the 1 % level, thus rejecting the null hypothesis, suggesting that the spatial econometric model should possess characteristics of both spatial lag and spatial error, preliminarily determining that the spatial Durbin model should be selected. Secondly, as the Hausman test yields significance at the 1 % level, the fixed-effects model should be selected. Furthermore, the LR test results for fixed effects are significant at the 1 % level, indicating that both time and individual fixed effects should be selected. Lastly, the LR and Wald test results are significant at the 1 % level, indicating that the spatial Durbin model cannot be simplified to a spatial lag or spatial error model. Therefore, this paper selects a spatial Durbin model with both time and individual fixed effects.
Test Results for Spatial Econometric Models.
Firstly, as can be observed from Table 11, when regression is conducted using Model (8) based on W1 and W2, regardless of whether it is the static model or the dynamic model, the first-order coefficient of the core explanatory variable, AGC, is positively significant at the 1 % level. Meanwhile, although the second-order coefficients are all negative, they are not significant. This indicates that the AI–DGC CCD can significantly enhance local GEE, further validating Hypothesis 2a.
Regression Results of Spatial Econometric Models.
Secondly, regarding the spatial lag coefficients, irrespective of whether it is the static model or the dynamic model, the first-order spatial lag coefficients of the core explanatory variable AGC are significantly positive, while the second-order spatial lag coefficients are significantly negative. This demonstrates that the AI–DGC CCD exerts an inverted U-shaped spatial spillover effect on neighboring regions, thus validating Hypothesis 2b
Lastly, as evident from the time lag coefficients of GEE, under both W1 and W2, the coefficients are significantly positive at the 1 % level. This signifies that there exists a notable path dependence in GEE across time dimensions, implying that the GEE from the previous period has a promoting effect on the current period’s GEE.
Decomposition of spatial effectsWhen spatial effects exist among variables, the regression coefficients of explanatory variables cannot unbiasedly reflect their impacts on both the local and neighboring regions’ dependent variables. Therefore, the influence of the AI–DGC CCD on GEE is decomposed into direct effects, indirect effects, and total effects through partial differentiation. Specifically, the direct effect represents local explanatory variables’ impact on local GEE, the indirect effect signifies their impact on neighboring regions’ GEE, and the total effect (which is the sum of the two) indicates the local explanatory variables’ overall impact on GEE across all regions. Given that this is a dynamic spatial Durbin model, the AI–DGC CCD’s impact on GEE can further be categorized into short-term and long-term effects along the temporal dimension, as shown in the decomposition presented in Table 12.
Decomposition of Spatial Effects.
Firstly, regarding the direct effects, under both W1 and W2, both the short- and long-term direct effects exhibit significantly positive first-order regression coefficients for the core explanatory variable AGC, while the second-order regression coefficients for AGC are insignificant. This suggests that the AI–DGC CCD promotes local GEE, further validating Hypothesis 2a.
Secondly, in terms of indirect effects, under both W1 and W2, for both short-term and long-term indirect effects, the first-order regression coefficients for the core explanatory variable, AGC, are significantly positive, whereas the second-order regression coefficients for AGC are significantly negative. This indicates that the AI–DGC CCD’s spatial spillover effect on neighboring regions’ GEE demonstrates an inverted U-shaped relationship, where it first increases and then decreases, further validating Hypothesis 2b.
Spatial robustness checksTo ensure the robustness of these findings, this study employs four robustness checks: altering the measurement of the dependent variable, adjusting the sample time span, substituting the spatial weight matrix, and excluding certain samples. The first method involves changing the measurement approach of the dependent variable by adopting the non-directional distance function model. The second method modifies the time span of the research samples. Given the varying short-term impacts of the COVID-19 pandemic on cities across the country since early 2020, to avoid potential biases introduced by the pandemic, samples from 2020 to 2022 are excluded, adjusting the sample time span from 2012 to 2022 to 2012–2019. The third method replaces W1 and W2 with the economic-geographic distance spatial matrix W3. The fourth methodology entails applying a 2 % winsorization to both explanatory and core explanatory variables, effectively eliminating extreme data points from consideration. This procedure aims to diminish the irrational impact of outliers on regression outcomes.
As shown in Table 13, the coefficients of the first-order term of the core explanatory variable AGC are positively significant at the 1 % level across all four methods, while the coefficients of the second-order term are insignificant. This indicates that the coordinated coupling of AI and DGC can significantly enhance local GEE. Additionally, the coefficients of the spatial lag term of the first-order term of AGC are significantly positive in all four methods, while the coefficients of the spatial lag term of the second-order term are significantly negative. This suggests that AI–DGC CCD exerts a nonlinear inverted U-shaped spatial spillover effect on neighboring regions’ GEE, aligning with the previous research conclusions and demonstrating the robustness of this study’s findings.
Results of Spatial Robustness Checks.
Using cross-sectional time-series data of 276 Chinese cities for the period 2012–2022, this study analyzed the AI–DGC CCD’s impact on GEE through dynamic spatial econometric models and threshold models. Its primary conclusions are as follows: (1) There exists a coupling and coordination mechanism between AI and DGC. From 2012 to 2022, China’s AI level, DGC level, and their coupled coordination degree generally shows an upward trend. (2) The AI–DGC CCD has a positive effect on local GEE and a nonlinear inverted U-shaped spatial spillover effect on neighboring areas’ GEE. (3) The AI–DGC CCD enhances local GEE by promoting industrial structure upgrading and UERI. (4) The AI–DGC CCD’s impact on GEE exhibits a threshold effect based on PEC. When PEC is below the threshold, it positively affects GEE; above the threshold, it negatively affects it. (5) For non-resource-dependent cities, those with high digital-economy levels, strong environmental regulations, and robust intellectual-property protection, the AI–DGC CCD’s impact on GEE is more significant.
Theoretically, this study contributes to research on the AI–DGC juncture. On the one hand, it corroborates the coupling coordination mechanism between AI and DGC, identifies the upward trend of their coupling coordination degree, and provides empirical evidence for the construction and improvement of relevant theoretical models. On the other hand, it unveils the complex action pathways through which AI and DGC’s coupling coordination influences GEE—particularly, the local positive effect and the nonlinear inverted U-shaped spatial spillover effect in neighboring areas—along with the internal logic of enhancing local GEE via industrial structure upgrading and ecosystem resilience. This expands the theoretical boundaries of influencing factors for GEE, thus offering new theoretical perspectives and analytical frameworks for subsequent research on AI and DGC’s synergistic role of in economic green transformation.
In terms of its practical implications, this study’s conclusions offer valuable practical insights for urban policymakers. By clarifying the AI–DGC CCD’s spatial spillover mechanisms and mediating pathways, this study provides a scientific basis for formulating differentiated regional policies, optimizing resource allocation, and promoting collaborative governance, thereby facilitating the integration of AI and digital governance in green economic development.
However, this study had some limitations. (1) First, this study was constrained by data availability and research conditions: AI levels were measured using AI patents, while DGC and GEE levels were assessed through the construction of indicator systems. These indicator-based measurements may have limitations and lack sufficient accuracy. (2) Second, this study covered the 2012–2022 period; thus, the dynamic responses to emerging technological and policy changes may not have been fully captured within this period.
Future research directions include the following: (1) Subsequent studies can further optimize the indicator system by incorporating more indicators that reflect AI and DGC, thereby improving the accuracy of the measurements. (2) The study’s time span can be extended to track new developments in AI and DGC, as well as their long-term impacts on GEE. (3) Case studies can conduct an in-depth analysis of the successful experiences and lessons learned from how the AI–DGC CCD drives improvements in GEE in typical cities, providing more targeted guidance for practice. (4) More cutting-edge models can be adopted to enhance the robustness of this study’s findings. (5) The core logic underlying the mechanism in this study—by which technology empowers governance to optimize resource allocation and reduce environmental externalities—possesses a theoretical basis for cross-country application to a certain extent. It is particularly applicable to countries facing pressure for industrial structure transformation, pursuing green development goals, and needing to enhance government governance effectiveness through digital technologies. Future research can further examine whether the study’s findings are applicable to other countries. However, the effectiveness of applying these findings across different nations requires careful consideration of cross-country differences in institutional environments, economic and technological foundations, sociocultural contexts, and industrial structures—all to ensure the practical applicability of this study’s results.
Policy recommendationsStrengthening the coupling and coordination mechanism and promoting the deep integration of AI and DGCGiven the coupling and coordination mechanism between AI and DGC, governments and enterprises should collaborate to strengthen its development and optimization. Enterprises should actively explore innovative applications of AI technologies in DGC, leveraging big data, machine learning, and other technological means to enhance the rationality and efficiency of government decisions. Governments should introduce policies to encourage and support enterprises’ participation in the AI–DGC CCD. Simultaneously, they should increase investments to improve the infrastructure for AI and DGC, thus providing a solid foundation for their deep integration.
Promoting industrial structure optimization and upgrading and enhancing UERIThe AI–DGC CCD can enhance local GEE by facilitating the optimization and upgrading of industrial structures and the improvement of UERI. Enterprises should actively undergo transformations to develop low-carbon, environmentally friendly, and energy-efficient industries, thereby reducing the proportion of high-pollution and high-energy-consumption sectors. Additionally, enterprises should increase investments in research and development to explore and apply technologies that enhance UERI, such as ecological restoration and environmental monitoring technologies, aiming to bolster ecosystems’ resilience to disruptions and capacity for recovery. Governments should enact corresponding policies, such as establishing special funds and providing tax incentives, to support firms in optimizing and upgrading their industrial structures and enhancing UERI.
Optimizing spatial layout and leveraging regional synergiesGiven the nonlinear inverted U-shaped spatial spillover effect of the AI–DGC CCD on neighboring areas’ GEE, governments and enterprises should fully consider interregional interactions and optimize regional spatial layouts. Enterprises should strengthen cooperation with surrounding areas to jointly develop green technologies and environmental protection projects, achieving win-win development through technology sharing and resource complementarity. Governments should strengthen supervision, encourage the establishment of cooperation mechanisms between neighboring regions, guide enterprises to make reasonable layouts, and avoid industrial homogenization competition and unreasonable industrial transfers. Additionally, governments should establish and improve regional policy coordination mechanisms, enhance policy communication and information sharing, and promote regional GEE’s overall improvement.
Scientifically formulating environmental policies and paying attention to PECAddressing PEC’s threshold effect on GEE, governments should scientifically formulate environmental policies and pay attention to changes in PEC. Governments should improve the dynamic monitoring mechanism for PEC and set reasonable environmental protection goals based on the development stages and actual situations of AI and DGC. When PEC is below the threshold, governments should increase investments and supervision in environmental protection to improve environmental quality.
Implement tailored policies to promote GEE in different types of citiesConsidering the AI–DGC CCD’s differential impacts on GEE in different types of cities, governments should implement tailored strategies. For non-resource-dependent cities, cities with high digital-economy levels, strong environmental regulations, and robust intellectual property protection, governments should further increase support to promote the deep integration of AI and DGC, thus enhancing these cities’ GEE. Meanwhile, for cities lagging in development, governments should provide targeted support measures to help them achieve industrial transformation and eco-friendly development.
FundingThis paper was funded by the Fund for Academic Innovation Teams of South-Central Minzu University (Grant No.: XTS24017); and the Key Project of Scientific Research of Hunan Provincial Department of Education (Grant No.: 23A0681).
CRediT authorship contribution statementFang Xiong: Validation, Supervision, Investigation, Funding acquisition, Formal analysis, Conceptualization. Yili Chen: Writing – original draft, Resources, Methodology, Data curation. Shuhong Gu: Writing – review & editing, Project administration, Methodology, Funding acquisition. Xue Li: Writing – original draft, Visualization, Software, Funding acquisition.