


A growing mass of study has underscored that slack resources are fundamental for innovation. However, empirical research has generated inconclusive findings that have invigorated an ongoing scholarly discussion about which sorts of slack resources are most beneficial to innovation. To resolve this debate, an increasing number of scholars contend that the use of slack resources to explain the slack-performance relationship could be contingent on both the firms’ strategic positions and their firm-level characteristics. In these debates, the slack time has received less attention from scholars. However, while practical usage of slack time by the multinational corporation has been reported to affect performance, the empirical tendency linking it to any objective performance indicators of the firm such as innovation is few. As a result of this, this study conducts a two-way and three-way moderation effect by extracting two generic and most researched firm-level attributes, which are firm age and size to explain the slack-performance relationship of innovative firms. In order to extend the scant literature on slack time, this study draws on the moderating role of both firm age and size. The three-way estimation of slack time-age-size-performance relationship employs a cross-section dataset from the World Bank Enterprise and Innovation Follow-up surveys of 9503 firms in 11 countries of sub-Saharan Africa. The study uses an Instrumental Variable binary treatment model with a direct-2sls for the central estimation, and a Tobit model for the robustness checks. The results of this study reveal that age and size significantly moderate the impact of slack time on innovation. In particular, the findings indicate that the age and size of firms efficiently moderate the slack-performance relationship to support the introduction of innovation. The study further reveals that a three-way estimation of the variables results in a significant decline to the optimisation of firm-level innovation. For experts, the findings offer an essential insight as they reveal how top managers can manage with the allotment of slack time to perhaps specific employees in fostering a compelling introduction of innovation.
Intangible assets such as capabilities and knowledge represent an ever-growing source of economic values for firms in the contemporary economies (Gao & Hitt, 2012) Penrose, Nelson and Winter's definitions of a firm offer a divergence to traditional price theory, emphasising a dynamic Schumpeterian insight of competition (Nelson & Winter, 1982). The scholars seek to attain functional stability between stationary and changing efficacy, where a firm attempts to discover a stability between utilising previously comprehensive resources and managerial learning of new practices and competencies (Ahokangas, 1998; Ruzzier, Antoncic, & Konecnik, 2006). One of the firm-level practices that studies have considered essential for innovation is slack resources (Daniel, Lohrke, Fornaciari, & Turner, 2004; George, 2005; Nohria & Gulati, 1997; Yang, Chou, & Chiu, 2014) and slack time (Agrawal, Catalini, & Goldfarb, 2015; van Uden, Knoben, & Vermeulen, 2017). van Uden et al. (2017) in their study, reveal a positive correlation with product innovation and employees’ slack time. This current study extends previous studies on the relationship between slack time and innovation. The study does it by moderating the age and size of the firms with slack time to predict the effect on product innovation.
Product innovation is exceptionally quintessential to the development, success, and future existence of firms. While its exclusive attributes in small and medium-sized enterprises (SMEs) have earned increasing consideration in the scholarly literature, there is incomplete information regarding how age and size with firm-level practices interaction could support the introduction of innovation. Numerous studies have documented the relationship between age, size and overall firm performance (see, for instance, Adelino, Ma, & Robinson, 2017; Bianchini, Krafft, Quatraro, & Ravix, 2018; Coad, Segarra, & Teruel, 2016; Coad, Holm, Krafft, & Quatraro, 2018; Cowling, Liu, & Zhang, 2018; Cucculelli, 2018; De Meulenaere, De Winne, Marescaux, & Vanormelingen, 2018; Dickens, 2018; Grazzi & Moschella, 2018; Hansen, 1992; Huynh & Petrunia, 2010; Majumdar, 1997; Pellegrino, 2018; Shanmugam & Bhaduri, 2002; van Stel, Millán, Millán, & Román, 2018; Yasuda, 2005).
Following the heterogeneous review of essential literature, this paper investigates the moderating influence of slack time, age and size on the likelihood of the successful implementation of product innovation amongst firms in sub-Saharan Africa. In the light of the firm-level practices, van Uden et al. (2017) in their study, find slack time to relate significantly positive with the ability of the firms to implement product innovation. In the study, the role of the quality of human capital is also revealed to be essential for the success of innovative firms.
Indeed, innovation has been acknowledged as an essential and significant resource for firm survival and growth (Bourgeois, 2011; Nohria & Gulati, 1996; Vanacker, Collewaert, & Zahra, 2017; Zahra & Covin, 1993). It has been an essential subject of attention in the organisational concept. Also, slack is another paradigm that has gathered the interest of organisational thinkers (Bourgeois, 1981; Cyert & March, 1963; Tan, 2003; Tan & Peng, 2004, 2010; Voss, Sirdeshmukh, & Voss, 2008). The association of surplus resources above that required to introduce a product or service is contended to both foster and deter the success of innovation in firms. It has been argued that firms with ample slack resources can exploit strategic planning to counterbalance the adverse consequences of excessive slack and assign slack resources to attain improved performance. Again, firms in possession of insufficient slack resources may find unpremeditated relatively than planned activities are more beneficial to higher performance (Wang, Guo, & Yin, 2017).
Researchers have mostly entirely concentrated on the specific types of slack, which are slack resources covering both human, financial and organisational with less attention on slack time. Regarding core innovation measures, only van Uden et al. (2017) have examined empirically the effect of slack time on innovation (precisely, product innovation). Mishina, Pollock, and Porac (2004), for instance, centred on the performance effects of financial and human resource slack for firms that are utilising various stratagems. These studies have not covered the effect of slack time on the performance of innovative firms. According to resource management theory, it is emphasised that resources should not solitarily be amassed, but also packaged, and leveraged to generate competitive gains (Ndofor, Sirmon, & He, 2011; Sanyal & Sett, 2011; Sirmon, Hitt, & Ireland, 2007). Thus, the accessibility of slack resource in a specific form may generate an additional or less efficient utilisation of resource slack in supplementary sorts of resources. With this current study, the argument moves beyond the role of slack time on innovation but considers the role in which the age and size of the firms play in the offering of slack time to employees in the workplace to support the propensity to which firms innovate.
Furthermore, resource management theory shows that the difficulties in the management resources, change as firms shove via the life cycle (Ndofor et al., 2011; Sirmon, Hitt, Arregle, & Campbell, 2010). For example, in the initial stage of the development of firms, it is particularly tasking to acquire external resources because of the absence of authenticity of novel firms (Brush, Greene, Hart, & Haller, 2001). As a result, slack resources could be principally beneficial, since they permit the exploitation of novel prospects or opportunities without procuring extra resources from the external firm (Bradley, Shepherd, & Wiklund, 2011; Bradley, Wiklund, & Shepherd, 2011; Hayton, 2003). This current study focuses on the moderating role of firm age and size with slack time in the development of innovation. This is imperative because the availability and accessibility of dataset have induced researchers towards examining the performance effects of slack resources in state-owned firms (Bromiley, 1991; Mishina et al., 2004), more substantial or reputable privately-owned firms (George, 2005) and global firms (Nohria & Gulati, 1996). Studies on the role of slack time in emerging firms in sub-Saharan Africa have evolved merely more lately (see Agrawal et al., 2015; van Uden et al., 2017), but characteristically concentrate on financial slack (Bradley, Wiklund, et al., 2011) or organisational slack.
Organisational exploration has progressively concentrated on why bosses of firms accrue, sustain, and adopt specific sorts of resources as a technique to attain firm feat (Wefald, Katz, Downey, & Rust, 2010). Initial studies in the field contend that organisational slack directly influences firm performance (Bourgeois and Source, 1981; Moses, 1992; Bourgeois & Singh, 1983). However, for over 20 years, the related research has offered differing standpoints on how slack explicitly affects firm performance (Wefald et al., 2010). Empirical research has suggested that organisational slack cushions the firm from sudden changes in its external milieu (Bansal, 2003; Thompson, 1967), boosts the firm's capability to adapt to changes in consumer requirement (Benson, Pfeffer, & Salancik, 1978) and guides to functioning ineffectiveness (Singh, 2018).
Moreover, it has been posited that beyond maximum points of slack are counterproductive and uneconomical while below optimum points of slack constrain innovation (Geiger & Cashen, 2002; Nohria & Gulati, 1996). Empirical studies have elucidated the connection to be curvaceous. Also, conventional literature debates the association of firm-specific elements which would comprise the slack-innovation association to the continual production beyond standard points of gain (Barney, 1991, 2001a, 2001b; Wernerfelt, 1984). As firms increasingly confront more considerable tensions either to be more innovative or to control resources more proficiently, a likely quandary evolves. If firms uphold slim points of slack resources, innovation might be hampered. Another essential aspect that could allow firms to explore slack resources judiciously could be the age and size of the firms; the arguments that remain at the heart of Schumpeter (size) and Arrow (age).
This study is relevant because, from the practical application of slack time, it has shown that only multinationals or reputable firms have utilised these slack resources to foster performance. These firms offer different nomenclature to categorise the offering of slack time to employees for creative thinking. While looking in-depth into the documented studies, it becomes evident that the age and size of the firms could matter in the utilisation of slack time. Three significant questions emerge that this study provides answers to from the observation of the practical application and utilisation of slack time by these multinationals. First, does size matter in the usage of slack resources (time)? Second, does age offer an opportunity for innovative firms to leverage on the utilisation of slack time for innovation optimisation? Third, does the blend in a three-way moderation of slack time, age and size offer much substantial advantage for the firm to foster a more significant amount of innovativeness?
This study contributes to knowledge management and innovation literature. First, we suggest that firm age and size may affect the slack time-innovation performance nexus. This has not been attempted in prior studies. While the relationship between other slack resource and innovation has much been documented, the objective that this study focuses on has not been explored. The contribution to the literature offers essential insights and new implications for knowledge and workforce management. Second, the practical usage of slack time and its anecdotal effect on performance has much been documented. However, its empirical relevance linking it to traditional innovation has been elusive. Only the study of van Uden et al. (2017) has robustly evinced the empirical relevance of slack time on product innovation. Their study also moderates slack time with some core knowledge-based variables to predict its application on the implementation of product innovation. This study, however, extends this argument with firm-level attributes (age and size) accounting for effects both on SMEs and large firms, respectively. While it supports the anecdotal account on the usage and application of free time by multinationals, it further emphasises how relevant it could be for SMEs in developing countries. The predictive interactive margins offer a more nuanced picture in this regard. The study contends on the inconclusiveness of this research and proffers further avenues for future studies.
The rest of the study follows this format. The first aspect of the review of literature concerns the relationship between firm age, size and general firm performance. Further, the literature review abridging the association between the numerous elements of slack and innovation are examined. The following review of the literature focuses on the moderating role of age and size with firm-level performance resource-indicators, and after that, the working hypotheses are developed. The next section describes the data and characteristics of the estimation variables and their measurements. The interpretation of our findings follows while the next section discusses the findings and provides some implications for management. The last section concludes by providing some limitations of the study and offering a probable area for future research.
Theories and hypothesesIn several diverse sectors, firms, not just in technical units, but also organisational compositions, have been beneath the continuous impact of technological advances. The current study incorporates literature that confirms that innovation and know-how strategies and managerial method are crucial components for the success of firms in the marketplace in contemporary society. Prior studies concentrate on the impacts of these elements on firms’ financial gains, market stake stance, and success or difficulties of individual acclimatisation. Some contend that firm age and structure are related with the inimitability of innovations in firms and recommend that when small and medium firms (SME) thrive in innovation via technological strategies, stratagems and managerial directives, they can be simply replicated by their rivals. From this point, this current study examines the empirical-interactive links between employees’ slack time, firm size, firm age and innovation performance in sub-Saharan Africa.
Schumpeter contends in Capitalism, Socialism, and Democracy that the intensity of innovation is positively associated with short-run shield and market supremacy (Schumpeter, 1942; Walsh, Hendry, & Utley, 1987). Schumpeter supposes that bigger firms require short-run permissible guard that could offer sufficient short-run market control to generate an inducement to devote resources to R&D. Further, Schumpeter argues that in the absence of the desired firms’ protection, bigger firms are not probable to devote resources to innovative activities, and hence, technological change becomes elusive. Schumpeter maintains further that only sizeable firms can stimulate technological change since small firms could be inept of “optimal” expenditures for R&D.
Explicitly, small firms may not have the capability to devote adequate resources on R&D since making so would be too harmful in such a competitive milieu. Schumpeter then contends that big firms have a better stimulus to devote resources substantially on R&D than small firms. It is argued that such assertion holds for the big firms because they possess substantial resources accessible to accelerate technological change and can anticipate higher returns to innovation than smaller firms because their market stake or market supremacy could function as a cushion to instantaneous replication or imitation. While Schumpeter argues in favour of firm size as an essential ingredient to devote resources for R&D, Arrow seems to pitch his tent with the age of the firms. Arrow (1962, 2015) argues that small competitive firms are more likely to invest less in R&D merely because they are risk-averse, economically feeble, and unable to utilise the gains to innovative activities wholly. The next paragraphs review the role of firm age, size, and how they uniquely connect to firm performance. Fig. 1 illustrates a summary of the conceptual model.
Firm size and performance
In the reviews of the empirical literature on the relationships between innovation, market structure and firms’ size (Syrneonidis, 1996) indicates in the assessment that there is modicum evidence in proof of the Schumpeterian hypothesis that market supremacy and large firms intensify innovations. Nevertheless, positive relations between intensity, size and innovative activity is revealed to ensue when certain conditions are fulfilled, which may include high sunk costs per specific task, economies of scale and capacity in the creation of innovation rents.
The ability of an organisation to invest in R&D is considered by scholars to be reliant on the size of the firm and innovation output (Baumann & Kritikos, 2016; Czarnitzki & Hottenrott, 2011; Hall, Lotti, & Mairesse, 2009; Shefer & Frenkel, 2005), ownership, organisational structure, industrial branch and location (Kaufmann, Schwartz, Frenkel, & Shefer, 2003). Firm size remains one of the most examined variables in exporting because several small firms perceive their deficiency of size as an impediment in exporting. The variable of a firm size that has been utilised more often is enterprises employees (Bloodgood, Sapienza, & Almeida, 1996), followed by sales volume, turnover (Arias-Aranda, Minguela-Rata, & Rodríguez-Duarte, 2001). Acs and Audretsch (1987) examine the premise that the innovative comparative gain between large and small firms is ascertained by market intensity or strength, the degree of entry obstacles, the structure of firm size in the industry, and the general significance of innovation activity. Their findings reveal further that large firms have an innovative comparative gain in capital-intensive industries, clustered, extremely allied, and create a unique good.
On the other hand, small firms have a relative benefit in substantially innovative industries, using a significant element of the skilled workforce, comprised a relatively high percentage of large firms. Man, Lau, and Chan (2002) emphasise that small firms are not reduced forms of bigger firms. Smaller firms diverge from more prominent firms in their management style, freedom, ownership, and measure or capacity of control (Coviello, Brodie, & Munro, 2000; Coviello & Cox, 2006) Smaller firms have distinct managerial configurations, retorts to the milieu and ways in which they contend with other firms (Man et al., 2002). Likened to their bigger rivals, SMEs appear to have to overwhelm bigger impediments; nevertheless, by employing their explicit advantage and realising niche markets, they may pay for their shortcomings (Kafouros, Buckley, Sharp, & Wang, 2008; Pleitner, 2004; Pleitner et al., 1998). An interesting twist plays out in the study of Koski, Marengo, and Mäkinen (2012) who examine 398 Finnish manufacturing firms regarding the degree of innovativeness between large and small firms. The findings show that while innovation in small firms profits from the practices that boost employee involvement in decision-making, large firms with more devolved policymaking models do not appear to innovate further than firms with a more inflexible policymaking configuration.
Empirical results have been diverse on the relationship between firm size and performance (Dass, 2000; Ruzzier & Ruzzier, 2014), overall, they incline to demonstrate that bigger firms have size-related superiority which allows them to further effectually involve in global ventures (Aaby & Slater, 1989; Miesenbock, 1988). Firm size could let a substantial gain for bigger firms to harness resources deprived of lesser firms, and thus aid establishments take hazards, endure impediments, and instigate changes. Enlarged scope or size offers an additional market influence on a firm to manage its stakeholders in practical as well as the formal environment (Dass, 2000).
In effect (Bloodgood et al., 1996) find a positive connection between firm size (number of employees) and the degree of being a global market player. The relationship between firm-level innovativeness and firm size seems inconclusive (Liu, 2009). Patacconi and Belenzon (2016) examine the variation in firm innovativeness when size is considered. While the study establishes that the association of performance with applied research (patent) tend to be stronger for small firms, large firms only have an advantage with performance in terms of basic research. In the study of Spanish manufacturing firms, Martínez-Ros and Labeaga (2003) find that firm size plays a role in the ability of firms to innovate.
Interestingly in an earlier investigation of this issue, Ettlie and Rubenstein (1987) decompose the size-performance relationship of firms by considering the degree of employees’ count and how innovativeness is affected. First, the study examines the effect of 1000 employees on the degree of the radicalness of a new product and find no link. The second exploit considers employees between 1200 and 11,000, and the relationship between firm size and innovation relates directly positive. Arias-Aranda et al. (2001) also find firm size measured by turnover to relate significantly positive with the degree of innovativeness of Spanish firms in the service sector, and for Audretsch and Acs (1991); Audrescht et al. (2018) in the case of German firms. Corsino, Espa, and Micciolo (2011) examine the effect of firm size and R&D in leading semiconductor manufacturers. The findings reveal that: (a) decreasing returns to size and R&D expenditures typify the innovation production function of the experimented firms; (b) producers managing a more extensive product collection show a higher tendency to launch new products than their specific market-innovation rival; (c) ageing has positive influences on the firm's capability to innovate. A large part of the arguments in the previous paragraphs relates to the relationship between firm size and some elements of innovation. In the subsequent paragraphs, an attempt is made to document the relationship between firm size and export orientation.
Furthermore, the administrative structure (Barca, 2017) and theory of the firm (Casson, 2005) reflect the founder's vision, personal characteristics, organisational capabilities, and leadership qualities, as well as the pattern of volatility in the industry. A few researchers have found that among the variables that characterise a firm, none has received as much research attention in the export literature as firm size (Bonaccorsi, 1992; Calof, 1994; Miesenbock, 1988). Casson (2005) contends that there are no fundamental contrasts between firms of diverse sizes, yet most studies (e.g., Man et al., 2002; Ruzzier et al., 2006), especially in the framework of a firm's globalization (Coviello & Martin, 2018; Erramilli & D'Souza, 2018; Westhead, Wright, & Ucbasaran, 2001) confirm the suggestion that vast contrasts subsist between sizable firms and SMEs. Bonaccorsi (1992) documents an evidential account of the association between a firm's size and the ability to take part in the global market (export).
Mehran and Moini (1999) examine 279 Wisconsin firms and show that bigger firms are more probable to participate in exporting than smaller firms. Correspondingly, Gemunden (1988) find that in a specific minutest size; the likelihood of exporting surges with growing size, then outside this boundary, a weak relationship between size and exporting is further observed. Although many studies document a positive association, others have had mixed or negative findings. For instance, Gomez-Mejia (1988) examines 388 Florida firms and finds no significant effect of firm size and age on export performance.
Further, Bonaccorsi (1992) confirms the results on export performance; but, when the explained variable is export intensity, the findings do not confirm a positive connection to firm size. The relevance of firm size in the development of being a global market player has also been established in further studies. Manolova, Manev, and Gyoshev (2010), in the study of Bulgarian SMEs, find that firm size relates significantly positive with the ability of the firms to engage in the global market, and the findings vary by industry. Using a Panel dataset from 2005 to 2012 of certain manufacturing firms listed in the Stock Exchange, Akinyomi and Adebayo (2013) find that firm size relates positively with the profitability of Nigerian manufacturing companies. Choi and Lee (2018) examine Korean manufacturing firms find that firm size significantly relates to new and incremental R&D. These findings support the idea that large firms have innovative benefits on smaller firms and that firm size constitutes an essential factor in firms’ diverse R&D activities. Lee (2009) provides evidence that profit rates are positively correlated with firm size in a non-linear manner, holding an array of the firm- and industry-specific characteristics constant. Also, industry-specific fixed effects play a negligible role in the presence of firm-specific fixed effects. Alsharkas (2014) in a study built on the business environment and enterprise performance survey (BEEPS) for 1053 firms consisting of 26 countries between 2002 and 2005, finds a positive and statistically significant association between firm size, competition, access to finance and innovation. By reflecting on these distinct viewpoints, the first hypothesis relates thus:H1 Firm size positively relates to firms’ propensity to implement innovation.
The significance of age to firm dynamics has attracted relatively slight consideration, excluding the management literature. The erstwhile certainty would appear to be that age improves performance and not vice versa (Coad et al., 2018). Primarily, firms tend to learn about their capabilities and how to organise things better as they get older (Anyadike-Danes & Hart, 2018; Anyadike-Danes, Hart, & Lenihan, 2011). The existing empirical literature reveals that life expectancy rises with age (Dunne, Roberts, & Samuelson, 1989; Rossi, 2016) and that improved firms subsist (Baker and Kennedy, 2002). There are, though, motives to disagree with that previous credence. What follows offers some arguments on why age could impair performance.
Some finance articles have revealed a contrary connection between age and ownership intensity (Helwege, Pirinsky, & Stulz, 2007; Holderness, Kroszner, & Sheehan, 1999; Holderness, 2009). In theory, if ownership were positively associated with performance, this symmetry could stimulate a bogus negative link between age and performance. What appears as a link between firm age and performance could also be caused by the age and term of the directors or top echelon in the establishment (Finkelstein & Hambrick, 1990; Graham, Harvey, & Puri, 2013). Coad et al. (2018) argue that the effect of age on performance is intermediated by some elements such as routines, accrued reputation and managerial inflexibility. Acemoglu and Cao (2015) assert that young firms are more probable to implement radical innovation. However, the assertion contradicts the Schumpeterian hypothesis regarding large firms being more innovative. A few studies have documented reviews linking firm age and different forms of performance (see, for instance, Cowling et al., 2018; Cucculelli, 2018; Grazzi & Moschella, 2018; Pellegrino, 2018; van Stel et al., 2018). Owing to this inconclusive review, the second hypothesis is proposed thus:H2 Firm age positively relates to firm-level innovativeness
What is our understanding of slack time, and why is it essential for the implementation of innovation, especially for firms in sub-Saharan Africa? According to Pink (2012), it is designed for periods of independence at which employees choose what projects to work on and how to finish such projects. Burkus and Oster (2012) develop further from Pink's definition two plausible application of slack time: the transient and persistent. According to the authors, the former deals with independence offered for separate times through structured events while the latter refers to the independence that occurs for a specific percentage of work time. Slack is described to be the distinction between overall resources and entire essential payments (Cyert & March, 1963, p. 42). According to Bourgeois (1981); Bourgeois (2011); Wefald et al. (2010) slack is a resource bolster that firms can employ in a flexible approach, to thwart hazards posed by rivals (Greenley & Oktemgil, 2003) and take advantage of potential prospects to pursue sales growth (Weinzimmer, 2000). The growing literature has theoretically reassessed slack by incorporating its location, as Singh (2018) will classify as absorbed versus unabsorbed and availability and approachability (Finkelstein & Hambrick, 1990). Slack time, on the other hand, refers to time outside the regular working hours that management allots to employees either to enhance a company's performance or employees’ personal development. Top managers of some big corporations have offered continuously slack time to employees to develop new ideas in the workplace.1
Though organisational study postulates many relations between a firm's slack resources and performance, results to date have been vague and still emerging. However, the behavioural theory asserts that slack resources foster innovation, while agency theory contends that slack resources signify a sort of inadequacy and constrain innovation (Lee & Wu, 2016). The handiness of strategically useful resources and the coordinating practice capturing firms’ resources, constraints the capability to transform an innovative strategic position into superior performance outcomes. Such a standpoint is coherent with the resource-based view (Barney, 1991; Makadok, 2001) that the ownership of beneficial, unique, and complex to imitate resources, utilised under a managerial framework that enables greatest value appropriation, ascertains competitive advantage. Also (Paeleman & Vanacker, 2015; Vanacker, Collewaert, & Paeleman, 2013) in the study of exporting capability of Belgian manufacturing firms in relation to the use of slack resources, indicate that moderate level of slack resources (financial and human) influences positively the probability of firm exporting, while excessive utilisation of these resources relates negatively with the firms’ ability to export.
Nguyen and Chieu (2018) in the study of 2500 Vietnamese SMEs firms in the manufacturing reveal in their analysis that slack resources foster innovation in diverse ways. Whereas the financial slack impairs the attempts of initiating innovation, the presence of human resource slack promotes firms to participate more in innovation activities ensuing in the implementation of new products or processes. Chen and Huang (2010) investigate the influence of technological diversity and organisational slacks on innovation optimisation. The findings reveal that the moderating role of organisational slack is established and absorbed slack positively extenuates while unabsorbed slack negatively extenuates the influence of technological variety on innovation performance.
Also, Argilés-Bosch, Garcia-Blandon, and Martinez-Blasco (2016) study the effect of absorbed and unabsorbed slack on firm profitability. The results that emerge show that unabsorbed slack has a more auspicious effect on potential firm profitability than absorbed slack. While all the absorbed slack measures have a significant negative impact on prospect profitability, the three unabsorbed slack measures exhibit positive, adverse, and inconsequential effects, correspondingly. The fewer restraints of unabsorbed slack on the redistribution to use contemporary prospects point to its relative benefit over absorbed slack. The study further finds divergence effect of absorbed versus unabsorbed slack on profitability in firms with lesser amounts of slack, implying that firms choose to retract resources from existing business and redistribute to foster novel and more beneficial business prospects. Tan (2003) investigates the role of organisational slack among State-owned enterprises in China empirically. By using the Chinese government record, comprising all the Chinese large and medium SOEs. The findings reveal that slack resources, irrespective of the extent to which they have been assigned in the creation process, have impacted positively to firm performance.
Indeed, firms are continuously confronted with stimulating growth and enhancing performance while withstanding the virulent external strain and some internal constraints. Considering this, George (2005) examines the association between slack resources and performance of private firms. While empirical account from public managed firms and behavioural arguments suggest a positive effect of slack resources on the financial performance of the firm, George (2005) finds that a blend of behavioural and resource limitation arguments suffice to explicate the nexus between slack and performance in a privately-owned firm. Contrary to previous results, by utilising a longitudinal dataset of 733 French firms, Paeleman and Vanacker (2013) reveal that possessing both superior amounts of financial and human resource slack is harmful to firm performance although their findings provide evidence for firms that have shoved past the embryonic phase into advanced phases of development. A twin study finds that organisational slack relates positively and significantly with the ability to invest in R&D activities among US publicly traded firms (Mousa & Chowdhury, 2014).
Yang and Chen (2017) in the study of 213 Chinese high-tech manufacturing firms find that absorbed slack resources to relate positively firm's ability to innovate with no relations on the firm scientific alliance. Leyva-de la Hiz, Ferron-Vilchez, and Aragon-Correa (2018) examine the effect of slack resources on environmental and innovation and a firm's financial performance. The study reveals a contrary finding if compared to previous studies. An excessive level of slack resources tends to reduce the ability of the firms to perform environmental innovation and subsequently impairs the financial performance of the firms. Lee and Wu (2016) investigate high-tech firms in Taiwan firms on the relevance of slack resources. The slack resources are delineated into absorbed and unabsorbed slacks. Their findings show that absorbed slack relate negatively to the relationship between R&D investments and performance, which tends to align with the agency theory. Also, the study shows that unabsorbed slack has a somewhat nonlinear effect on the positive connection between R&D investment and firm performance. Daniel et al. (2004) offer evidence of a positive link among three slack forms utilised in their study (i.e., available, recoverable, and potential) and financial performance.
Interestingly, the study further discovers incredible evidence linking this relationship when industry-relative performance is controlled. It indicates that controlling for this firm attribute strengthens the relationship the more with regards to potential slack resources. Also, a lagged measure of slack resources results in a weak relationship. According to Tan and Peng (2010) assessing 1532 Chinese firms regarding the slack-performance link; the findings indicate that organisation theory produces stronger likelihoods while employing unabsorbed slack. On the other hand, agency theory generates a stronger reality while concentrating on absorbed slack. Overall, the study tends to join others relating this performance to be curvilinear (also, Argilés-Bosch, Garcia-Blandón, Ravenda, & Martínez-Blasco, 2018; Tan, 2003), which bear a resemblance to inverse U-shaped curves, and neither U-shaped nor inverted U-shaped for (Argilés-Bosch et al., 2018).
Several efforts have been made by scholars to examine the relationship between slack and performance empirically. Results that emerge show that slack-performance link is observed to be linear or curvilinear. Slack resources are frequently recognised as an endogenous incentive for firms’ innovation. It is vital to evaluate the substance of slack in reinforcing innovation, especially in diverse institutional frameworks. Owing to the relationship between slack resources and performance is inconclusive, new insights emerge in the literature frequently with different findings; however, with the arguments documented above, we further hypothesise that:H3 Firm-level slack time should relate to the ability of the firms to implement product innovation.
Demirkan (2018) suggests that the resources that a firm possesses and has maximum hegemony (firm-level resources) and resources that a firm retrieves via a direct link with other firms (network-level resources) will influence firm innovation if efficiently utilised by the firm.
Anderson and Eshima (2013) examine the relationship between entrepreneurial orientation and how it moderates the relationship between firm age and intangible resources to impact performance. Interestingly, the study reveals that entrepreneurial orientation-performance link is higher with younger firms than with older firms. Also, the performance association is stronger for firms with an intangible resource benefit than among firms that are more resource constricted. Firms with an entrepreneurial strategic stance that are younger and that own an intangible resource advantage demonstrated the sturdiest stage of growth.
In a related study with contrast findings, Balasubramanian and Lee (2008) study how firm age connects to innovation superiority, and how this link differs contingent on the makeup of firms’ technological availability. By utilising data on patents of COMPUSTAT firms, the study shows a negative relationship between firm age and technical superiority, and this impact tends to be greater in technologically functioning spheres. The economic inference of this result is reported to be substantial in that each extra year decreases the influence of a 10 per cent increase in R&D intensity on the firm's market worth by over 3 per cent. Also, Evans (2006) employs a sample of all firms functional in 100 manufacturing industries to investigate some facets of firm dynamics. The findings emerge that firm growth, the unpredictability of firm growth, and the likelihood that a firm will fail decline with firm age.
Rafiq, Salim, and Smyth (2016) assess the influence of R&D on the profitability and sales of mining firms in China and the United States (US) and the moderating consequence of firm age utilising Coarsened Exact Matching (CEM). For the collective panel of 168 major US and Chinese mining firms, the study shows that, on average, a firm that conducts R&D activities makes 4–11% greater sales and produces 4–13% additional profits than firms that do not undertake R&D activities. In the mining industry, the age of the firm tends to moderate the link between R&D activities and financial performance. A relatively experienced R&D involved firm makes 4.4% added profit and produces 7.2% additional sales than a much younger non-innovative firm. Interestingly, the transforming peak at which R&D activities change from being negative to positive, the profit and sales impact is observed between 37 years and 22 years, respectively.
Since firms are an entity that cannot be reorganised as need emerge, there is no a priori motive why they should age. As they develop, firms should be adept at learning. They can learn by doing or spending in R&D; they can employ the workforce and school them to meet the goal of the establishment. Firms can acquire knowledge from other firms, either in the same or other industries. Literature in the industrial organisation provide that life expectancy rises with age (Dunne et al., 1989), and superior firms subsist (Baker, 2002). Hopenhayn (2006) indicates that, under conceivable assumptions, old firms relish greater profits and value. Based on these theories, this current study contends that the ability of the firms to exploit slack time for performance optimisation could also well be linked to the age of the firm. Therefore, this study suggests that the interactive role of employees’ slack time should exhibit a propitious return to the ability of the firms to innovate. Owing to the prior reviews, the fourth working hypothesis relates thus:H4 Firm age as an attribute of firms should positively moderate slack time as a firm-level practice; an aspect of human resource input to support the introduction of product innovation.
Based on the contingency theory, firm size could be regarded as one of the contingency organisational elements (Child, 1975). In the literature, firm size has been recognised as one of the primary moderating variables that could accelerate or inhibit firm activities, either in decision making, group information-processing or firm innovation (Damanpour, 2010; Zona, Zattoni, & Minichilli, 2013). In this study, we assess the moderating role of firm age and size with slack time (free time allotted to employees in the workplace to generate innovative ideas) in supporting the introduction of product innovation at the firm-level. Firms in developing countries, including those in sub-Saharan Africa incline to replicate product blueprint and development to surmount the limitations of resources and competencies and to lower the cost of product development. Large firms are more efficient in achieving copious innovative resources as compared to SMEs (Yu, Yan, & Assimakopoulos, 2015).
Similarly, the creation, commercialisation and both intramural and extramural R&D activities can merely be fostered in the large firms as a competitive advantage (Legge, 2000). A current study from the European commission distinctly underlines the divergence between SMEs and large firms. The report reveals that in Europe, large firms are more probable to perform to enhance resource efficiency (Spence & Essoussi, 2010). Furthermore, firm size impacts the link between the management mode and the development of firms (Chung, Wright, & Kedia, 2003). Carr and Pearson (1999) suggest that firm size should be identified as a moderating variable when studying the relative roles of the firms regarding resources utilisation and its efficiency.
Furthermore, Farooq and Vij (2017) examine how firm size moderates the link between IT orientation and business performance. The results show the firm size as a useful candidate in moderating the link between IT orientation and business performance. Hence, information technology orientation is considered a significant resource for a firm. It allows firms to manage and use information efficiently. Li and Chen (2018) find the moderating role of firm size waning the positive influence of board gender diversity on firm performance in China. Assessing the financial performance of firms relative to size in Nigeria firms, Sa’idu (2016) finds that relationship between the board, that is, board independence and board size, and financial performance are positively moderated by firm size. Abbasi and Malik (2015) show the same result in the case of firms in Pakistan. Also, Mutende, Mwangi, Njihia, and Ochieng (2017) employ secondary panel data of firms listed in the Nairobi Securities Exchange (NSE) to examine how firm attributes; age and size could moderate the link between cashflows and the performance of the firms. Evidence shows that firm size has a negative moderating effect on the likelihood of free cash flows and financial performance.
Wang, Zhang, and Goh (2018) investigate the moderating role of firm size in sustainable performance improvement using 172 Chinese firms. The findings show that sustainable supply chain management practices and firm size relate positively to the firm's environmental and social performance. Firm size extenuates the influence of sustainable supply chain practices on economic performance. Roni et al. (2017) investigate the moderating role of firm size on the likelihood of a sustainable manufacturing drive and firm performance of the Malaysian firms. The empirical evidence suggests that firm size positively moderates the relationship between market forces and strategic leadership, leading to firm performance.
On the contrary, firm size does not moderate a performance-relationship between policy, regulations and resource availability. The result further reveals that larger firms are likely to experience a higher rate of performance due to the size factor as compared to smaller firms. Further, the resource viewpoint underscores the relevance of the moderation of firm size as a positive reinforcer between firm-level turnover and organisational performance. In the study of 2825 Belgian firms, De Meulenaere et al. (2018) evidentially document in a three-way interaction of organisational turnover, firm size, and the firm industry-based knowledge-intensity and find that; firm size cushions the adverse turnover effect in low knowledge-intensive industries and strengthens the destructive influence in high knowledge-intensive sectors, respectively.
Demirkan (2018) assessed the position of financial resources and slack resources in the kind of cash and human slack at the firm-level, and network size, network bond effectiveness, and network variety at the network level on the firm innovation. By employing a generalised negative binomial model with Huber-White method on 306 firms from the biotechnology industry over 17 years. While human slack affects innovation negatively, its interaction with network size boosts the implementation of innovation. Also, the assessment indicates that cash slack influence innovation negatively. The link is further moderated by firm size. With large firms, cash slack influences innovation positively. Network-level resources wholly positively affect innovation with an added economic effect on firm innovation than firm-level resources.
In sum, existing empirical evidence and based on the proceeding reviews tend to align with the fact that firm size could be a good candidate to moderate the relationship between firm resources and performance. Although in some cases, the pieces of evidence remain ambiguous and have yielded conflicting findings. Nonetheless, considering these diverse standpoints, the fifth and sixth hypotheses are proposed as follows:H5 Firm size as an attribute of firms should positively moderate slack time as a firm-level practice; an aspect of human resource input to support the introduction of product innovation. A three-way relationship between slack time, age and size should have a more substantial positive effect on firm-level innovation.
We use the World Bank Enterprise Survey (WBES) and Innovation Follow-up Survey (IFS) to test our hypotheses. Since both datasets consist of the same firms, we merge first, then for each country using firms’ specific identifier and later append the outcome of the merger for eleven SSA countries considered in our analysis. The two datasets are firm-level and cover the following periods for each country: DR Congo (2013), Ghana (2013), Kenya (2013), Malawi (2014), Namibia (2014), Nigeria (2014), South Sudan (2014), Sudan (2014), Tanzania (2013), Uganda (2013), and Zambia (2013).2 The content of WBES data ranges from institutions-related variables like political stability, corruption to business characteristics and performance indicators.
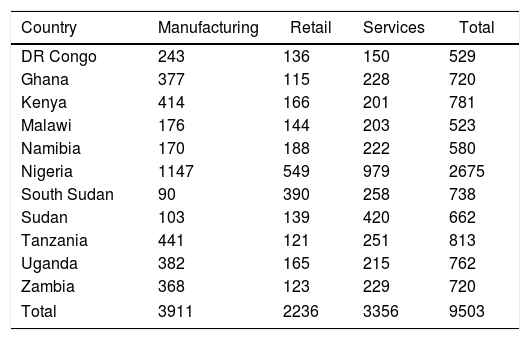
The World Bank since 1990 has been consistent in collecting firm-level survey data to allow for country-specific analysis. As the world becomes interconnected and interdependent, the World Bank in 2005 started conducting a firm-level survey to allow for comparative analysis across countries. On the other hand, the World Bank realises the role of firms in jointly stimulating the economy, hence the collection of innovation dataset. IFS was pioneered in 2011 to garner data on innovation and innovation-related activities specific to firms’ internal operations. The economy comprises manufacturing, retail, and services. The firm-level WBES was a representative sample of firms in the formal non-agricultural sector. The WBES is stratified based on the sector of activity, firm size and geographical locations of the sampled firms, respectively. Business owners and top managers were both the WBES and IFS respondents. Fig. 2 shows maps of surveyed countries with large areas covered on the continent. We show the number of firms in each country, constituting manufacturing, retail, and services in Table 1 (www.enterprisesurvey.org).

Sample by country and sector.
| Country | Manufacturing | Retail | Services | Total |
|---|---|---|---|---|
| DR Congo | 243 | 136 | 150 | 529 |
| Ghana | 377 | 115 | 228 | 720 |
| Kenya | 414 | 166 | 201 | 781 |
| Malawi | 176 | 144 | 203 | 523 |
| Namibia | 170 | 188 | 222 | 580 |
| Nigeria | 1147 | 549 | 979 | 2675 |
| South Sudan | 90 | 390 | 258 | 738 |
| Sudan | 103 | 139 | 420 | 662 |
| Tanzania | 441 | 121 | 251 | 813 |
| Uganda | 382 | 165 | 215 | 762 |
| Zambia | 368 | 123 | 229 | 720 |
| Total | 3911 | 2236 | 3356 | 9503 |
This paper investigates the moderating role of firm age and size on the relationship between slack time and product innovation. The survey asks participating firms if firms introduced new or significantly improved goods and services in previous years for product innovation. The variable is measured as a dummy, which takes ‘1’ if the firm has introduced or significantly improved on it and ‘0’ otherwise. However, the innovation considered in this study complies with the Community Innovation Survey (CIS) and the Oslo Manual, where firms document if in the last three years they introduce any new or significantly improved forms of innovation. A second dependent variable is measured as the percentage of the main innovative products and services. The variable is used to perform the robustness checks in the analysis. The same variable is used to determine the moderating role of age and size in the relationship between slack time and product innovation for large firms and Small and Medium Enterprises (SMEs).
The measure of innovation has been employed by scholars in some studies (Ayyagari, Demirgüç-Kunt, & Maksimovic, 2011; Barasa, Knoben, Vermeulen, Kimuyu, & Kinyanjui, 2017; Chadee & Roxas, 2013; van Uden et al., 2017). Product innovation gives firms a competitive advantage and offers them a better position in the market by launching a better quality and product with cost reduction. This creates an impact which makes the firms to fill the gaps in demand (Galindo & Méndez, 2014) and to increase their market share (Leskovar-Spacapan & Bastic, 2007).
Independent and moderating variablesSlack resource (time)This variable is combined with firm age and size to predict the impact on the implementation of product innovation. The variable slack time is core to this study. WBES ask respondents if during the past years, establishments give employees slack time to develop novel ideas. This variable is necessary because of the role novel idea generation plays in the implementation of innovation, thereby stimulating the performance of firms. A few studies have found slack time to relate positively to innovation (see, for instance, Agrawal et al., 2015; van Uden et al., 2017). Burkus and Oster (2012) refer to it as non-commissioned work time. Several studies have also documented the relevance of diverse slack resources to firm-level performance, including innovation. These studies have been reviewed extensively in the literature section. The measure, slack time, takes ‘1’ if employees received time to develop innovative ideas and ‘0’ otherwise. In addition to the core independent variable, the study includes some important variables that are essential to employees’ creativity and may support the offering of slack time for novel ideas generation in the workplace.
Firm size (moderator)Firm size is one of the moderating variables with the slack resource (time). We use full-time permanent employees representing workers employed in the last three years by the firms. It is a measure of the natural logarithm of full-time permanent employees. Several studies have used this measure, e.g., Bogliacino (2014); Mohammadi, Broström, and Franzoni (2017); Barasa et al. (2017). We use this measure as we argue that most innovative firms’ present and past employment figures provide researchers with the possibility of measuring firms’ performance regarding innovations. As noted in the previous studies that there exists a positive correlation between firm size and innovation (Ayyagari et al., 2011; Jiménez-Jiménez & Sanz-Valle, 2011). Some scholars have argued that larger firms are observed to be more innovative because of their broad use of resources and capabilities as compared to smaller firms (Ayyagari et al., 2011; Henderson & Cockburn, 1994). Also, the authors conclude that larger firms can provide economies of scale in innovation.
Firm age (moderator)Firm age is one of the moderating variables with the firm-level slack resource (time). Several scholars have argued the role of age to firm performance (Coad, Segarra, & Teruel, 2013; De Jong & Vermeulen, 2006; Huergo & Jaumandreu, 2004; Huynh & Petrunia, 2010; Yildiz, Bozkurt, Kalkan, & Ayci, 2013). It is either to generate innovation (Anderson & Eshima, 2013) or to enhance performance in general. However, there have been mixed empirical accounts of the contribution of a firm's age to innovation performance. Regarding this study, the age of firms could determine the ability to allocate time for employees to be creative in the workplace. This study employs firm age as a moderator variable because prior studies confirm and support the finding that firm age is positively associated to innovation performance (Ayyagari et al., 2011; Barasa et al., 2017). There is a likelihood that younger firms may introduce more product innovation as compared to the incumbent(older) firms (Barasa et al., 2017). This confirms the argument of Rhee, Park, and Lee (2010) that older firms are not making great innovation because of their strategic conservative nature. We measure the variable by subtracting the year firms began operation from the year-waves of the survey after which we express the outcome in natural logarithm.
Internal R&DThis implies research and development conducted by the firm within the environment of the firm's operation. The Innovation Follow-up Survey provided a question to the respondents if their firm has conducted internal R&D for the past three years. Internal R&D means a creative work initiated to intensify knowledge for fostering innovative product and process. Several studies have shown the relevance of internal R&D in supporting firm to undertake innovation activity. Ayari (2013) contends that when a firm increases its intensity in terms of developing internal R&D activity, the higher the likelihood of such firm introducing product innovation. Mansury and Love (2008)) argue that internal R&D is the most crucial indicator of innovation. This could improve their technological capabilities to foster performance and enhance the degree innovativeness. Kaufmann and Tödtling (2001) contend that internal R&D or capabilities are very crucial factors than external relations, especially in improving firms’ability to generate far-reaching innovation. In a study particularly on the US business services, Mansury and Love (2008) observe internal R&D to be a significant measure of firms’ likelihood to innovate as it relates positively to innovation intensity of the firms. This variable is operationalised as a dummy that takes “1” if a firm conducts internal R&D in the last three years and “0” otherwise.
External R&DThis depicts research and development conducted by the firm via external means (sources). These external sources may be universities or other research institutions. External R&D is a creative work that is utilised by another enterprise, public as well as private research institutions, which is paid for by the organisation (World Bank, 2014). The Innovation Follow-up Survey provided a question to the respondents if their firms have conducted external R&D for the past three years. External R&D is operationalised as a dummy that takes “1” if a firm conducts external R&D in the last three years and “0” otherwise. Innovation network theorists argue that firms hardly innovate individually and that the introduction of new products and processes into the market may depend on the firm's capability to build a strong connection with the external agents (Baptista & Swann, 1998; Cooke & Morgan, 1994; Cooke & Morgan, 2013; Thompson, 2017). Knowledge from external sources and R&D could play a role in innovation development. The relationship between extramural R&D and innovation performance has been confirmed by scholars to relate positively (Belussi, Sammarra, & Sedita, 2010; Faems, Van Looy, & Debackere, 2005; Faems, Janssens, & Van Looy, 2010; Ritala, Olander, Michailova, & Husted, 2015).
Formal trainingThe Innovation Follow-up Survey (IFS) document presents an item that asks top managers and business owners if the firm has provided employees with formal training for the development of products and services. The variable training is determined by a formal training programme for permanent and full-time employees in the last fiscal year 2013. Few studies have identified that firm-sponsored training might lead to higher innovation. Meaning that a workplace that offers training tend to innovate more Bauernschuster, Falck, and Heblich (2010) provide nuance results of the positive effect of firm-sponsored training on innovation. The authors observe that training has a significant and positive effect on innovation in the German industry between 1997 and 2001. Also, the authors conclude by indicating that a 10% increase in training may lead to a 10% higher chance to innovate. A study applied to 10,000 Spanish manufacturing industry covering 2001 and 2006 period, González, Miles-Touya, and Pazó (2016) find that workforce training has a significant impact on firm innovation performance. The study concerning the association between training and firm's performance has been identified in quite several studies in the last decades. These studies have shown that training enhances organisational performance by providing workers with the needed knowledge and skills (Aguinis & Kraiger, 2009; Ballesteros-Rodríguez, de Saá-Pérez, & Domínguez-Falcón, 2012; Ford, 2014; Tharenou, Saks, & Moore, 2007; Tharenou, 2001). The main reason behind the underlying premise is that training plays a supportive role in improving two of the primary sources of competitive advantage for the firm: by human capital and organisational knowledge (Aragón-Sánchez, Barba-Aragáon, & Sanz-Valle, 2003; Lopez-Cabrales, Valle, & Herrero, 2006; Subramaniam & Youndt, 2005).
Staff educationThe Enterprise Survey (ES) ask top managers “what is the percentage of full-time employees who have completed high school education employed in the establishment?”. Some studies have confirmed that human capital or employee's education attainment supports the firm's propensity to innovate. A cross-sectional data initiated by Selvarajan et al. (2007) demonstrate that human capital improvement opens opportunities for greater innovativeness, and it also creates a positive consequence on the performance of the firms. Following this argument, Hsu, Lin, Lawler, and Wu (2007) confirm that firm performance and human capital could mean high-performance work system. Human capital implies processes that include “training, education, and other professional initiatives in order to increase the levels of knowledge, skills, abilities, values and social assets of an employee which may lead to employee's satisfaction and performance and eventually on s firm performance” (Marimuthu, Arokiasamy, & Ismail, 2009, p. 266). Romer (1990) sees human capital to represent the accumulation of effort invested in schooling and training.
Managerial experienceIn this study, the managerial experience represents the number of years of experience the top managers have worked in the industry. A stream of studies has explored the role of experienced managers on innovation performance of the firm (Barker & Mueller, 2002; Bertrand & Schoar, 2003; Eggers & Kaplan, 2008; Galasso & Simcoe, 2011; Mackey, 2008). Experienced managers are very likely to provide useful insights that can spur future opportunities, niche markets, products, technologies and market development (Adner & Helfat, 2003; Balsmeier & Czarnitzki, 2014; Helfat, 2002; Shane, 2000) Managerial experience is positively associated with innovation performance (Balsmeier & Czarnitzki, 2014). The authors show that managerial experience improves the likelihood to innovate and innovative firm performance. Implying that managerial experience can as well have an indirect effect on a firm's performance.
A good example is that they help to reduce the uncertainty that associate to future returns on innovation. Also, the authors add that a well-experienced manager is quite essential for small businesses operating outside the European countries. The idea underlying this assumption is that managerial experience is an essential factor in explaining the firm's innovation performance as well as assisting the firm's to identify new businesses. The empirical studies conducted on the relationship between managerial experience and firm innovation performance is positive (Agarwal, Echambadi, Franco, & Sarkar, 2004; Filatotchev, Liu, Buck, & Wright, 2009; Klepper, 2002; Pennings, Lee, & Van Witteloostuijn, 1998).
Control variablesExportFirms that export are more efficient than non-exporting firms (Cleride et al., 1998). A few scholars have also documented the relevance of exporting capabilities to the performance of the firms (Ganotakis & Love, 2011, 2012; Filatotchev et al., 2009). The WBES reports the percentage of sales accounting for direct exports. This measurement is retained in this analysis as documented in the WBES.
OwnershipThe study controls for both private and foreign ownership because it could impact the ability of the firms to allocate slack time to generate innovative ideas. Ownership heterogeneity has been considered essential components of firm-level innovativeness (Chen, Li, Shapiro, & Zhang, 2014; Choi, Park, & Hong, 2012; Song, Wei, & Wang, 2015). Dachs and Peters (2014) provide evidence of the role of both foreign and domestic ownership on the likelihood of innovative-active firm contributing to employment growth. Also, foreign ownership has been evidenced to impact firm-level employment growth (Lipsey, Sjöholm, & Sun, 2013). These variables are measured as a percentage owned by private domestic firms and foreign domestic firms, respectively. The measurements are retained as reported in the WBES.
Capacity utilisationCapacity utilisation has been considered an essential element in the success of the firms and their production efficiency (Levy, 2007; Mazumdar & Mazaheri, 2005; Mukwate Ngui-Muchai & Muchai Muniu, 2012). It is also documented that manufacturing firms in SSA on average use 50% of their capacity (Mazumdar & Mazaheri, 2005). Expanding their capacity and increasing their capacity utilisation is considered essential to production (Fevolden, 2015). Capacity relies upon the resources, such as buildings, machinery and labour firms have available. Capacity utilisation is the degree to which that capacity is being utilised. When the firm is making full utilisation of all its resources, it means the firm is operating at maximum capacity or 100% capacity utilisation. It is an essential piece of information in the process of lowering waste in the production process and stimulating innovativeness (Fevolden & Grønning, 2010).
Country, industry and sector dummiesThe estimations allow for country dummies. In the ES, there are three sector classifications: manufacturing, retail, and services firms. Sector specificity also plays an essential role in innovation performance, being mindful of endogeneity and sector-specific differences in innovation output (Brouwer & Kleinknecht, 1996). Considering the importance of the three sectors, and as argued by O'Sullivan (2006) that sectoral differences in the innovative activity do have prominent implications for the allocation of resources. We generate three-sector dummies: manufacturing, services, and retail, respectively, where retail serves as the base category in the estimations. On the other hand, we give room for the industry effect by entering industry dummies in all the estimations to rule out the likely impact of unobserved industry heterogeneities.
Empirical analysisEconometrics modelTo test our hypotheses, we use the IV binary treatment model because of the binary nature of our instrument and endogenous variables. It is useful as an estimate for binary treatment models with a heterogeneous response to treatment both for observable and unobservable selection. The use of a binary treatment model in this paper depends on the work of Cerulli (2012). The binary treatment model with heterogeneous treatment to response aids to address the likely endogeneity issues that may evolve. The study employs the probit-2sls approach as one of the ingrained models in the instrumental variable treatment model. This approach is considered to be the most efficient amongst the three embedded approaches in addressing the relationship in which this study tries to predict. The reason of being the most efficient stems from the fact that it produces the smallest projection errors, and it addresses the issue of the binary estimators in the analysis, which include the chosen instruments (patent, and the extent to which political instability and corruption are of significant constraints to firms’ operations), the dependent and independent variables (Cerulli, 2012). Eqs. (1)–(3) are the econometric set-ups while the functional forms (4) and (5) represent the estimation equations, respectively.
where e1≠e0 (both observable and unobservable heterogeneity).

We utilise the following general functional framework to examine the working hypotheses:
where ProdInno is the dependent variable either product innovation (dummy) or % of the main innovative product or services, ST is a measure of employees’ Slack Time, Z is a measure of the moderating variables (age and size) with ST, and X represents the vector of control variables. One daunting task in obtaining an unbiased estimate of β and α is that firms may diverge in attributes that affect both the general level of ST and product diversity concurrently. If these confounding elements are not controlled for, they could lead to a spurious correlation between ST and ProdInno. The macroeconomic environment might drive the demand for ST and Prodinno in diverse time points. Hence, we incorporate a year dummy variable in the regression. The general framework in Eq. (3) produces the following estimation model:
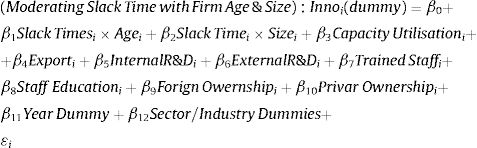
In the specification above, subscripts denote that these measures are across firms (i). The estimation approach addresses two probable drawbacks in our dataset. First, competitive impacts or other shocks in one year could have constant consequences, pointing to the likelihood of firm-specific autocorrelation over time. Second, with wide-ranging data, there is continuously the probability of provisional heteroskedasticity. While the Wooldridge test for autocorrelation (Wooldridge, 2003, 2011) is employed for the instrumental variable estimation. The result dispels the presence of multicollinearity in the estimations (Drukker, 2018; O’brien, 2007). The Breusch-Pagan test (uncentered VIF) estimations are below 10; a result that remains within the benchmark of both VIF and uncentered VIF.
Although other estimation methods are employed, the main estimates are performed using a binary instrumental variable treatment model (ivtreatreg) with a Probit-2sls option. We include controls for time so that the findings are robust to measurement errors that could be created by macroeconomic effects common to all firms in sub-Saharan Africa. There are two additional possible endogeneity problems that the estimation considers. First, firms may have persistently different levels of ST and diversity that is not appropriately managed. The inclusion of firm-specific controls has helped address the situation. Second, it is possible that firm-specific shocks, like an unpredictably high demand, which may permit a firm to instantaneously build outlays in ST and expand product lines, ensuing in more category.
On the other hand, a firm that forestalls a demand for superior variety, as a result of disparate matter, could create more substantial investments in ST in expectation of this effect. Either of these issues could lead to a correlation between ST level and the error term, leading to biased estimates. By tackling this kind of endogeneity, the ST level is treated as endogenous, and an instrumental variables estimation applied. The instrument group is selected about a previous study (Brynjolfsson & Hitt, 2003). It captures a firm's distinctive capability to react to surges in the crave for ST. Since the ideal estimator does not comprise an instrumental variables deviation, the estimation employs a probit-2sls approach that is embedded within the binary instrumental variable model. The IV estimation uses three instruments that conform with the assumption of having valid instruments. These instruments are patents, political instability and corruption.
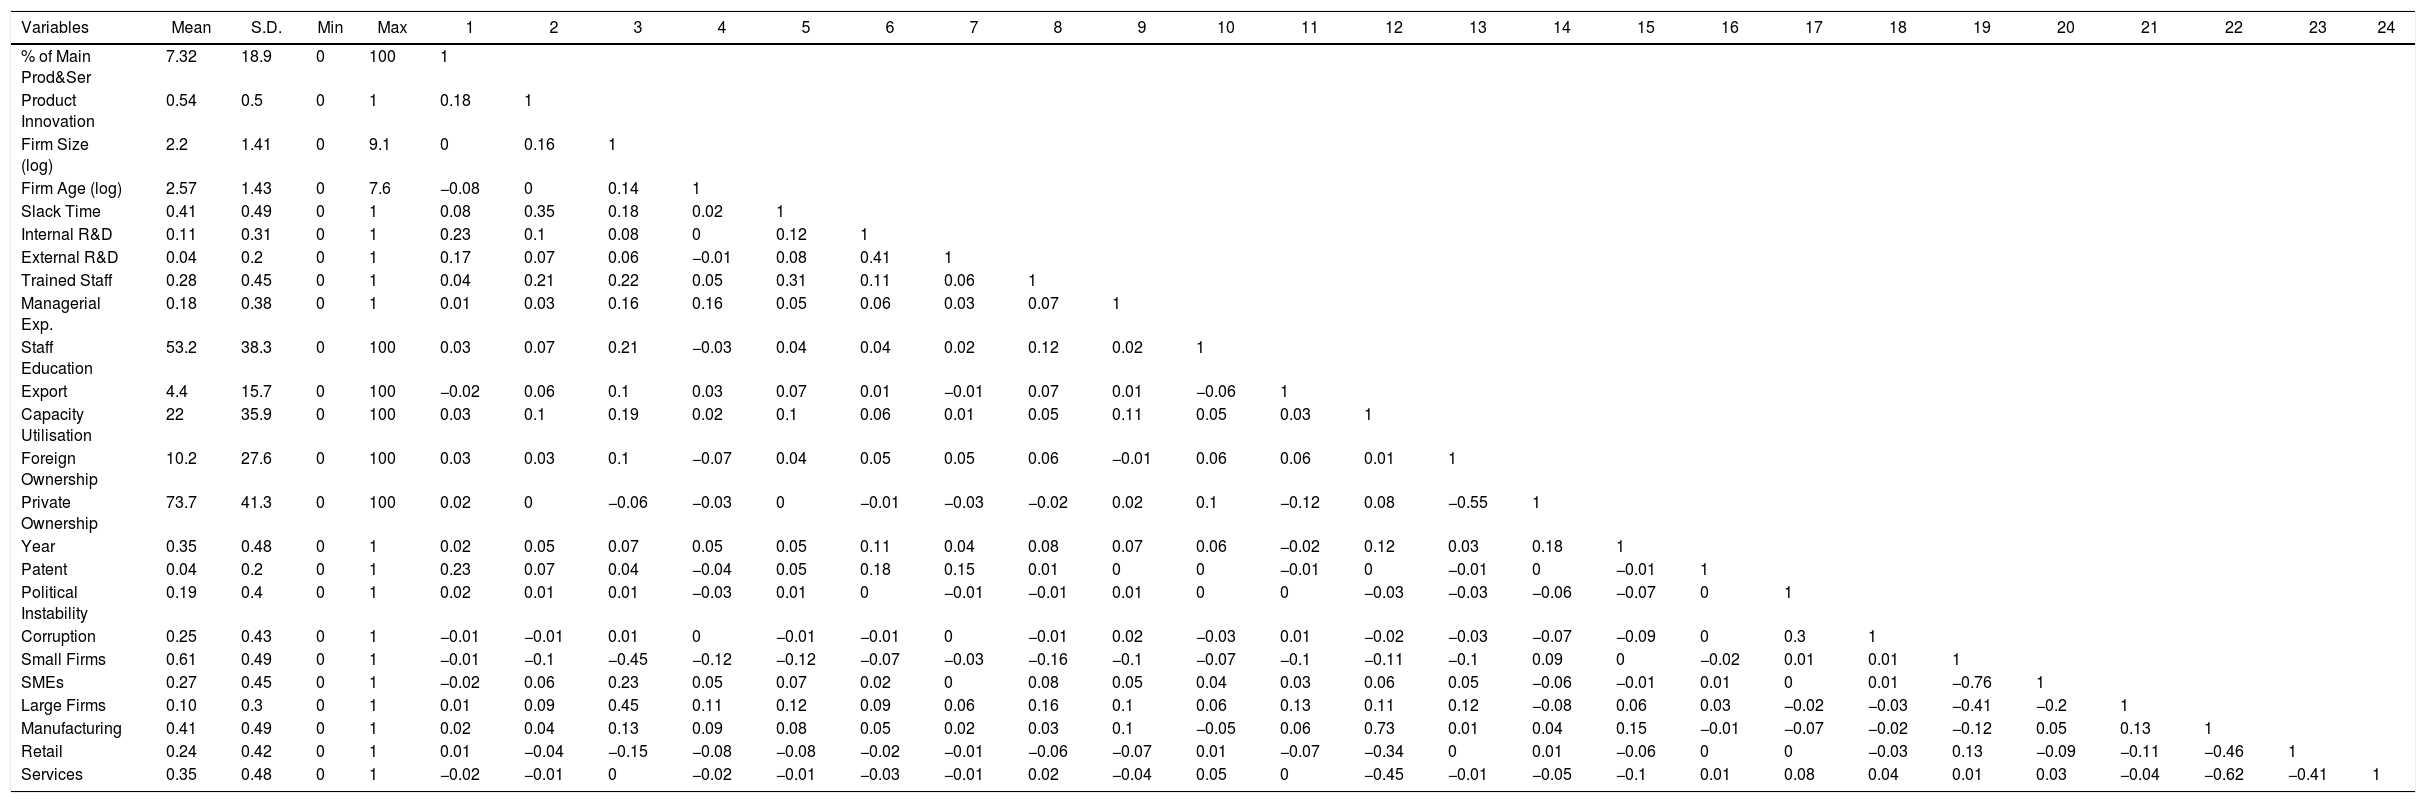
ResultsThis section begins with the report of the descriptive statistics and correlation matrix of the estimation variables that are reported in Table A2. With the sectoral, on average distribution, 41% of the firms belong to manufacturing, 24% retail, and 35% services. 61% are small firms, 27 medium-size firms, and 10% large firm. On average, 7.3% is related to the firms’ main innovative products and services. 54% of firms implement product innovation. Relatively, firms in sub-Saharan Africa engage in the implementation of innovation. While 18% represents the top managers with managerial experience, 28% of the staff are trained, and 53.2% of the workforce possesses a high school certificate; a measure the analysis uses as a human capital variable. On average, 42% of firms in the sample allot employees slack time to generate innovative ideas in the workplace with 75% of the firms reporting for product innovation. It, however, reveals that innovative firms in sub-Saharan Africa attach a higher premium to new idea generation to enhance innovation performance even though the practical applicability has not been reported as compared to the multinationals like Google, Twitter, and others. Relatively 11% of the firms conduct internal R&D and only 4% for external R&D. On average, 22% represent the capacity utilisation of the establishments. Percentage of sale from direct export stands at 4.4%. The shares of private domestic ownership and foreign domestic ownership are 73.3% and 9.8%, respectively. The following variables: patent, corruption and political instability serve as the instruments for the estimation in Table 2 where we employ an instrumental variable treatment model with a heterogeneous treatment to response (i.e. probit-2sls option). The instruments uphold the underlying assumptions underlying the use of valid and reliable instruments in the instrumental variable framework. 5% of the firms report having applied for a patent. 19% of the establishments report that political instability constitutes a major obstacle to their operation, and 25% consider corruption as a major obstacle.
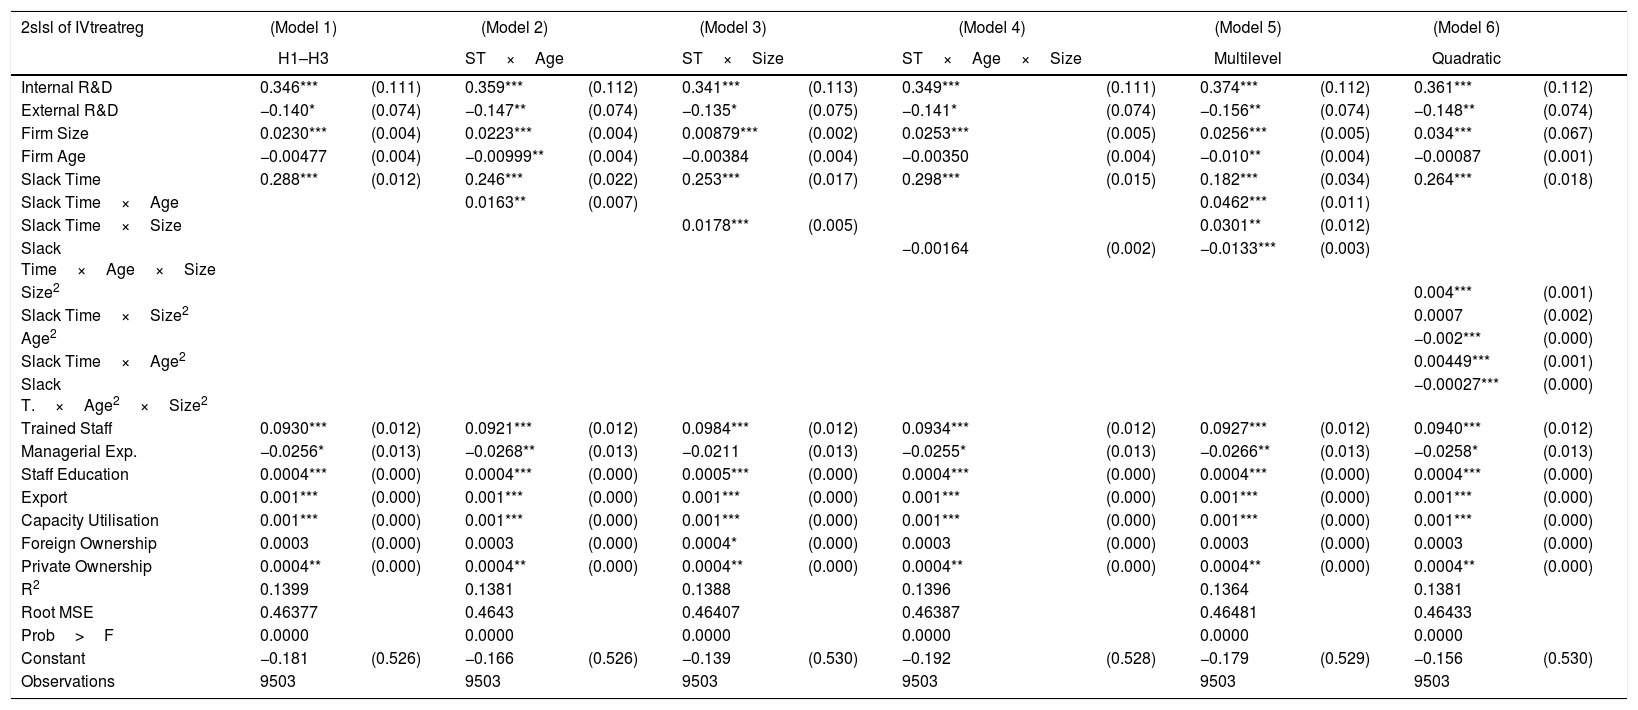
The moderating role of firm age and size on the relationship between product innovation and slack time (Main Estimation).
| 2slsl of IVtreatreg | (Model 1) | (Model 2) | (Model 3) | (Model 4) | (Model 5) | (Model 6) | ||||||
|---|---|---|---|---|---|---|---|---|---|---|---|---|
| H1–H3 | ST×Age | ST×Size | ST×Age×Size | Multilevel | Quadratic | |||||||
| Internal R&D | 0.346*** | (0.111) | 0.359*** | (0.112) | 0.341*** | (0.113) | 0.349*** | (0.111) | 0.374*** | (0.112) | 0.361*** | (0.112) |
| External R&D | −0.140* | (0.074) | −0.147** | (0.074) | −0.135* | (0.075) | −0.141* | (0.074) | −0.156** | (0.074) | −0.148** | (0.074) |
| Firm Size | 0.0230*** | (0.004) | 0.0223*** | (0.004) | 0.00879*** | (0.002) | 0.0253*** | (0.005) | 0.0256*** | (0.005) | 0.034*** | (0.067) |
| Firm Age | −0.00477 | (0.004) | −0.00999** | (0.004) | −0.00384 | (0.004) | −0.00350 | (0.004) | −0.010** | (0.004) | −0.00087 | (0.001) |
| Slack Time | 0.288*** | (0.012) | 0.246*** | (0.022) | 0.253*** | (0.017) | 0.298*** | (0.015) | 0.182*** | (0.034) | 0.264*** | (0.018) |
| Slack Time×Age | 0.0163** | (0.007) | 0.0462*** | (0.011) | ||||||||
| Slack Time×Size | 0.0178*** | (0.005) | 0.0301** | (0.012) | ||||||||
| Slack Time×Age×Size | −0.00164 | (0.002) | −0.0133*** | (0.003) | ||||||||
| Size2 | 0.004*** | (0.001) | ||||||||||
| Slack Time×Size2 | 0.0007 | (0.002) | ||||||||||
| Age2 | −0.002*** | (0.000) | ||||||||||
| Slack Time×Age2 | 0.00449*** | (0.001) | ||||||||||
| Slack T.×Age2×Size2 | −0.00027*** | (0.000) | ||||||||||
| Trained Staff | 0.0930*** | (0.012) | 0.0921*** | (0.012) | 0.0984*** | (0.012) | 0.0934*** | (0.012) | 0.0927*** | (0.012) | 0.0940*** | (0.012) |
| Managerial Exp. | −0.0256* | (0.013) | −0.0268** | (0.013) | −0.0211 | (0.013) | −0.0255* | (0.013) | −0.0266** | (0.013) | −0.0258* | (0.013) |
| Staff Education | 0.0004*** | (0.000) | 0.0004*** | (0.000) | 0.0005*** | (0.000) | 0.0004*** | (0.000) | 0.0004*** | (0.000) | 0.0004*** | (0.000) |
| Export | 0.001*** | (0.000) | 0.001*** | (0.000) | 0.001*** | (0.000) | 0.001*** | (0.000) | 0.001*** | (0.000) | 0.001*** | (0.000) |
| Capacity Utilisation | 0.001*** | (0.000) | 0.001*** | (0.000) | 0.001*** | (0.000) | 0.001*** | (0.000) | 0.001*** | (0.000) | 0.001*** | (0.000) |
| Foreign Ownership | 0.0003 | (0.000) | 0.0003 | (0.000) | 0.0004* | (0.000) | 0.0003 | (0.000) | 0.0003 | (0.000) | 0.0003 | (0.000) |
| Private Ownership | 0.0004** | (0.000) | 0.0004** | (0.000) | 0.0004** | (0.000) | 0.0004** | (0.000) | 0.0004** | (0.000) | 0.0004** | (0.000) |
| R2 | 0.1399 | 0.1381 | 0.1388 | 0.1396 | 0.1364 | 0.1381 | ||||||
| Root MSE | 0.46377 | 0.4643 | 0.46407 | 0.46387 | 0.46481 | 0.46433 | ||||||
| Prob>F | 0.0000 | 0.0000 | 0.0000 | 0.0000 | 0.0000 | 0.0000 | ||||||
| Constant | −0.181 | (0.526) | −0.166 | (0.526) | −0.139 | (0.530) | −0.192 | (0.528) | −0.179 | (0.529) | −0.156 | (0.530) |
| Observations | 9503 | 9503 | 9503 | 9503 | 9503 | 9503 |
Note: The estimation controls for country, industry and year dummies. Standard errors in parentheses.
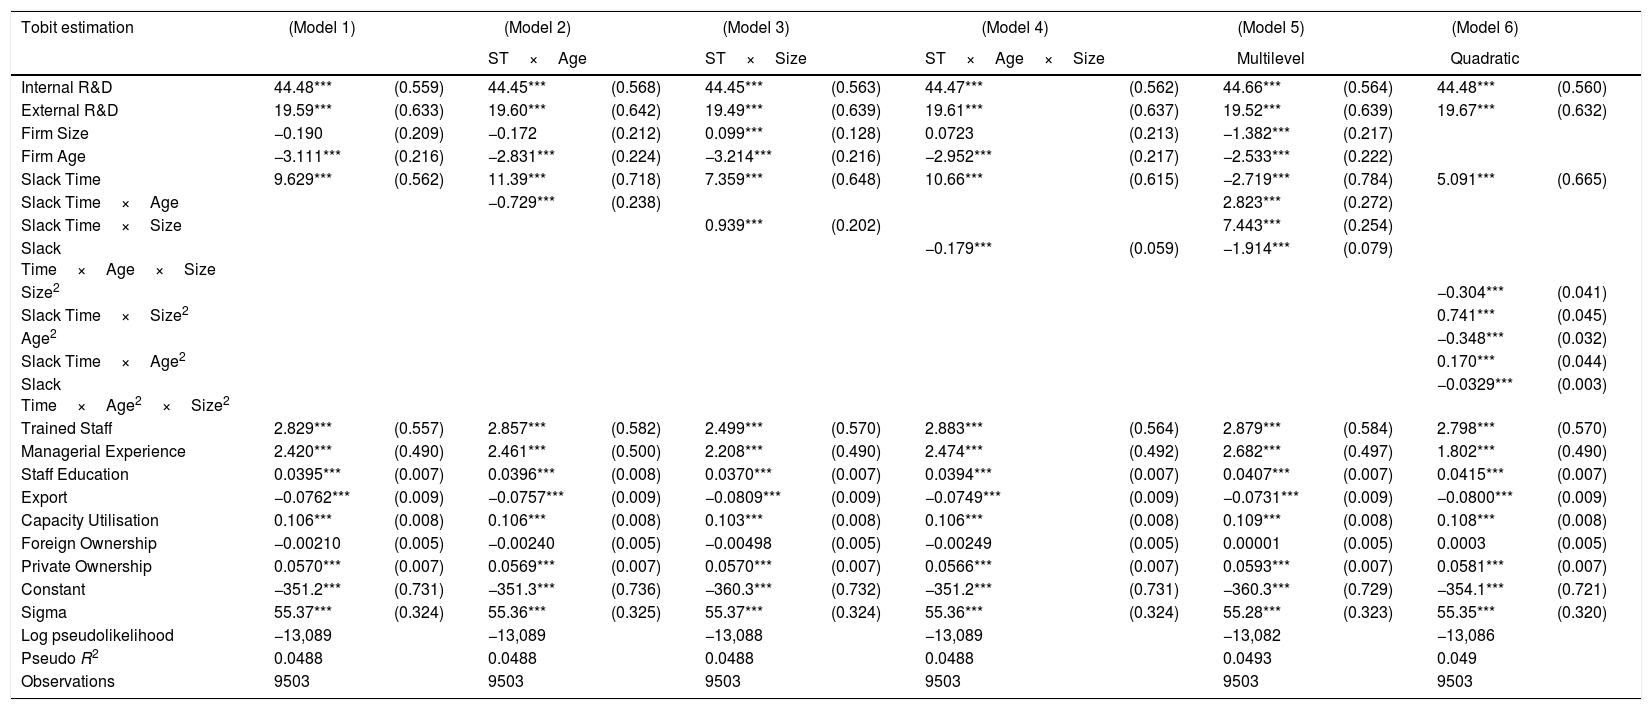
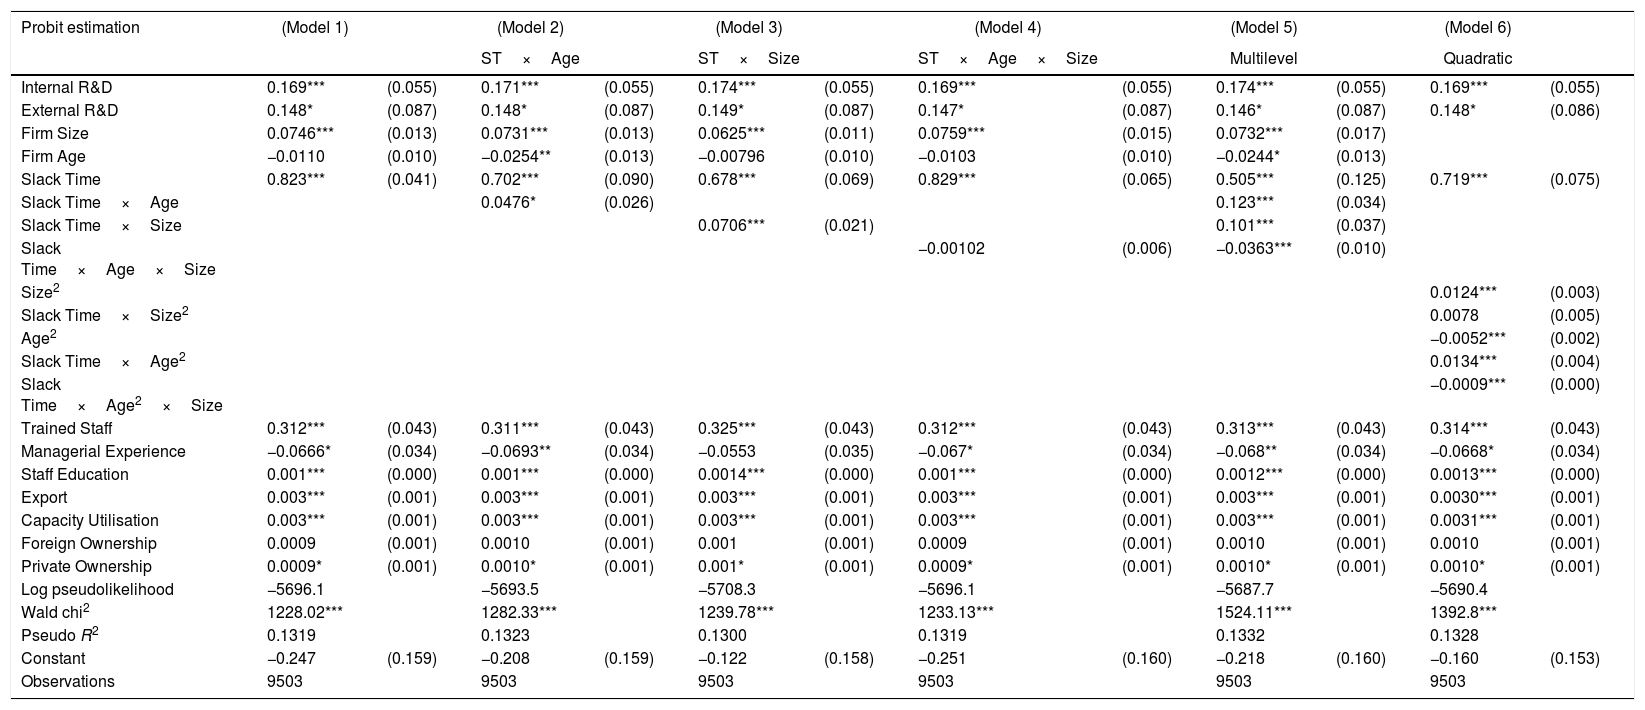
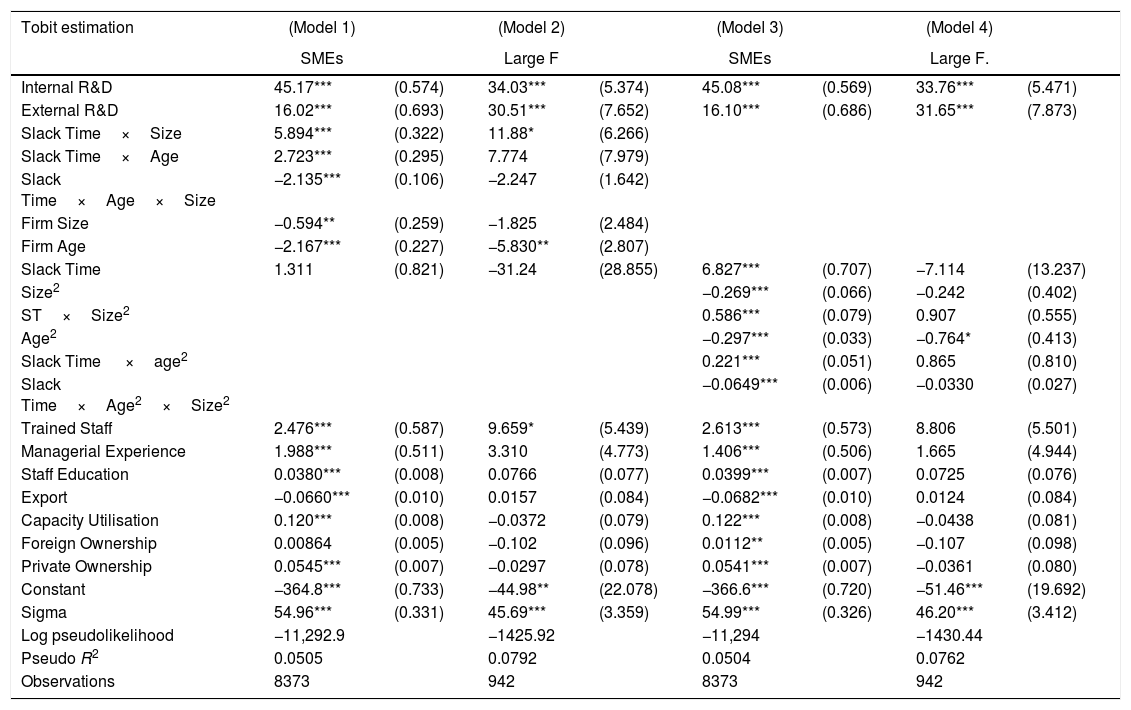
The study originally examines the slack-innovation-performance relationship by moderating firm age and size with slack time to predict the implementation of product innovation. Four different estimations are performed with two distinct econometrics models owing to two distinct operationalisations of the dependent variables. While in the main estimations, we employ a probit-2sls estimation method owing to the binary nature of the dependent variable, the robustness estimation is performed with a Tobit model because of the censored dependent variable. We also perform further estimation using the Probit model to observe the dynamics and divergence in the results relating to the ivtreatreg with the 2sls output. With the Probit and Tobit estimations, the standard errors are adjusted for 282 clusters in country and industry, respectively. Table A1 reports the probit estimation, while Table A3 reports separate estimations for SMEs and large firms.
Now to the central estimation, this study hypothesises a positive relationship between firm age, firm size, slack time and innovation. The findings of Model 1, Table 2, in which all other variables are introduced in the estimation without the interaction variables, show that firm size (b=0.023, p<0.01) and slack time (b=0.228, p<0.01) support the introduction of product innovation. The results support our H1 and H3, respectively. However, there is no evidence for firm age supporting the introduction of product innovation; hence, our H1 is not confirmed. These results add to the inconclusive arguments of the role of age in the ability of firms to innovate. While the result upholds the findings of previous studies, it also contradicts the discoveries of related studies regarding the age-innovation performance relationship. However, other variables included in this estimation show a significantly positive relationship with product innovation except for managerial experience and external R&D where we observe a significantly negative relationship, and no significant relation for foreign ownership. The results follow in this order internal R&D (b=0.346, p<0.01); external R&D (b=−140, p<0.10); trained staff (b=0.093, p<0.01); managerial experience (b=−0.026, p<0.10); staff education (b=−0.0004, p<0.01); export (b=0.001, p<0.01); capacity utilisation (b=0.001, p<0.01); private ownership (b=0.0004, p<0.05).
Moreover, Model 2 in Table 2 begins with the interaction variables. The fourth proposition suggests that firm age and slack time could reinforce each other to support the propensity to which firms innovate. In this approach, we follow one of the steps proposed by Aiken et al. (1991) and Cohen et al. (2013) by introducing the interaction variable after the control and observing the idiosyncratic effects. The H4 is supported, in that, firm age significantly and positively moderates slack time to support the introduction of product innovation (b=0.016, p<0.10). Similarly, we implement the same pattern to observe the direct moderation effect between firm size and slack time, concealing the moderation of age and slack time in Model 3, Table 2. The finding is also compelling in that firm size and slack time (b=0.018, p<0.01) reinforce each other to support the introduction of product innovation. H5 is then supported. This indicates that both age and size efficiently moderate the relationship between slack time and firm-level innovation performance. In Model 4 still Table 2, we propose a three-way relationship, that is, age-size-slack time effect on product innovation. The result yields no significant return to innovation. This indicates that firm age, size and slack time could not combine efficiently to predict a return to the introduction of product innovation, indicating that H6 is not supported.
Furthermore, in Model 5, we implement a multilevel estimation by incorporating all the moderators. While we observe a substantial increase in the coefficients of slack time×age (b=0.046, p<0.01) and slack time×size (b=0.030, p<0.05); the three-way moderation turns out to be significant but with a decline to innovation (b=−0.013, p<0.01). However, in Model 6, we estimate the quadratic relations by getting the squared terms of both firm age and size and further moderate with slack time to predict a performance relationship. The idea in this framework is simply to observe predictive outcomes when the age and size of the firms are doubled. The results that emerge indicate that the linear quadratic relationships between size and product innovation are observed to be positive and significant (b=0.0044, p<0.01) while that of age is significant but negative (b=−0.0018, p<0.01). Besides, we perform a moderating relation of age2 and size2 with slack time to predict a performance return to innovation. While we do not observe any relationship between the moderating effect of size2 and slack time on product innovation, the result that emerges for age2 and slack time is positive and significant (b=0.0045, p<0.01). While the linear moderation of age, size and slack time is not significant (see, Model 4, Table 2), in the quadratic-linear estimation, we observe age2×size2×slack time to be significant but negative, although with a somewhat negligible coefficient (b=−0.0003, p<0.01). The relationship of the combined effects of squared terms of firm age, size and ST produces an inverted U-shaped. The same development plays out in the Probit estimation with a trifling divergence.
Robustness checksThus far, the element of analysis has been a dummy variable capturing product innovation implementation. As the first robustness check, we re-examine our measurements (with some alterations) using a percentage of the main innovative products and services as a dependent variable in the framework. To do so, we employ a Tobit estimation maintaining the same collection of variables as employed in Eq. (4). The dependent variable is censored from the left, which justifies the utilisation of a Tobit model in establishing the association between the predicted and the explanatory variables.
The results that emerge from the robustness estimation diverge significantly from the results obtained in the central estimation. While we observe age to relate negatively with product innovation in Model 1, Table 3 (b=−3.11, p<0.01), no significant return obtained for firm size and innovation. Slack time is observed to be consistently significant across the entire model except in Model 5, that is the multilevel analysis. Similarly, while age moderates the relationship between slack time and innovation performance but inversely (b=−0.73, p<0.01), firm size significantly moderates the relationship between slack time and innovation (b=0.94, p<0.01). The three-way moderation also significantly but inversely predicts the slack-innovation relationship (b=−1.91, p<0.01). The quadratic estimation tends to differ marginally from the results in the central estimation. Both the quadratic coefficients of age (b=−0.35, p<0.01) and size (b=−0.30, p<0.01) are observed to relate inversely significant to the implementation of product innovation. Interestingly, the quadratic-by linear relations between slack×age (b=0.17, p<0.01) and slack time×size (b=0.74, p<0.01) are observed to be positive and significant. The three-way quadratic estimation as obtained in the primary estimation also predicts an inverted U-shaped relationship. All the control variables maintain the same levels of significance as with the case in the central estimation.
The moderating role of firm age and size on the relationship between innovation and slack time (robustness estimation).
| Tobit estimation | (Model 1) | (Model 2) | (Model 3) | (Model 4) | (Model 5) | (Model 6) | ||||||
|---|---|---|---|---|---|---|---|---|---|---|---|---|
| ST×Age | ST×Size | ST×Age×Size | Multilevel | Quadratic | ||||||||
| Internal R&D | 44.48*** | (0.559) | 44.45*** | (0.568) | 44.45*** | (0.563) | 44.47*** | (0.562) | 44.66*** | (0.564) | 44.48*** | (0.560) |
| External R&D | 19.59*** | (0.633) | 19.60*** | (0.642) | 19.49*** | (0.639) | 19.61*** | (0.637) | 19.52*** | (0.639) | 19.67*** | (0.632) |
| Firm Size | −0.190 | (0.209) | −0.172 | (0.212) | 0.099*** | (0.128) | 0.0723 | (0.213) | −1.382*** | (0.217) | ||
| Firm Age | −3.111*** | (0.216) | −2.831*** | (0.224) | −3.214*** | (0.216) | −2.952*** | (0.217) | −2.533*** | (0.222) | ||
| Slack Time | 9.629*** | (0.562) | 11.39*** | (0.718) | 7.359*** | (0.648) | 10.66*** | (0.615) | −2.719*** | (0.784) | 5.091*** | (0.665) |
| Slack Time×Age | −0.729*** | (0.238) | 2.823*** | (0.272) | ||||||||
| Slack Time×Size | 0.939*** | (0.202) | 7.443*** | (0.254) | ||||||||
| Slack Time×Age×Size | −0.179*** | (0.059) | −1.914*** | (0.079) | ||||||||
| Size2 | −0.304*** | (0.041) | ||||||||||
| Slack Time×Size2 | 0.741*** | (0.045) | ||||||||||
| Age2 | −0.348*** | (0.032) | ||||||||||
| Slack Time×Age2 | 0.170*** | (0.044) | ||||||||||
| Slack Time×Age2×Size2 | −0.0329*** | (0.003) | ||||||||||
| Trained Staff | 2.829*** | (0.557) | 2.857*** | (0.582) | 2.499*** | (0.570) | 2.883*** | (0.564) | 2.879*** | (0.584) | 2.798*** | (0.570) |
| Managerial Experience | 2.420*** | (0.490) | 2.461*** | (0.500) | 2.208*** | (0.490) | 2.474*** | (0.492) | 2.682*** | (0.497) | 1.802*** | (0.490) |
| Staff Education | 0.0395*** | (0.007) | 0.0396*** | (0.008) | 0.0370*** | (0.007) | 0.0394*** | (0.007) | 0.0407*** | (0.007) | 0.0415*** | (0.007) |
| Export | −0.0762*** | (0.009) | −0.0757*** | (0.009) | −0.0809*** | (0.009) | −0.0749*** | (0.009) | −0.0731*** | (0.009) | −0.0800*** | (0.009) |
| Capacity Utilisation | 0.106*** | (0.008) | 0.106*** | (0.008) | 0.103*** | (0.008) | 0.106*** | (0.008) | 0.109*** | (0.008) | 0.108*** | (0.008) |
| Foreign Ownership | −0.00210 | (0.005) | −0.00240 | (0.005) | −0.00498 | (0.005) | −0.00249 | (0.005) | 0.00001 | (0.005) | 0.0003 | (0.005) |
| Private Ownership | 0.0570*** | (0.007) | 0.0569*** | (0.007) | 0.0570*** | (0.007) | 0.0566*** | (0.007) | 0.0593*** | (0.007) | 0.0581*** | (0.007) |
| Constant | −351.2*** | (0.731) | −351.3*** | (0.736) | −360.3*** | (0.732) | −351.2*** | (0.731) | −360.3*** | (0.729) | −354.1*** | (0.721) |
| Sigma | 55.37*** | (0.324) | 55.36*** | (0.325) | 55.37*** | (0.324) | 55.36*** | (0.324) | 55.28*** | (0.323) | 55.35*** | (0.320) |
| Log pseudolikelihood | −13,089 | −13,089 | −13,088 | −13,089 | −13,082 | −13,086 | ||||||
| Pseudo R2 | 0.0488 | 0.0488 | 0.0488 | 0.0488 | 0.0493 | 0.049 | ||||||
| Observations | 9503 | 9503 | 9503 | 9503 | 9503 | 9503 |
Note: The estimation controls for country, industry and year dummies. 7534 left-censored &1969 uncensored observations. Standard errors are adjusted for 282 clusters in country & industry. Standard errors in parentheses.
* p<0.10.
** p<0.05.
In addition to the above robustness check, utilising the same set of variables, and using the percentage of the main innovative product as a dependent variable, we further investigate the effect of the paired variables on both SMEs and large firms. Interestingly, the results that emerge in Table A3 relates more significantly positive to SMEs than large firms. Taking into account the first paired variables, ST×Size is observed thus: SMEs (b=5.89, p<0.01); ST×Age (b=2.72, p<0.01) and ST×Age×Size (b=−2.14, p<0.01). For large firms, we can only observe the results for ST×Size (b=11.8, p<0.05). Now Shifting to the quadratic estimations, the findings relate thus: for SMEs, ST×Size2 (b=0.59, p<0.01); ST×Age2 (b=0.22, p<0.01) and ST×Age2×Size2 (b=−0.065, p<0.01). For large firms, no significant result emerges. All the inclusive variables are found to be statistically significant for SMEs. An instance is the internal and external R&D. Both activities are found to be consistently significant and positive for all firm types. Indeed, while the definition of large firms and SMEs could vary regarding countries and economy size, these results reveal that if the top managers can manage the allocation of slack time more efficiently, its return to firm performance regarding product innovation is guaranteed.
The third aspect of the robustness check involves marginal effects. These graphs are captured in Fig. 3. We generate predictive marginal graphs for both the direct and quadratic interactions. The results that emerge in the plots reveal a further nuanced slack-performance relationship. Fig. B1 in the top left reveal a linear relationship between slack time and product innovation at the middle-size point of the interaction graph. At this point, the ability of a potential implementation of product innovation by firms is assured. There is also a latitude to which the movement of the line could either relate to a decline or an increase to product innovation. The graph shows that size plays a role in the offering of slack time to employees to generate innovative ideas. As envisaged, Fig. B2 at the top right graph is the quadratic state of firm size and how it moderates slack time to support the implementation of product innovation. It is observed that as the firm grows in size, the ability to implement the introduction of product innovation looks positive.

Further, Figs. B3 and B4 show the slack-time-age interaction. The result emerging from Fig. B3 shows that the ability of firms to obtain returns to the implementation of product innovation when alloting slack time to employees to generate innovative ideas in the workplace is confirmed to be more productive when firms are younger. This reignites the ongoing debate regarding the ability of new entrants into the market to outsmart incumbents in the introduction of innovation. The situation, however, refutes the liability of newness hypothesis. While Fig. B4 reverses the observed case in Fig. B3, it shows that when firms grow older, the ability to generate returns to innovation with the utilisation of slack time is further illustrated. Both graphs reveal somewhat interesting extreme cases. While in the early stage of operations, new firms leverage their new products and capabilities to influence the market. At the latter stage of the firms, however, the stability of firms in the market could relate to knowing the dynamics in the market and probably have established a clientele-supplier relationship which allows them to leverage on employees’ slack time for innovation optimisation. We observe interesting dynamics when the initial size of the firms is considered (i.e. the number of employees when operations began). The initial size also moderates the relationship between slack time in supporting the implementation of product innovation. The result indicates that at the upper level of employees growth, the use of slack time remains supportive of firms innovative capabilities. The lower interactive graphs illustrate the three-way moderation of age, size and slack time. A nuanced picture also emerges on the relationship between firm age-size-slack-time in predicting the return to firm-level innovation.
Discussion and conclusionIn this study, we assess how firm age and size moderate the relationship between slack time and firms’ ability to implement product innovation. In the first investigation, the direct role of firm age, firm size and slack time is tested. The results that emerge for size indicate a positive and significant relationship with firms’ ability to innovate. On the contrary, firm age relates significantly negative with the ability of the firms to introduce product innovation. These results, however, align with and contradict a few innovation studies in explaining the age-size-innovation relationship. Similarly, the direct effect of slack time is found to be positive and significant with product innovation. This relationship is observed to be consistently significant across the models. The result supports the claims of van Uden et al. (2017) on the slack time-product innovation nexus. We have examined the link between slack time and firm performance using multifaceted approaches under the two distinct firm-level characteristics. These firm-level characteristics are age and size. We ask in this study if the blend of firm age and size with slack time could predict the ability to introduce product innovation efficiently. In the estimations, we infuse variables that are contributory to the innovative capabilities of the firms.
This paper proposes that the slack-innovation connection signifies an explicit collection of resources managed by the tactical control of management, and as such, assessing this link can offer additional understanding into slack time strategies (Sirmon et al., 2007). The findings of this study offer a paradigm for experts making strategic decisions built on the resource-based view of the firms. It maintains in the resource-based view that varied firm explicit collections of resources and capabilities offer means for the upheld competitive benefit (Barney, 1991, 2001a, 2001b; Conner, 1991; Lavie, 2006; Sirmon et al., 2007). Resources and capabilities inside the firm can be grouped into physical assets, such as financial capital resources and immaterial assets, which include human and organisational capital resources (Barney, 1991). As observed in the literature, it goes beyond availability for a firm to have unique competitive leverage over its rivals in the marketplace (Hamel & Prahalad, 1990; Priem, 2001; Sirmon et al., 2007; Van de Ven, 2008). What perhaps allows a firm to have sustained competitive benefit in the marketplace is the discovery and packaging of the particular resources in a blend with the efficient utilisation of capabilities that can eventually generate maintainable competitive gains (Amit & Schoemaker, 1993; Amit et al., 2007; Hamel & Prahalad, 1990).
The estimation relies on both the linear and quadratic findings to explain the slack-innovation relationship. The relationships are observed under the various level of firm age and size, as reflected in the predictive marginal effects. While slack time relates significantly to the ability to implement product innovation, it can also efficiently complement firm age and size to result in better performance. We do not observe a negative link between slack time and performance at both the head and tail of the age and size of the firms. Although, we observe that at a specific level of firm age and size; the role of slack time in supporting the firm-level implementation of product innovation reveals a more nuanced picture. For the advantage role, employees’ slack provides supplementary resources that allow firms to explore new opportunities and develop new products, while firm age and size can guarantee the success of the application of these novel firm-level practices. While managerial experience could help balance the agency hitches generated by excessive employees’ slack application, firm age and size are found to help cushion the effects that might arise in the application of slack time in the optimisation of innovation. These findings provide a richer understanding of the impact of employees’ slack time on firm performance and hence develop the behavioural or interactive hypothesis of the firm.
Practical implicationsThe implications of our findings for practitioners and decision-makers are twofold. Although we contend that firm age and size can help firms transform employees’ slack time into performance more efficiently; practitioners and policymakers should be conscious that the age and size of the firms do not continually generate higher performance. As observed in the predictive margins for firm size, the midpoint (Fig. B1) reflects the efficient level that slack time efficiently support the implementation of product innovation. The squared function of firm size (Fig. B2) reveals an inverted-U shaped relationship between slack and innovation. Taking the age of the firm, the predictive margin graph (Fig. B3) relates that new entrant firms into the market could benefit from the utilisation of slack time to support innovation.
Similarly, the reverse tends to be the case when we square the age of the firm. It reveals that older firms could also benefit from the utilisation of slack time to complement the introduction of innovation (see, Fig. B4). This could be the case for small companies that have limited additional slack resources – for these firms, improvised rather than planned activities may be more conducive to higher performance. As the allotment of employees’ slack increases, the effects of managerial monitoring could increase as well to ensure a balance. Firms with abundant slack resources could exploit either their age or size to offset the negative effects of excessive slack and allot resources to attain improved performance.
Furthermore, an important revealed practical implication of the overall findings indicates that firms would gain from allotting slack time to employees because innovation flourishes on redundancy. If employees are constantly strained or stretched and have their minds always absorbed by the workplace bureaucracy, they are much less likely to think creatively compared to when they have some free time to think freely. Mostly, firms would have to extemporised from their fallowed resources to optimise performance. This study practically reveals that the logic of successful innovation is to amass capabilities and devise an appropriate means to use them for the benefit of the firms. Hence, top managers must be willing to cut the mustard when it concerns strategy deployment for performance. However, the fundamental predicament managers at times grapple with is whether, first, they should build up in surplus resources to cushion their firms from internal and external shocks and to hound novel prospects or whether, second, they should develop sinewy enterprises. Managers who are willing to go for broke would prefer to create both surplus slack resources, influential and strong enterprises at the same time. As a result, this study establishes that extemporised resource like the slack time, that might be daunting for top managers to allot effectively amongst the employees, contributes to firm performance; especially in the case of a pooled regression and SMEs. While the management of different slack resources mainly relies on the qualities of such resources and its perceived relevance to the success of a firm; this study finds that the firm-level attributes, age and size, are also quintessential to whichever strategy firms adopt to optimise performance.
Another essential area that offers a pragmatic implication concerns the perceived performance-effect of slack time for SMEs. There is a wind of caution that should be exercised by top managers of SMEs regarding the utilisation of slack time as a performance indicator. In the earlier review of the anecdotal effect of slack time, it shows that large firms have benefitted from the offering of slack time to their employees for creative ideas to support either the projects of the focal firms or the personal development of the employees themselves. However, if financial slack is considered more closely, it might still be more conducive for large firms to offer a higher amount of slack time to their employees as compared to SMEs. This financial slack (it refers to extra financial flows available to firms but not primarily part of the working capital) could help cushion the negative effect that might arise from the excessive usage of this extemporised resource, slack time, for performance. It then informs managers of SMEs that in case the ability to fall back on an extra financial resource is not available, this study suggests that top managers would have to prioritise the offering of slack time to desired or selected employees that are more connected to the overall performance goal of the firm. What this study has not tested is the role slack time could play for the R&D department or the overall R&D activities of the focal firms. In that regards, SMEs could try to narrow the allotment of slack time to the employees that constitute the R&D section, and through this strategy, they can limit the damage arising from the allotment and utilisation of slack time.
LimitationsThis study has some shortcomings that should be considered when interpreting the findings, and that also propose avenues for potential research in this area. First, the study sample consists of companies in sub-Saharan Africa that are farther from technological frontiers and whose operations are impeded by the weak institutions and leapfrogging economies. In that, the use of slack time might reveal a quite substantial divergence when compared with other regions of the world that are much closer to technological frontiers and boast of the quality of institutions. A generalisation of the findings obtained within the purview of firms that operate in Africa and other regions of the world that exhibit similarly political and economic configurations could hold. However, such may not constrain any generalizability of the findings to other countries with better institutional configuration.
From the data viewpoint, the study utilises cross-section data, and hence, the estimations could only confirm the link between the explained and explanatory variables within the framework of the dataset. Consequently, we could not assess the long-term impact of employees’ slack time on product innovation more robustly. Nevertheless, this does not emasculate the strength and relevance of our findings. Further, the issue of causation is also complicated while employing a cross-section dataset; so future research may address the possible causality concerns if the appropriate data is available. We espouse the idea of Atuahene-Gima (2005) that slack mirrors firms’ resources and market influence to utilise subsisting competencies, create new ones, and implement innovations, which is a rational and effortlessly useful representation of employees’ slack.
Avenues for potential researchSlack has frolicked an essential role in organisational concepts of survival, growth, and performance. However, the argument still subsists regarding the optimum amount of slack to enhance firm performance. In this study, this argument is broadened by considering how firm age and size could play a role in the allotment of slack time to employees for innovative performance optimisation. We examine employees’ slack time and validate that its relationship with firm-level innovation performance is moderated by firm age and size. The results indicate that in earlier and advanced levels of firm age, there is a linear relationship between employees’ slack and firm performance, but in the midpoint of firm size and the point where firms document excess workforce, there is an inverse U-shaped relationship between slack time and innovation.
We hope these findings provide some basis for future studies to address the complex interaction of slack and other elements in the assessment of firm performance. A few intellectuals have indicated that management prudence given by resources and innovative tendency could also mediate the link between slack and performance (Bradley, Shepherd, et al., 2011; Bradley, Wiklund, et al., 2011; Cheng, Chang, & Li, 2013). Interested scholars could consider this avenue. Another potential area could involve the application of this scope to the other three innovation types to see how the dynamics of the results could play out. Also, the fact that most African countries do not diverge in some key institutional and economic factors, a comparative cross-country study could still be explored by considering a different time-period. An interesting research question that further emerges from this study concerns how diverse external knowledge sources moderate slack time to support firm-level innovation performance. A further area of study that emanates is the idea of a combination of strategy for performance optimisation. A complementarity or substitutability of strategy should be worthwhile in internal and external R&D and slack time; managerial experience and slack time;R&D staff and slack time. Also, another vital area for future research is whether employees’ slack time could serve as a substitute for external cooperation or help bridge the gap in knowledge divergence between firms. It could help inform top managers on the allocation of slack time to employees for the generation of novel ideas in the workplace as a means of optimising innovation performance.
Uncited references: This section comprises references that occur in the reference list but not in the body of the text. Please cite each reference in the text or, alternatively, delete it.
Academy and Oct (2007), Agarwal, Audretsch, and Sarkar (2014), Armstrong and Shimizu (2007), Arrow (1972), Aydın Unal, Unal, and Isık (2017), Prahalad and Hamid (2007), Terry Mousa and Chowdhury (2014), Valaei and Rezaei (2016), and Yoon, Lee, Lin, and Eyring (1976).
The author gratefully acknowledges the PhD sponsorship provided by Katholischer Akademischer Ausländer-Dienst (KAAD). The funding body was not involved in the study design, collection, analysis and interpretation of data, or in the writing of the paper. The author remains grateful to Dr. Abiodun Egbetokun for his constructive comments.
The moderating role of firm age and size on the relationship between product innovation and slack time.
| Probit estimation | (Model 1) | (Model 2) | (Model 3) | (Model 4) | (Model 5) | (Model 6) | ||||||
|---|---|---|---|---|---|---|---|---|---|---|---|---|
| ST×Age | ST×Size | ST×Age×Size | Multilevel | Quadratic | ||||||||
| Internal R&D | 0.169*** | (0.055) | 0.171*** | (0.055) | 0.174*** | (0.055) | 0.169*** | (0.055) | 0.174*** | (0.055) | 0.169*** | (0.055) |
| External R&D | 0.148* | (0.087) | 0.148* | (0.087) | 0.149* | (0.087) | 0.147* | (0.087) | 0.146* | (0.087) | 0.148* | (0.086) |
| Firm Size | 0.0746*** | (0.013) | 0.0731*** | (0.013) | 0.0625*** | (0.011) | 0.0759*** | (0.015) | 0.0732*** | (0.017) | ||
| Firm Age | −0.0110 | (0.010) | −0.0254** | (0.013) | −0.00796 | (0.010) | −0.0103 | (0.010) | −0.0244* | (0.013) | ||
| Slack Time | 0.823*** | (0.041) | 0.702*** | (0.090) | 0.678*** | (0.069) | 0.829*** | (0.065) | 0.505*** | (0.125) | 0.719*** | (0.075) |
| Slack Time×Age | 0.0476* | (0.026) | 0.123*** | (0.034) | ||||||||
| Slack Time×Size | 0.0706*** | (0.021) | 0.101*** | (0.037) | ||||||||
| Slack Time×Age×Size | −0.00102 | (0.006) | −0.0363*** | (0.010) | ||||||||
| Size2 | 0.0124*** | (0.003) | ||||||||||
| Slack Time×Size2 | 0.0078 | (0.005) | ||||||||||
| Age2 | −0.0052*** | (0.002) | ||||||||||
| Slack Time×Age2 | 0.0134*** | (0.004) | ||||||||||
| Slack Time×Age2×Size | −0.0009*** | (0.000) | ||||||||||
| Trained Staff | 0.312*** | (0.043) | 0.311*** | (0.043) | 0.325*** | (0.043) | 0.312*** | (0.043) | 0.313*** | (0.043) | 0.314*** | (0.043) |
| Managerial Experience | −0.0666* | (0.034) | −0.0693** | (0.034) | −0.0553 | (0.035) | −0.067* | (0.034) | −0.068** | (0.034) | −0.0668* | (0.034) |
| Staff Education | 0.001*** | (0.000) | 0.001*** | (0.000) | 0.0014*** | (0.000) | 0.001*** | (0.000) | 0.0012*** | (0.000) | 0.0013*** | (0.000) |
| Export | 0.003*** | (0.001) | 0.003*** | (0.001) | 0.003*** | (0.001) | 0.003*** | (0.001) | 0.003*** | (0.001) | 0.0030*** | (0.001) |
| Capacity Utilisation | 0.003*** | (0.001) | 0.003*** | (0.001) | 0.003*** | (0.001) | 0.003*** | (0.001) | 0.003*** | (0.001) | 0.0031*** | (0.001) |
| Foreign Ownership | 0.0009 | (0.001) | 0.0010 | (0.001) | 0.001 | (0.001) | 0.0009 | (0.001) | 0.0010 | (0.001) | 0.0010 | (0.001) |
| Private Ownership | 0.0009* | (0.001) | 0.0010* | (0.001) | 0.001* | (0.001) | 0.0009* | (0.001) | 0.0010* | (0.001) | 0.0010* | (0.001) |
| Log pseudolikelihood | −5696.1 | −5693.5 | −5708.3 | −5696.1 | −5687.7 | −5690.4 | ||||||
| Wald chi2 | 1228.02*** | 1282.33*** | 1239.78*** | 1233.13*** | 1524.11*** | 1392.8*** | ||||||
| Pseudo R2 | 0.1319 | 0.1323 | 0.1300 | 0.1319 | 0.1332 | 0.1328 | ||||||
| Constant | −0.247 | (0.159) | −0.208 | (0.159) | −0.122 | (0.158) | −0.251 | (0.160) | −0.218 | (0.160) | −0.160 | (0.153) |
| Observations | 9503 | 9503 | 9503 | 9503 | 9503 | 9503 |
Note: The estimations control for country, industry and year dummies. Standard errors in parentheses.
Descriptive statistics and correlation matrix of estimation variables.
| Variables | Mean | S.D. | Min | Max | 1 | 2 | 3 | 4 | 5 | 6 | 7 | 8 | 9 | 10 | 11 | 12 | 13 | 14 | 15 | 16 | 17 | 18 | 19 | 20 | 21 | 22 | 23 | 24 |
|---|---|---|---|---|---|---|---|---|---|---|---|---|---|---|---|---|---|---|---|---|---|---|---|---|---|---|---|---|
| % of Main Prod&Ser | 7.32 | 18.9 | 0 | 100 | 1 | |||||||||||||||||||||||
| Product Innovation | 0.54 | 0.5 | 0 | 1 | 0.18 | 1 | ||||||||||||||||||||||
| Firm Size (log) | 2.2 | 1.41 | 0 | 9.1 | 0 | 0.16 | 1 | |||||||||||||||||||||
| Firm Age (log) | 2.57 | 1.43 | 0 | 7.6 | −0.08 | 0 | 0.14 | 1 | ||||||||||||||||||||
| Slack Time | 0.41 | 0.49 | 0 | 1 | 0.08 | 0.35 | 0.18 | 0.02 | 1 | |||||||||||||||||||
| Internal R&D | 0.11 | 0.31 | 0 | 1 | 0.23 | 0.1 | 0.08 | 0 | 0.12 | 1 | ||||||||||||||||||
| External R&D | 0.04 | 0.2 | 0 | 1 | 0.17 | 0.07 | 0.06 | −0.01 | 0.08 | 0.41 | 1 | |||||||||||||||||
| Trained Staff | 0.28 | 0.45 | 0 | 1 | 0.04 | 0.21 | 0.22 | 0.05 | 0.31 | 0.11 | 0.06 | 1 | ||||||||||||||||
| Managerial Exp. | 0.18 | 0.38 | 0 | 1 | 0.01 | 0.03 | 0.16 | 0.16 | 0.05 | 0.06 | 0.03 | 0.07 | 1 | |||||||||||||||
| Staff Education | 53.2 | 38.3 | 0 | 100 | 0.03 | 0.07 | 0.21 | −0.03 | 0.04 | 0.04 | 0.02 | 0.12 | 0.02 | 1 | ||||||||||||||
| Export | 4.4 | 15.7 | 0 | 100 | −0.02 | 0.06 | 0.1 | 0.03 | 0.07 | 0.01 | −0.01 | 0.07 | 0.01 | −0.06 | 1 | |||||||||||||
| Capacity Utilisation | 22 | 35.9 | 0 | 100 | 0.03 | 0.1 | 0.19 | 0.02 | 0.1 | 0.06 | 0.01 | 0.05 | 0.11 | 0.05 | 0.03 | 1 | ||||||||||||
| Foreign Ownership | 10.2 | 27.6 | 0 | 100 | 0.03 | 0.03 | 0.1 | −0.07 | 0.04 | 0.05 | 0.05 | 0.06 | −0.01 | 0.06 | 0.06 | 0.01 | 1 | |||||||||||
| Private Ownership | 73.7 | 41.3 | 0 | 100 | 0.02 | 0 | −0.06 | −0.03 | 0 | −0.01 | −0.03 | −0.02 | 0.02 | 0.1 | −0.12 | 0.08 | −0.55 | 1 | ||||||||||
| Year | 0.35 | 0.48 | 0 | 1 | 0.02 | 0.05 | 0.07 | 0.05 | 0.05 | 0.11 | 0.04 | 0.08 | 0.07 | 0.06 | −0.02 | 0.12 | 0.03 | 0.18 | 1 | |||||||||
| Patent | 0.04 | 0.2 | 0 | 1 | 0.23 | 0.07 | 0.04 | −0.04 | 0.05 | 0.18 | 0.15 | 0.01 | 0 | 0 | −0.01 | 0 | −0.01 | 0 | −0.01 | 1 | ||||||||
| Political Instability | 0.19 | 0.4 | 0 | 1 | 0.02 | 0.01 | 0.01 | −0.03 | 0.01 | 0 | −0.01 | −0.01 | 0.01 | 0 | 0 | −0.03 | −0.03 | −0.06 | −0.07 | 0 | 1 | |||||||
| Corruption | 0.25 | 0.43 | 0 | 1 | −0.01 | −0.01 | 0.01 | 0 | −0.01 | −0.01 | 0 | −0.01 | 0.02 | −0.03 | 0.01 | −0.02 | −0.03 | −0.07 | −0.09 | 0 | 0.3 | 1 | ||||||
| Small Firms | 0.61 | 0.49 | 0 | 1 | −0.01 | −0.1 | −0.45 | −0.12 | −0.12 | −0.07 | −0.03 | −0.16 | −0.1 | −0.07 | −0.1 | −0.11 | −0.1 | 0.09 | 0 | −0.02 | 0.01 | 0.01 | 1 | |||||
| SMEs | 0.27 | 0.45 | 0 | 1 | −0.02 | 0.06 | 0.23 | 0.05 | 0.07 | 0.02 | 0 | 0.08 | 0.05 | 0.04 | 0.03 | 0.06 | 0.05 | −0.06 | −0.01 | 0.01 | 0 | 0.01 | −0.76 | 1 | ||||
| Large Firms | 0.10 | 0.3 | 0 | 1 | 0.01 | 0.09 | 0.45 | 0.11 | 0.12 | 0.09 | 0.06 | 0.16 | 0.1 | 0.06 | 0.13 | 0.11 | 0.12 | −0.08 | 0.06 | 0.03 | −0.02 | −0.03 | −0.41 | −0.2 | 1 | |||
| Manufacturing | 0.41 | 0.49 | 0 | 1 | 0.02 | 0.04 | 0.13 | 0.09 | 0.08 | 0.05 | 0.02 | 0.03 | 0.1 | −0.05 | 0.06 | 0.73 | 0.01 | 0.04 | 0.15 | −0.01 | −0.07 | −0.02 | −0.12 | 0.05 | 0.13 | 1 | ||
| Retail | 0.24 | 0.42 | 0 | 1 | 0.01 | −0.04 | −0.15 | −0.08 | −0.08 | −0.02 | −0.01 | −0.06 | −0.07 | 0.01 | −0.07 | −0.34 | 0 | 0.01 | −0.06 | 0 | 0 | −0.03 | 0.13 | −0.09 | −0.11 | −0.46 | 1 | |
| Services | 0.35 | 0.48 | 0 | 1 | −0.02 | −0.01 | 0 | −0.02 | −0.01 | −0.03 | −0.01 | 0.02 | −0.04 | 0.05 | 0 | −0.45 | −0.01 | −0.05 | −0.1 | 0.01 | 0.08 | 0.04 | 0.01 | 0.03 | −0.04 | −0.62 | −0.41 | 1 |
Relationship between age, size, slack time and innovation (SMEs & large firms).
| Tobit estimation | (Model 1) | (Model 2) | (Model 3) | (Model 4) | ||||
|---|---|---|---|---|---|---|---|---|
| SMEs | Large F | SMEs | Large F. | |||||
| Internal R&D | 45.17*** | (0.574) | 34.03*** | (5.374) | 45.08*** | (0.569) | 33.76*** | (5.471) |
| External R&D | 16.02*** | (0.693) | 30.51*** | (7.652) | 16.10*** | (0.686) | 31.65*** | (7.873) |
| Slack Time×Size | 5.894*** | (0.322) | 11.88* | (6.266) | ||||
| Slack Time×Age | 2.723*** | (0.295) | 7.774 | (7.979) | ||||
| Slack Time×Age×Size | −2.135*** | (0.106) | −2.247 | (1.642) | ||||
| Firm Size | −0.594** | (0.259) | −1.825 | (2.484) | ||||
| Firm Age | −2.167*** | (0.227) | −5.830** | (2.807) | ||||
| Slack Time | 1.311 | (0.821) | −31.24 | (28.855) | 6.827*** | (0.707) | −7.114 | (13.237) |
| Size2 | −0.269*** | (0.066) | −0.242 | (0.402) | ||||
| ST×Size2 | 0.586*** | (0.079) | 0.907 | (0.555) | ||||
| Age2 | −0.297*** | (0.033) | −0.764* | (0.413) | ||||
| Slack Time ×age2 | 0.221*** | (0.051) | 0.865 | (0.810) | ||||
| Slack Time×Age2×Size2 | −0.0649*** | (0.006) | −0.0330 | (0.027) | ||||
| Trained Staff | 2.476*** | (0.587) | 9.659* | (5.439) | 2.613*** | (0.573) | 8.806 | (5.501) |
| Managerial Experience | 1.988*** | (0.511) | 3.310 | (4.773) | 1.406*** | (0.506) | 1.665 | (4.944) |
| Staff Education | 0.0380*** | (0.008) | 0.0766 | (0.077) | 0.0399*** | (0.007) | 0.0725 | (0.076) |
| Export | −0.0660*** | (0.010) | 0.0157 | (0.084) | −0.0682*** | (0.010) | 0.0124 | (0.084) |
| Capacity Utilisation | 0.120*** | (0.008) | −0.0372 | (0.079) | 0.122*** | (0.008) | −0.0438 | (0.081) |
| Foreign Ownership | 0.00864 | (0.005) | −0.102 | (0.096) | 0.0112** | (0.005) | −0.107 | (0.098) |
| Private Ownership | 0.0545*** | (0.007) | −0.0297 | (0.078) | 0.0541*** | (0.007) | −0.0361 | (0.080) |
| Constant | −364.8*** | (0.733) | −44.98** | (22.078) | −366.6*** | (0.720) | −51.46*** | (19.692) |
| Sigma | 54.96*** | (0.331) | 45.69*** | (3.359) | 54.99*** | (0.326) | 46.20*** | (3.412) |
| Log pseudolikelihood | −11,292.9 | −1425.92 | −11,294 | −1430.44 | ||||
| Pseudo R2 | 0.0505 | 0.0792 | 0.0504 | 0.0762 | ||||
| Observations | 8373 | 942 | 8373 | 942 |
Note: The estimation controls for country, industry and year dummies. 7534 left-censored & 1969 uncensored observations. Standard Errors are adjusted for 282 clusters in country & industry. Standard errors in parentheses.
Relationship between Employees’ Slack Time and Innovation Performance.
| Variables | (Model 1) | (Model 2) | (Model 3) | (Model 4) |
|---|---|---|---|---|
| ProdInno | ProcInno | MarkInno | OrgaInno | |
| Slack Time | 0.270*** | 0.513*** | 0.481*** | 0.742*** |
| (0.183) | (0.179) | (0.176) | (0.178) | |
| Firm Size | 0.025*** | 0.009 | 0.021*** | 0.010 |
| (0.006) | (0.006) | (0.006) | (0.006) | |
| Firm Age | −0.001 | 0.005 | 0.001 | 0.008** |
| (0.003) | (0.003) | (0.003) | (0.003) | |
| Trained Staff | 0.116** | 0.076 | 0.070 | 0.017 |
| (0.057) | (0.056) | (0.055) | (0.056) | |
| Managerial Experience | −0.008 | −0.019 | −0.045*** | −0.011 |
| (0.013) | (0.012) | (0.012) | (0.013) | |
| Staff Education | 0.000*** | 0.000 | 0.000** | −0.000 |
| (0.000) | (0.000) | (0.000) | (0.000) | |
| Internal R&D | 0.060** | 0.052** | 0.080*** | 0.018 |
| (0.026) | (0.026) | (0.025) | (0.026) | |
| External R&D | 0.050* | 0.032 | −0.003 | 0.011 |
| (0.029) | (0.029) | (0.028) | (0.029) | |
| Finance (Bank) | 0.002*** | 0.001** | 0.001** | 0.001 |
| (0.000) | (0.000) | (0.000) | (0.000) | |
| Industry Dummies | Yes | Yes | Yes | Yes |
| Year Dummy | Yes | Yes | Yes | Yes |
| Chi2 (83) | 2013.7 | 2291.0 | 2181.1 | 2309.6 |
| Prob>chi2 | 0.000 | 0.000 | 0.000 | 0.000 |
| sigma | 0.459 | 0.452 | 0.443 | 0.459 |
| rho | 0.041 | −0.219 | −0.111 | −0.484 |
| Constant | 0.446*** | 0.494*** | 0.492*** | 0.295* |
| (0.164) | (0.161) | (0.158) | (0.163) | |
| Observations | 9503 | 9503 | 9503 | 9503 |
Note: These estimation results are obtained from the instrumental variable binary treatment model using the Heckman option. Standard errors in parentheses.
Relationship between Slack Time and Innovation Performance.
| Variables | (Model 1) | (Model 2) | (Model 3) | (Model 4) |
|---|---|---|---|---|
| ProdInno | ProcInno | MarkInno | OrgaInno | |
| Slack Time | 0.809*** | 0.920*** | 1.066*** | 1.015*** |
| (0.041) | (0.034) | (0.035) | (0.035) | |
| Firm Age | −0.018* | −0.020 | −0.022** | 0.006 |
| (0.010) | (0.012) | (0.009) | (0.011) | |
| Firm Size | 0.067*** | 0.050*** | 0.058*** | 0.068*** |
| (0.012) | (0.014) | (0.013) | (0.014) | |
| Managerial Experience | −0.053 | −0.077* | −0.176*** | −0.057 |
| (0.033) | (0.040) | (0.038) | (0.040) | |
| Staff Education | 0.001*** | 0.001 | 0.001*** | −0.000 |
| (0.000) | (0.000) | (0.000) | (0.000) | |
| Trained Staff | 0.316*** | 0.325*** | 0.292*** | 0.351*** |
| (0.042) | (0.041) | (0.039) | (0.039) | |
| Internal R&D | 0.181*** | 0.265*** | 0.311*** | 0.204*** |
| (0.052) | (0.053) | (0.050) | (0.046) | |
| External R&D | 0.129 | 0.091 | −0.031 | 0.134 |
| (0.085) | (0.088) | (0.092) | (0.088) | |
| Finance (Bank) | 0.004*** | 0.002** | 0.003** | 0.004*** |
| (0.001) | (0.001) | (0.001) | (0.001) | |
| Manufacturing | 0.027 | 0.217*** | −0.049 | −0.112** |
| (0.043) | (0.042) | (0.047) | (0.051) | |
| Services | −0.028 | 0.039 | −0.082* | 0.042 |
| (0.043) | (0.040) | (0.049) | (0.041) | |
| Constant | −0.631*** | −0.778*** | −0.718*** | −1.041*** |
| (0.076) | (0.075) | (0.085) | (0.074) | |
| atrho | 0.764*** | 0.518*** | 0.440*** | 0.587*** |
| (0.028) | (0.032) | (0.027) | (0.028) | |
| rho | 0.644*** | 0.643*** | 0.476*** | 0.414*** |
| (0.021) | (0.017) | (0.025) | (0.023) | |
| Country dummies | Yes | Yes | Yes | Yes |
| Year dummy | Yes | Yes | Yes | Yes |
| Observations | 9503 | 9503 | 9503 | 9503 |
Note: Estimation performed with Multivariate Probit regression. Standard error adjusted for 282 clusters in country and industry. Log pseudolikelihood=−19,504.06. X2 (88): 7752.03***. Robust standard errors in parentheses.
Notable corporations’ case studies include Google (20%), Australian Software Company Atlassian (FedEx Days), 3M (15%), Twitter (hack week), Genentech (discretionary time) and W.L. Gore have seen the need to offer employees time to enhance performance. While Google offers 20% of the time to employees to think of what would be beneficial to Google (D’foro, 2015), 3M, on the other hand, offers employees 15% of their workweek focused on projects that are not necessarily connected to their usual work (Burkus, 2012). Similarly, Proteus, a California-based biomedical company, adopts Atlassian's slack time strategy but with a slight alteration encouraging employees to apply such in enhancing their personal development towards creative thinking (Bryant, 2011). Pink (2009) also documents the account of Intuit Canada, a company that allows employees 10% of their time devoted to an independent project of unique interest. This gears towards improving the creativeness of employees to better firm performance.
Since the study considers both WBES and IFS, we then select countries that have these characteristics. Our exclusion of other countries in the sub-region is based on non-availability of Innovation-Follow-up Surveys as we have in the 11 countries used in the study.
articles