


We observe a growing empirical literature on the divergence between labor productivity and compensation on a global scale. Empirical evidence of the decoupling for the OECD and transitional economies support the hypothesis of divergence between productivity and pay after 1980s. In this paper, we offer evidence of the decoupling in China from 1952 to 2018. We use state-of-the art, robust econometric techniques based on long memory to identify the main determinants of persistence and divergence. From 1952 to 2018, we measure the decoupling average annual growth rate of 0.93% (using per hour worked data). Productivity-compensation per worker divergence follows the average annual growth rate of 1.52%. We provide evidence that the decoupling in China is caused by innovation-based shifts, globalization, a shift to knowledge growth management, ‘supercycles and boom-bust,’ ‘superstars,’ declining labor share and increasing wage inequality. Knowledge and innovation based technological advancement accounts for the labor productivity and compensation divergence in China. The results show a diverging trend between labor productivity and labor compensation caused by innovation and knowledge growth model. Study results offer robust proofs for the decoupling with a long memory pattern in China with innovation and knowledge leading to an increasing inequality in the long run. Policy makers and practitioners should address the issue promptly if do not want to face various growth headwinds in the future.
Through globalization innovation-based growth and the digital economy are changing the relationship between labor productivity and workers’ compensation over time and space. Reflecting changes in the link between productivity-compensation after 1980s we find in the body of literature under ‘the great decoupling’ (Brynjolfsson & McAfee, 2013; Brynjolfsson, McAfee, & Manyika, 2014). Potential implications of falling labor compensation and rising productivity growth as an engine of growth are far-reaching. Not only in the science of economics (for policymakers and researchers) but also throughout society.
Empirical research findings from broad literature surveys on labor productivity and wage/compensation nexus offer a mixed picture on the issue. In this paper, we offer evidence and answers on the phenomena, studying the worlds’ economic growth machine-the ‘frontier’ economy of China from 1952 to 2018. To get the empirical results, we use state-of-the art, robust econometric modeling techniques based on long memory and fractional integration.
Main drivers of decoupling of wages from productivity in China over the observed period are: growth of total factor productivity (innovation-based growth), contribution of capital services provided by (ICT) assets to gross domestic product (GDP) growth (shift to knowledge capital), foreign direct investment (globalization), real gross fixed capital formation (capital deepening), labor income as a share of total value added (shifting labor share), the share of the tertiary industry in GDP growth (service industry and digital economy impact), super-cycles and boom-bust effect, ‘superstar’ effects and consolidation (Manyika et al., 2019), wage inequality (impact of increasing wage inequality).
The technological process embedded in capital assets (investment in new equipment) in China has a significant impact on labor productivity. This impact is visible in the ICT industries in China. Vertical disintegration process and firms’ organizational changes in the Chinese ICT sector (the digital economy in China accounts for 30% of the GDP) lead to augmenting labor-income inequality. This has a large impact on the net decoupling process in China, furthering productivity-compensation divergences. ICT sector development is strongly advancing in China, with the digital economy rapidly expanding. Maintaining favorable financial conditions by a constant and exponential increase in the money supply will (if we keep the present growth model) develop significant productivity-compensation divergences in China.
In this study, we define two indicators of net decoupling. We measure net decoupling as the difference in labor productivity (growth of GDP per hour worked deflated by the GDP deflator) and growth in average real compensation per hour worked deflated by the same index from 1952 to 2018. Calculated net decoupling defined as above we call NGDP. From 1952 to 2018, we measure an average annual growth rate in NGDP of 0.93%. Hence, from 1952 to 2018 in China, real labor productivity was growing annually 0.93% faster than (above) average real compensation. The trend in the decoupling measured by NGDP shows a significant change (regimes) in dynamics. From 1952 to 1975, China witnessed a large decoupling of wages from labor productivity. After 1980 the decoupling level declines for economic expansion (technology-driven investments) and rises when the 2008 bubble exploded. Supercycle and boom-bust effects in China significantly contribute to an increase in the productivity-compensation decoupling.
Unlike the OECD economies, decoupling is not a reflection of the decline in labor share. Income going to labor has a major impact on decoupling with effects similar to that of Spain, the UK, France, France, Sweden and Italy. Labor productivity growth in ‘superstars’ (as Huawei is driven by innovation and R&D and massive capital investments) notably exceeds real wages growth intensifying the decoupling. Capital deepening has a deep impact on decoupling in China. Our results show that a 1-percentage point increase in gross fixed capital formation reduces the decoupling gap by −0.851 percentage points. We know the change in labor share has a large impact on decoupling in China. Massive investments in fixed assets in the service industry raise the demand for highly skilled labor. Demand for high-skilled labor reduces capital-labor substitution in the service industry (accounting for 60% of the GDP), driving high-skilled labor wages up, increasing wage inequality and extending decoupling. We back this fact up with the empirical evidence on strongly rising income inequality in China from 1952 to 2018, with the GINI index rising by 1.05% annually. We can observe the close link between the rise in the net decoupling (+0.93% growth annually) and income inequality measured by the GINI index (+1.05% growth annually).
When we assess net decoupling using data productivity-compensation per worker instead of per hour worked, we get an average annual growth rate in NGDP of 1.52% compared to 0.93%. Hence, the net decoupling is significantly higher when using per worker indicator. Noticed differences in the net decoupling reflect different dynamics observed in productivity and compensation per worker/per hour worked. Estimating labor productivity per hour worked gives a better view of productivity trends than labor productivity per employed person, as it reduces variations in the full-time/part-time workforce structure over the years.
The rest of the article is organized as follows: First, a review of research on the net decoupling issue is presented describing previous knowledge on the ‘myth and reality of decoupling.’ In Section “The great decoupling in China 1952–2018”, we discuss the dynamics of the decoupling between labor productivity and compensation in China from 1952 to 2018. Data sources and methods are described in Section “Data and methodology” with the findings of the study presented in Section “Results”. The article concludes with a review of the study's findings and suggestions for future research.
Literature reviewThe ‘great decoupling’ we witness in China is mirroring the productivity paradox in innovative and knowledge-based growth firms (Kijek & Kijek, 2019). In our paper we study if the ‘great decoupling’ process in China can be accounted for by investments in innovation and knowledge as drivers of innovation-based growth models.
The relationship between productivity, wages and employment has been profusely dealt with in the economic literature and in the form of traditional economic theory. It is considered that productivity pushes wages up, which stimulates economic growth but that, wage growth is greater than that of productivity, the negative effect on labor demand will decrease wages. There are many studies that are based on the assumption of a negative trade-off between labor productivity and employment Cavelaars (2005) and a positive trade-off between labor productivity and wages (see, e.g., Abowd, Kramarz, & Margolis, 1999; Garnero, Giuliano, Mahy, & Rycx, 2016; Konings & Vanormelingen, 2015).
Technological progress, specifically robotization increase productivity Salter (1960), performance and profit lifting wages to high-skilled workers leaving behind low-paid, unskilled workers (Pehkonen, 1992; Lakshmi & Bahli, 2020). The importance of innovation, entrepreneurship and knowledge for country's economic development and progress is in details explained and validated in Piñeiro-Chousa, López-Cabarcos, Romero-Castro, and Pérez-Pico (2020).
Some studies have suggested that the increase in the real wage gap was one of the main causes of the increase in the unemployment rate in the 1970s in OECD countries (Bruno & Sachs, 1985). Ten years after this work, Gordon (1995) carried out a study that showed that in the 1980s there was no correlation between the increase in unemployment and the increase in the manufacturing wage gap. We find sufficient literature on the relationship between the wage-productivity gap and unemployment, which shows a small effect or even a lack of support for the wage gap as a determinant of unemployment (Madsen, 1994; McCallum, 1986; Myatt & Sephton, 1990; etc.). Robotization and artificial intelligence progress in the future could rise issues not only connected to inequality but also to poverty regarding the link between relative poverty and stock of knowledge (Sanz, Peris, & Escámez, 2017).
In the last four decades, the relationship between labor productivity and wages and employment has changed, calling into question traditional economic theories. The literature has offered us evidence of this phenomenon since, Mishel and Bernstein (1994) addressed an increasing gap between productivity growth rates and wages (and workers’ compensation, including bonus payments). This decoupling of labor productivity from the growth of real wages, called “the great decoupling” (Brynjolfsson & McAfee, 2013) was explained by arguing that it is being driven by technological progress and, therefore, is only increasing. Since then, most of the work has focused on the study of this phenomenon in the USA and there is a lot of evidence that shows that since the 1980s, wages have grown more slowly than productivity (Bernstein, 2017; Fleck, Glaser, & Sprague, 2011; Harrison, 2009; Lawrence, 2016; Mishel & Shierholz, 2011; Stansbury & Summers, 2018; etc.), though other works found no evidence of decoupling in the UK (Pessoa & Van Reenen, 2013). Other authors have studied the productivity-wages/employment gap resulting from rising inequality (Bivens & Mishel, 2015) and falling labor share in GDP (Baker, 2007). This created new research on the structural nature of decoupling (Karanassou & Sala, 2014) who considered that wages lagging behind productivity is a long-run structural phenomenon due to the interplay of wage dynamics and productivity growth. We also found multi-country empirical works on the great decoupling phenomena (Gil-Alana & Škare, 2018; Skare & Skare, 2017). Although there is a budget regarding the positive relationship between productivity and wages, several studies have stated that this relationship exists, but only in the long term (Kumar, Webber, & Perry, 2012; Strauss & Wohar, 2004; Wakeford, 2004, among others). The nature of firms’ international expansion also affect firm's level productivity (Gabrielczak & Serwach, 2018). However, we find different results when it comes to determining the direction of the causal links. While there are authors that consider productivity to be important to explain real wage rates (Khoon & Nyen, 2010; Nikulin, 2015; Nwaokoro, 2006), others think real salary is the main variable that is adjusted to maintain the cointegration relationship (Yusof, 2008). Finally, others have studied the process of fixing wages in different countries that have confirmed the bidirectional relationship between wages and productivity (Kumar et al., 2012; Millea, 2002). Country's economic structure (share of ICT sector in the economy) also impact business productivity over knowledge capital (Rico & Cabrer-Borrás, 2019). Type of investments (investments in tangible or knowledge assets) in the European manufacturing industry show long run impact on labor productivity (Stundziene & Saboniene, 2019). The decoupling phenomena is also emerging as consequence of shift from direct labor to product development cost policies (Philipson, 2020). We also find studies that analyze the relationship between productivity and wages in individual countries. To name just a few: van Soest and Stancanelli (2010) for France; Kodama and Odaki (2012), for Japan; Jain (2019) and Sabharwal (2007) for India; Barkery (2007), Strauss and Wohar (2004), Harrison (2009), Dunne, Foster, Haltiwanger, and Troske (2004) for the US; Sharpe, Harrison, and Arsenault (2008) for Canada; Wakeford (2004) for South Africa; Goh (2009) and Ho and Yap (2001) for Malaysia; Yildirm (2015) for Turkey, and Ferens (2017) for Poland.
Groups of countries have also been examined in Mistral (2011) and López-Villavicencio and Silva (2011) for the OECD, Meager and Speckesser (2011) for 25 countries in the period 1995–2009, Theodoropoulou (2019) for 25 EU member states. Millea (2002) analyzed the relationship between wages and productivity for six countries (Canada, France, Italy, Sweden, the UK, and the US) and concluded that there is a relationship between the two and that labor market institutions seem to influence the wage interaction-productivity. Mawejje and Okumu (2018) conclude that wages reflect labor productivity and worker skills in manufacturing enterprises in 39 African countries.
In the case of China, Zhang and Liu (2013) examined the relationship between labor productivity and wages between 1998 and 2007, showing that there was a positive correlation between these variables in the manufacturing sector, which has been weakening over time, widening the gap between them. Other studies show that between the years 1995–2004, productivity growth in China has grown faster than the average labor compensation (Chen, Wu, & van Ark, 2009), although with regional differences. Li, Li, Wu, and Xiong (2012) concluded that, since the late 1990s, wages are increasing faster than labor productivity in China. The labor mismatch between industries is associated with a productivity increase of 41% in China (Yian, 2019). Companies can use R&D and human capital to boost the effect of brand equity on firm profitability, while this impact is negligible for non-state and service companies (He, Guaita-Martínez, & Botella-Carrubi, 2019).
Other studies have also focused on analysing the role of bargaining power in the relationship between productivity and wages. López-Villavicencio and Silva (2011) analyzed a macroeconomic panel of OECD countries and obtained different results depending on whether the workers were permanent or temporary, depending on their bargaining power. Elgin and Kuzubaş (2013) also observed links between the wage gap and the bargaining power between companies and workers in the labor market. Zavodny (1999) showed that the effect of the drop in the syndication rate on the efficiency wage is slight. Rath (2006) and Millea (2002) considered the importance of workers’ unions in the context of wage productivity, while Yildirm (2015) showed that lower bargaining power and structural problems explain the lack of a relationship between productivity and real wages in the Turkish manufacturing industry. Budd, Chi, Wang, and Xie (2014) and Besley and Burgess (2002) confirmed that there is no relationship between union association and the salary level, but it is positively related to productivity.
Following previous research, in this paper we propose to use state-of-the art, robust econometric modeling techniques based on long memory to offer evidence and answers with regard to decoupling in China from 1952 to 2018.
The great decoupling in China 1952–2018We use different data sources to compute labor productivity and wages/hourly compensation in China over 1952–2018. To measure labor productivity per worker and per hour, we use national accounts from the National Bureau of Statistics of China (NBS). The data on the total number of hours worked within the economy (since the NBS data is not available for the period prior to 1980) is provided by The Conference Board Total Economy Database (TED – adjusted version), March 2019. Since contractual employment as a % of total employment in China is about 50%, a working hour is a more appropriate measure for labor input in relation to total workers (employed persons). However, since the decoupling studies usually use GDP per worker as a productivity measure, we use both GDP per worker and GDP per hour to measure labor productivity in China.
The total wage bill is defined by the NBS as pre-tax wages, including room charges, utility bills, housing funds, and social insurance paid or withheld by employees. Total wage bills of staff and workers are collected and compiled through The Reporting Form System on Labor Wage Statistics, The National Monthly Sample Survey System on Labor Force, and The System of Rural Social and Economic Surveys by the Department of Population and Employment Statistics (for details on methodology calculation and collection see the NBS). Unfortunately for our analysis, there are various measures which we cannot use to study the decoupling phenomena in China, such as worker compensation or labor costs, as defined by the U.S. Bureau of labor statistics (BLS) or comparable national/international statistical agencies. The NBS uses total and average wages defined as basic payment to workers in between workers’ compensation and labor costs as defined by the BLS.
Average (mean) wage, as defined by the NBS, refers to the average per capita wage in money terms during a certain period of time for employed persons. It shows the general level of wage income of staff and workers during a certain period of time, one major indicator with which to reflect the wage level. It is calculated as average wage=total wage bill of employed persons at reference time/averaged number of persons employed at the reference time. Average (mean) wage per person employed and average hourly wage=total wage bill of employed persons at reference time/total annual hours worked (in millions of hours worked) are measures that we use to study the decoupling in China. For the purpose of testing our results by using a different measure for labor remuneration, we use worker compensation as the best fit to study the decoupling. We use data from Liu and Jiang (2018) on labor compensation share in GDP to calculate hourly labor compensation (wages+social security+employer's payroll tax, health benefits) in China 1952–2017. We compute labor productivity using (volume measure of output) gross domestic product (GDP) and gross value added (GVA) measured at market prices and deflated by the GDP deflator.
Trends in compensation and wages in China 1952–2018In Fig. 1, we see the growth of the wage and labor compensation series in China from 1952 to 2018. Mean wage and labor compensation series (Fig. 1A) are deflated using the GDP deflator and expressed in different units; per employed person (including employees and self-employed), per urban/rural employed, per self-employed, per urban/rural self-employed. Hourly labor compensation shares the same trend with wages but on a lower scale (slower growth of labor compensation). While real wages increase seems to follow labor productivity growth (as expected in theory), labor compensation did not, with employees’ in-kind transfers and subsidies lagging wage growth to the real mean annual and hourly wages during the period 1952–2018. Hourly labor compensation shares the same trend with wages but on a lower scale (slower growth of labor compensation growth.

Wage dynamics are quite different depending on the sector, area, and ownership, as we can see in Fig. 1B. Mean real annual wage growth for rural employed persons registers the highest increase, a 4.8-fold increase in relation to the base wage. When compared to the real wage increase for urban employed persons (with a 2.8-fold increase from base wage), we observe that real wages in rural areas increased 1.3 times more in relation to the urban area wage growth. Considering that the largest share of the employed population until 2014 was employed in rural areas (after 2014 the number of employed persons in urban areas surpassed the ones in rural areas), we see that policymakers strongly relied on agriculture as a source of growth. Large production and output value in the primary sector provided Chinese policymakers with sufficient funds for economic restructuring in favor of secondary and later tertiary sectors. From Fig. 1B, we see that the type of firms’ ownership did not have a significant impact on real wages since real wages in CO (collective owned firms) and SO (state-owned firms’) closely share the same dynamics.
Fig. 2 considers eight series of real mean annual wages by sectors and type of deflator used in China over the observed period. This is important, not only to observe the wage dynamics in different sectors but mostly to compare the dynamics of the wage series deflated by a different type of deflator (GDP and CPI deflators). Opponents to the great decoupling theory bring up the very same argument that real wage dynamics can be biased depending on the type of deflators. When we compare the two figures (Fig. 2A and B), we see that this argument does hold for China at least, but to a limited extent (10 percentage points difference on average). We observe that the wage series deflated by the GDP deflator grew faster (9–10 percentage points) in relation to the wage series deflated by the CPI deflator. Critics of the great decoupling see the phenomena arising from the differences in the GDP (producer wages) and consumer price index deflator (consumer wages) see (Pessoa & Van Reenen, 2013). Feldstein (2008) argues that CPI tends to overestimate inflation; therefore, measures of productivity and wages should be adjusted for inflation using the same price index. This is what we have done in this study to eliminate possible bias due to differences in the price indexes. Wage growth calculated using CPI deflator is lower by 9–10 percentage points in relation to the wage growth registered using the GDP deflator. The argument for a possible bias in measuring the great decoupling is true if we compare the dynamics between real wage deflated by GDP or CPI deflators. We see from Fig. 1A and 1B that they have different dynamics, CPI deflated wages grew slower in relation to GDP deflated wages. However, using different price indexes does not affect the wage dynamics between the sectors. Because of the different dynamics in the GDP and CPI deflated wages, we use productivity series deflated by the GDP deflator and wage series deflated by the same GDP deflator we use for the productivity series in order to avoid any possible price index bias. We observe that the highest real wage growth is achieved in the tertiary sector (using both GDP and CPI deflators), followed by mean annual wage growth. Wage growth in the secondary sectors followed the growth of the real mean annual wage with real wage in the primary sector lagging behind the secondary sector by 31% and 68% in relation to the tertiary sector closely. Next, we examine the trends between productivity and wage growth in China in the search for the wage gap (decoupling).
Labor productivity trends in China 1952–2018
Fig. 3 shows labor productivity in China using GNI (Gross National Income) and GDP (Gross Domestic Product) per worker or hours unit from 1952 to 2018. All three indices of labor productivity share the same dynamics (see Fig. 3).

From Fig. 3, we observe that labor productivity increases by a multiple of 3.7 using GNI/Worker as a measure of labor productivity, 3.71 times using GDP/Worker, and 4.0 using GDP/Hours worked. Labor productivity per hour worked has grown more rapidly in relation to GNI/Worker and GDP/Worker. This is because part-time employment in China is not inherent in the economic system, and contractual employment, which is amounts to 50% of the total employment, involves full working hours. Significant labor productivity growth is behind the Chinese economic growth miracle, along with total factor productivity growth, employment growth, globalization, and investments. Comparing the wage growth with the labor productivity growth in China over 1952–2018, we can study the possible existence of the gross or net decoupling.
Gross/net decoupling in China: what the data tell us?Gross/net decoupling is present in China but is highly influenced by: (1) the statistical bias (CPI versus GDP deflator), (2) units of measurement (workers versus hours worked), and (3) labor remuneration (real mean wage versus real mean compensation). First, we study the impact of deflator (GDP/CPI) discrepancies on the net decoupling (see Fig. 4).
Impact of inflation measurement (divergence between GDP and CPI deflators) on the net decoupling
We notice in Fig. 4 that a net decoupling is present in China, and this is quite significant when we compare the cumulative growth of the mean worker's wage and labor productivity (per worker/h). During the period 1952–2018 labor productivity per worker increased 371%, labor productivity per hour 403%, and actual mean worker's wages 305%. Data (Fig. 4A) show that a (cumulative) net decoupling between worker's wage and productivity amounted to 66% in relation to labor productivity per worker and 98% for labor productivity per hour when we use the GDP deflator to correct for the change in prices. Fig. 4B shows the same dynamics but now using the CPI deflator for inflation correction. When we use a CPI deflator, net decoupling between worker's wages and labor productivity per worker is even larger. Cumulative growth of worker's real mean wage during 1952–2018 was 296% in relation to (cumulative) labor productivity per worker growth of 371% and labor productivity per hour 403%. Net decoupling between worker's real wage growth and labor productivity per worker is 75% and 107% when using labor productivity per hour. Contribution to the net decoupling due to the divergence between two measures of inflation (GDP and CPI deflator) is 9%. We can conclude that contribution to the net decoupling resulting from using different measures of inflation for China is just 9%. Therefore, divergence in the two measures of inflation in China is not significant to explain the net decoupling.
Impact of labor productivity measurement (workers versus hours worked) on the net decouplingUsing different labor productivity measures, GDP per worker/h, GNI (Gross National Income), or GVA (Gross Value Added) do not have a significant impact on the net decoupling.
Measures of labor productivity using different volume indexes do not change the decoupling dynamics since all measures (volume indexes) show similar behavior (see Fig. 5).
Impact of labor compensation (per worker/h) on net decoupling. Source: Authors’ calculation.")
Growth in labor compensation (the difference between wage growth and labor compensation per worker/h) contributes significantly to net decoupling. In fact, there is a large divergence between real mean wage growth per worker and real wage per hour worked. Growth in real hourly wage significantly surpasses real mean annual wage growth. That fact, however, can lead to a biased conclusion on the decoupling phenomena. Namely, the strongest growth in labor productivity in China over the observed period was in the primary and secondary sectors. That is traditionally more labor-intensive sectors in relation to the tertiary sector, and valued-added is a direct result of hours worked and not past labor results (embodied capital). Since more than 57.5% of the Chinese GDP is generated in the tertiary sector, a large increase in the workers’ wages per hour could be misleading, resulting from statistical bias (value-added incorporated in the past labor and not actual (today) productivity. The divergence between the two, wage per worker and wage per hour has a significant contribution to net decoupling (see Fig. 6A).
. Source: Authors’ calculation.")
Fig. 6B and C shows the divergence in using data on real wage growth per worker and per hour due to the embodied capital issue in the service sector. Looking at Fig. 6B, we see that the net decoupling between labor productivity and real wage in 1990 was quite significant (decoupling=62%). In 1990, accumulated growth in labor productivity per worker was 145.6%, while real wage growth per worker was 83.6, with a net decoupling of 62%. When looking at Fig. 6C, we see that the net decoupling in the same 1990 year was not only significant but even turns to negative when we use labor productivity and wage growth per hour. In 1990, accumulated growth in labor productivity per hour was 153.9% and real wage growth per hour of 198%, resulting in negative net decoupling (wage growth exceeds labor productivity growth) of −44.1%. The results here show there is a net decoupling between labor productivity and wages in China when we use data on labor productivity and wages per worker. However, when we use data on labor productivity and wages per hour worked, negative net decoupling is present in China. This could be a misleading result resulting from statistical bias in the data and should be taken with caution.
Another problem when measuring net decoupling is the issue of measuring labor remuneration using real wages or labor compensation. Since labor compensation includes in-kind and other transfers paid by the employer/state, it is expected that the net decoupling will be negligible if we use labor compensation instead of wages. Fig. 7 shows that, indeed, this is the case in China.
. Source: Authors’ calculation.")
From Fig. 7A, we see that net decoupling is not present when using labor productivity and real labor compensation per worker (labor compensation reflects the growth in labor productivity, and there is no net decoupling. However, when we use data on real mean annual wage per worker growth and labor productivity per worker growth, there is a visible net decoupling presence. Similar behavior is visible in Fig. 7B. There is significant negative net decoupling in China when comparing real labor compensation with labor productivity per hour worked. When comparing real wage per hour worked growth with labor productivity per hour worked, we observe positive net decoupling, not substantial in level (because we use data on wages and labor productivity per hour worked).
Data and methodologyTo study the decoupling phenomenon in China, we use quarterly data from 1992 to 2018 from the National Bureau of Statistics of China and other relevant studies on labor productivity growth in China. Variable definitions are as follows:
- •
(NGDP)=Net decoupling (quarterly, in percent) is the difference in the growth of GDP per hour worked deflated by the GDP deflator and average real wage/compensation deflated by the same index,
- •
(TFP)=Growth of total factor productivity (quarterly, in percent), growth accounting and total factor productivity, 1990–2018 (converted to quarterly using LIterman Eviews procedure),
- •
(ICT)=Contribution of capital services provided by ICT assets to GDP growth, growth accounting, and total factor productivity, 1990–2018, converted to quarterly using LIterman Eviews,
- •
(FDI)=Foreign direct investment, net inflows (quarterly, BoP, current US$), International Monetary Fund, Balance of Payments database, supplemented by data from the United Nations Conference on Trade and Development and official national sources (converted to quarterly by LIterman Eviews procedure),
- •
The compensation of employees refers to the total payment of various forms to employees for the productive activities they are engaged in. It includes wages, bonuses, and allowances, which the employees earn in cash or in kind. It also includes the free medical services provided to the employees and the medical expenses, transport subsidies and social insurance, and housing funds paid by the employers,
- •
(RGFCP)=Real gross fixed capital formation expressed in billions (quarterly), deflated by the price index for gross fixed capital formation, Chang, Chen, Waggoner, and Zha (2016),
- •
(SHARE)=Share of the contributions of the tertiary industry to the increase of the GDP, (quarterly, in percent), National Bureau of Statistics of China,
- •
(LSH)=Labor income as a share of total value added (quarterly, in percent).
Data sources we use in the study:
- •
National Bureau of Statistics of China online database, http://data.stats.gov.cn/english/easyquery.htm?cn=B01,
- •
The Conference Board Total Economy Database, Growth Accounting, and Total Factor Productivity, 1990–2018, https://www.conference-board.org/data/economydatabase/index.cfm?id=27762,
- •
Chang et al. (2016). “Trends and Cycles in China's Macroeconomy,” NBER Macroeconomics Annual, University of Chicago Press, vol. 30(1), pages 1–84,
- •
IMF Balance of payment and international investment position statistics database (BOP/IIP), https://data.imf.org/?sk=7A51304B-6426-40C0-83DD-CA473CA1FD52,
- •
Liu, J., & Jiang, Z. (2018). The synergy theory on economic growth: Comparative study between China and developed countries. In The Synergy Theory on Economic Growth: Comparative Study Between China and Developed Countries. https://doi.org/10.1007/978-981-13-1885-6.
Dealing with the methodology, we use techniques based on fractional integration, which implies that the order of integration of a given time series may not necessarily be 0 or 1 but any real value, including thus fractional values. This allows for a greater degree of flexibility in the dynamic specification of the model and at the same time, by looking at the value of the differencing parameter (d) we can determine not only the degree of persistence in the data (the higher the value of d is, the higher the degree of persistence is) but also if shocks will have transitory or permanent effects depending on whether d is smaller than 1 (transitory shocks) or equal to or higher than 1 (permanent shocks).
We apply this methodology to the individual series but also to the errors in the regression model of NGDP against the rest of the variables, then jointly estimate the regression coefficients along with the potentially fractional differencing parameter.
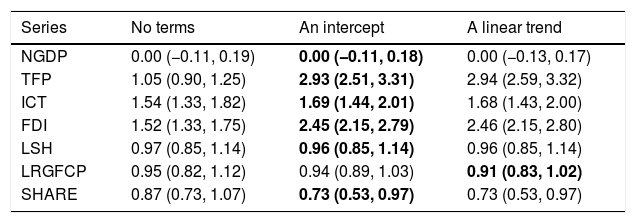
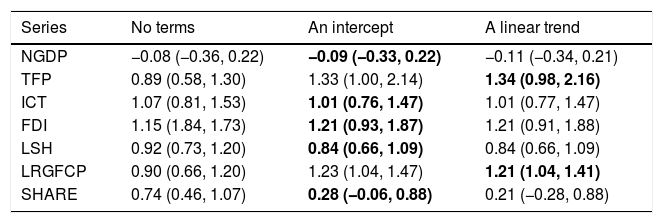
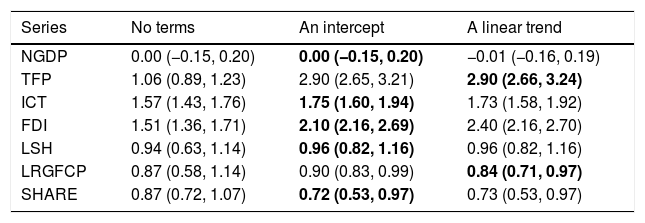
ResultsThe results show real wages are lagging behind labor productivity growth in China in the period 1952–2018. Firstly, we estimate the order of integration for each individual series under three different assumptions on the error term: white noise (see Table 1), autocorrelated with Bloomfield (see Table 2), and with a seasonal monthly AR(1) model (in Table 3). Moreover, in the three cases, we consider three potential set-ups: in the first one (column 2 in the tables) we do not consider any deterministic term in the description of the data; in the second case, we allow for a constant (intercept), while in the third case we include a constant and a linear time trend. This is standard in the unit root parameterization (see, Bhargava, 1986; Schmidt & Phillips, 1992; etc.). The values marked in bold in the tables refer to the selected specifications according to these deterministic components, and they are based on the t-values of the estimated coefficients in the d-differenced series.
Estimates of d under the assumption of white noise error.
| Series | No terms | An intercept | A linear trend |
|---|---|---|---|
| NGDP | 0.00 (−0.11, 0.19) | 0.00 (−0.11, 0.18) | 0.00 (−0.13, 0.17) |
| TFP | 1.05 (0.90, 1.25) | 2.93 (2.51, 3.31) | 2.94 (2.59, 3.32) |
| ICT | 1.54 (1.33, 1.82) | 1.69 (1.44, 2.01) | 1.68 (1.43, 2.00) |
| FDI | 1.52 (1.33, 1.75) | 2.45 (2.15, 2.79) | 2.46 (2.15, 2.80) |
| LSH | 0.97 (0.85, 1.14) | 0.96 (0.85, 1.14) | 0.96 (0.85, 1.14) |
| LRGFCP | 0.95 (0.82, 1.12) | 0.94 (0.89, 1.03) | 0.91 (0.83, 1.02) |
| SHARE | 0.87 (0.73, 1.07) | 0.73 (0.53, 0.97) | 0.73 (0.53, 0.97) |
Source: Authors’ calculation.
Estimates of d under the assumption of autocorrelated Bloomfield errors.
| Series | No terms | An intercept | A linear trend |
|---|---|---|---|
| NGDP | −0.08 (−0.36, 0.22) | −0.09 (−0.33, 0.22) | −0.11 (−0.34, 0.21) |
| TFP | 0.89 (0.58, 1.30) | 1.33 (1.00, 2.14) | 1.34 (0.98, 2.16) |
| ICT | 1.07 (0.81, 1.53) | 1.01 (0.76, 1.47) | 1.01 (0.77, 1.47) |
| FDI | 1.15 (1.84, 1.73) | 1.21 (0.93, 1.87) | 1.21 (0.91, 1.88) |
| LSH | 0.92 (0.73, 1.20) | 0.84 (0.66, 1.09) | 0.84 (0.66, 1.09) |
| LRGFCP | 0.90 (0.66, 1.20) | 1.23 (1.04, 1.47) | 1.21 (1.04, 1.41) |
| SHARE | 0.74 (0.46, 1.07) | 0.28 (−0.06, 0.88) | 0.21 (−0.28, 0.88) |
Source: Authors’ calculation.
Estimates of d under the assumption of seasonal MA(1) errors.
| Series | No terms | An intercept | A linear trend |
|---|---|---|---|
| NGDP | 0.00 (−0.15, 0.20) | 0.00 (−0.15, 0.20) | −0.01 (−0.16, 0.19) |
| TFP | 1.06 (0.89, 1.23) | 2.90 (2.65, 3.21) | 2.90 (2.66, 3.24) |
| ICT | 1.57 (1.43, 1.76) | 1.75 (1.60, 1.94) | 1.73 (1.58, 1.92) |
| FDI | 1.51 (1.36, 1.71) | 2.10 (2.16, 2.69) | 2.40 (2.16, 2.70) |
| LSH | 0.94 (0.63, 1.14) | 0.96 (0.82, 1.16) | 0.96 (0.82, 1.16) |
| LRGFCP | 0.87 (0.58, 1.14) | 0.90 (0.83, 0.99) | 0.84 (0.71, 0.97) |
| SHARE | 0.87 (0.72, 1.07) | 0.72 (0.53, 0.97) | 0.73 (0.53, 0.97) |
Source: Authors’ calculation.
The results are similar across the three tables but very heterogeneous across the variables. Thus, the only evidence of short memory (or d=0) is obtained for NGDP (in the three cases) and SHARE (with Bloomfield disturbances). LRGF displays values of d in the interval (0,1) under white noise and seasonal monthly AR(1) errors. The other series display higher degrees of persistence with values of d equal to 1 or higher than 1 in all cases, with the values for TFP and FDI being especially large under the assumptions of white noise and MA errors. Thus, the main result here is the large degree of heterogeneity in the degree of persistence of the variables.
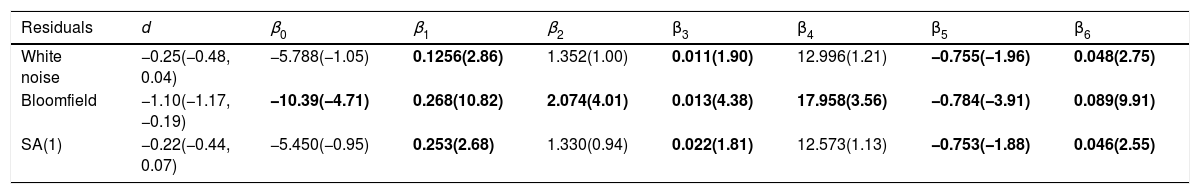
Next, we run a regression of NGDP(t) against a constant and the rest of the variables: TFP(t-k), ICT(t-k), FDI(t-k), LSH(t-k), LRGFCP (t-k) and SHARE(t-k), with k=0 (in Table 4) and k=1 (in Table 5).
Estimated coefficients in a regression model with actual regressors.
| Residuals | d | β0 | β1 | β2 | β3 | β4 | β5 | β6 |
|---|---|---|---|---|---|---|---|---|
| White noise | −0.25(−0.48, 0.04) | −5.788(−1.05) | 0.1256(2.86) | 1.352(1.00) | 0.011(1.90) | 12.996(1.21) | −0.755(−1.96) | 0.048(2.75) |
| Bloomfield | −1.10(−1.17, −0.19) | −10.39(−4.71) | 0.268(10.82) | 2.074(4.01) | 0.013(4.38) | 17.958(3.56) | −0.784(−3.91) | 0.089(9.91) |
| SA(1) | −0.22(−0.44, 0.07) | −5.450(−0.95) | 0.253(2.68) | 1.330(0.94) | 0.022(1.81) | 12.573(1.13) | −0.753(−1.88) | 0.046(2.55) |
Source: Authors’ calculation.
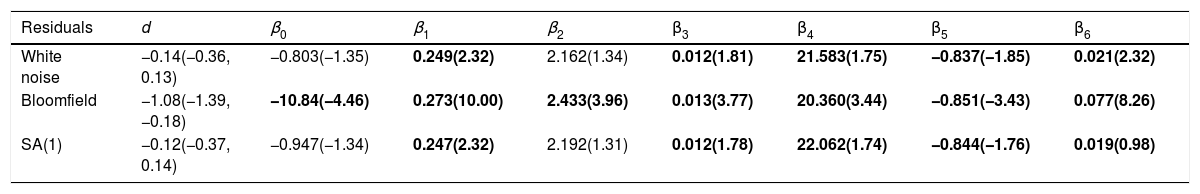
Estimated coefficients in a regression model with lagged regressors.
| Residuals | d | β0 | β1 | β2 | β3 | β4 | β5 | β6 |
|---|---|---|---|---|---|---|---|---|
| White noise | −0.14(−0.36, 0.13) | −0.803(−1.35) | 0.249(2.32) | 2.162(1.34) | 0.012(1.81) | 21.583(1.75) | −0.837(−1.85) | 0.021(2.32) |
| Bloomfield | −1.08(−1.39, −0.18) | −10.84(−4.46) | 0.273(10.00) | 2.433(3.96) | 0.013(3.77) | 20.360(3.44) | −0.851(−3.43) | 0.077(8.26) |
| SA(1) | −0.12(−0.37, 0.14) | −0.947(−1.34) | 0.247(2.32) | 2.192(1.31) | 0.012(1.78) | 22.062(1.74) | −0.844(−1.76) | 0.019(0.98) |
Source: Authors’ calculation.
We observe in these two tables (Tables 4 and 5) that for the cases of white noise and seasonal errors, the significant coefficients correspond to (TFP), (ICT), (FDI), (LRGFCP) and (SHARE). However, allowing for autocorrelated (Bloomfield) disturbances, all the variables become significant now (LSH included). If we permit lagged regressors (with k=1, which is a more realistic assumption for exogenous regressors),1 the results are similar, but LSH now becomes significant also.
We briefly discuss now the optimized model results (which are those based on Bloomfield) from Table 5. The first noteworthy fact is that the estimated value of d is −1.08, being significantly negative and indicating thus anti-persistence. Based on that, we next interpret the regression coefficients.
We observe a one percentage point rise in total factor productivity growth (TFP) causes a 0.27 percentage point increase in the net decoupling (NGDP). The result suggests a statistically significant link with both total factor productivity and net decoupling but does not favor the one-for-one strong coupling hypothesis. Our result supports the productivity-pay divergence thesis (moderate decoupling) in China. Total factor productivity growth does not automatically ‘trickle-down’ equally to the workers resulting in unequal workers’ wage/compensation growth (holding other variables fixed). Ultimately, net decoupling in China follows a moderate divergence path between real mean wage/compensation growth and total productivity growth (elasticity coefficient 0.27).
A one percentage point increase in ICT – contribution of capital services provided by ICT assets to GDP growth, results in a 2.433 percentage point increase in net decoupling in China. Labor productivity in China is affected by a change in ICT through a change in labor quality, technological development embedded in a capital asset, and multifactor productivity growth. ICT development boost labor productivity by an increase in multifactor productivity. The expected increase in the labor compensation following ICT contribution to labor productivity growth is offset by the downward pressure on wages (automation and AI human labor substitution). As we can see from our results for China, raising the ICT contribution to GDP growth by one percentage point (through a multifactor productivity rise) contributes to the increase in the productivity-compensation decoupling by a large 2.433 percentage points. Since ICT requires high-skilled labor to drive labor compensation upwards in those sectors, which leads to rising labor income inequality and crowding out middle-skilled workers (job polarization and automatization). A decrease in the demand for middle-skill jobs decreases labor compensation resulting in the net decoupling increase.
Regression results for the impact of FDI on net decoupling support the above conclusion. We see from Table 5 that a unit increase in the FDI drives net decoupling up by 0.013 percentage points. We can think of FDI as a proxy for the impact of globalization on net decoupling. ICT encourages economic globalization resulting in skill-biased technical change and labor income (wage) inequality and, finally, an increase in the net decoupling.
Change in the labor share has a significant and large impact on productivity- compensation divergence. For a one percentage point increase in the labor share (LSH), the net decoupling rises by 20.360 percentage points. The estimated coefficient (see Table 5) from the period 1992–2018 implies that a one percentage point increase in the labor share of the total value added in China was associated with a considerable 20.360 percentage point upswing in net decoupling. Our results show evidence for China which supports the innovation-based theories of rising income inequality, showing a positive and significant coefficient on the change in labor share in the net decoupling regression. The divergence in labor productivity-compensation is not caused by declining labor share (as for example in Norway, the UK, France, Sweden, Italy, Spain). The share of labor compensation in GDP for China in 1952 was 59% compared to 58% in 2018. Boom-bust episodes (such as the crisis of 2008) cause a considerable rise in net decoupling as the one experienced in China. During the financial crisis of 2008, the labor share dropped to 54%, accompanied by a large increase in net decoupling (almost sixfold). After the crisis, labor share returned to its pre-crisis levels, followed by a decline in the productivity-compensation divergence.
Regression results for the real gross fixed capital formation (LRGFCP) endorse the results of the model regression for the above variables. The importance of the innovation-based growth in China for the productivity-compensation dynamics is clear from the LRGFCP coefficient estimation. For a one percentage point increase in the LRGFCP, net decoupling falls by −0.851 percentage points. The estimated coefficient (see Table 5) from the period 1992–2018 implies that a one percentage point increase in the real gross fixed capital formation in China was associated with a high -0.851 percentage point decline in net decoupling. The tertiary sector in China (service industry) contributes by a significant 60% to the increase in the GDP with a share of 45% in total employment. In 2018, foreign direct investment (FDI) accounted for 68.1% of China's overall FDI. Since 2/3 of the total FDI is earmarked for investments in the service industry, it is not surprising that a change is this industry strongly impacts net decoupling. As cross-firm wage dispersion within the industry has not yet reached the frontier, capital deepening in China is not accompanied by the declining labor share.
Overall results supporting innovation-based changes behind net decoupling in China are once again validated by regression results for the SHARE variable (share of the contributions of the tertiary industry to the increase of the GDP). The estimated coefficient (statistically significant) for SHARE is 0.077 showing that with a one percentage point increase in the contribution of the tertiary industry (service industry) to the GDP, net decoupling rises by 0.077-percentage points.
In accordance with the great decoupling critics (Feldstein, 2008), due to growing fringe benefits and other non-cash payments, wage levels have not gone up as rapidly as total compensation. Hence, it is empirically correct to compare the increase in productivity with the increase of total compensation rather than the increase of just wages. In the case of China, this thesis holds (to some extent) since labor compensation growth was considerably higher compared to real wage growth. Still, there are important divergences depending on the indicators we use in the analysis. Comparing labor productivity to labor compensation growth using per worker measures shows a relatively small positive net decoupling. However, when we measure labor productivity and labor compensation per hour worked, we find evidence of significant negative net decoupling (labor compensation growing faster to increase in labor productivity). We can conclude yet another (new and original) important fact in measuring the great decoupling – is the type of indicator we use in the study (per worker or per hour worked).
The second estimation problem is how nominal output and nominal compensation are converted to real values before comparison. While any consistent deflation of the two series of nominal values will show similar productivity and compensation movements, it is ambiguous to be using two different deflators, one for measuring productivity and the other for measuring real compensation (Feldstein, 2008). This thesis does not hold for China according to our results. When we measure real wages converted using CPI or GDP deflator, we get similar results in the net decoupling dynamics. Net decoupling is slightly lower when we compare real wages deflated by CPI to the labor productivity deflated by GDP deflator. Nevertheless, the difference is not so significant compared to the net decoupling figures we obtain comparing real wages deflated by the GDP deflator (as we do to convert to real GDP figures). Concluding, the net decoupling dynamics in China over the observed period is not affected by the type of deflators (CPI or GDP) we use to convert nominal wages and productivity to real values.
ConclusionsThis study investigates the ‘great decoupling’ phenomena in China from 1952 to 2018 using long memory I(d) models. To the best of our knowledge it is the first study to research the labor productivity and compensation divergence in China using large time-series data and long-memory models. Our study also brings new light on the internationally open debate that exists over the ‘great decoupling’ phenomena, or myth as termed by some researchers. China is a perfect case to study decoupling providing the opportunity to study it in different economic regimes – command and mixed market. Examining the impact of different economic policy regimes on decoupling gives us the opportunity to isolate a sizable sample of statistically significant determinants. Another important argument for choosing China is that by studying the world's leading economy (frontier economy), we can get a deeper insight into the mechanism behind the phenomena on an international scale.
The main theories which attempt to explain the productivity-compensation divergence (decoupling) are: innovation-based, globalization, shift to knowledge capital, ‘supercycles and boom-bust,’ ‘superstars,’ declining labor share and increasing wage inequality.
Time series data for China from 1952 to 2018 show a diverging trend between labor productivity and labor compensation. First, we test the hypothesis that decoupling between labor productivity and compensation growth is an empirical fact and not a ‘myth’ (statistical or other types). Our study results offer robust proof for the existence of decoupling in China. From 1952 to 2018, we measure the decoupling average annual growth rate of 0.93% (using per hour worked data). Productivity-compensation per worker divergence follows the average annual growth rate of 1.52%.
Using fractional integration, we search for and test decoupling determinants and linked theories. We observe that a one percentage point rise in total factor productivity growth (TFP) is followed by a 0.27 percentage point increase in net decoupling (NGDP). The result suggests a statistically significant link between total factor productivity and net decoupling. Total factor productivity growth with embedded technical change causes net decoupling in China to rise, supporting the innovation and knowledge-based theory. The results of measuring the globalization impact (proxied by FDI) on net decoupling in China reveal that a unit increase in the (FDI) drives net decoupling up by 0.013 percentage points. The main driver of modern globalization in the form of ICT in China contributes to the increase in the productivity-compensation decoupling by a significant 2.433 percentage points. Test results on the impact of ICT on net decoupling for China support the globalization theory (Bivens & Mishel, 2015) since firms can hire workers while offering lower salaries (weakened worker bargaining power).
The change in the labor share has a significant and large impact on productivity- compensation divergence (labor share theory). In a number of OECD countries, decoupling mirrors declines in labor shares but China differs in this respect from Norway, Spain, UK, France, Sweden and Italy. The estimated coefficient implies that a one percentage point increase in the labor share in the total value added in China was associated with a 20.36 percentage point upswing in net decoupling. Boom-bust episodes (as the crisis of 2008) cause a considerable rise in net decoupling as experienced in China. During the financial crisis of 2008, the labor share dropped to 54%, accompanied by a large increase in net decoupling (almost sixfold). After the crisis, the labor share returned to its pre-crisis levels, followed by a decline in the productivity-compensation divergence. Innovation-based growth in China is important for decoupling. For a one percentage point increase in the real gross fixed capital formation (LRGFCP), net decoupling falls by −0.851 percentage points. Because cross-firm wage dispersion within the service industry has not yet reached the frontier, capital deepening in China is not accompanied by the declining labor share. Regression results for the share of the contributions of the tertiary industry to the increase of the GDP show a one percentage point increase in the tertiary industry (service industry) contribution to the GDP increases productivity-compensation divergence by 0.077-percentage points. Demand for highly skilled labor reduces capital-labor substitution in the service industry (accounting for 60% of the GDP) thereby driving up high-skilled labor wages, increasing wage inequality and widening decoupling (wage inequality theory). This is backed up with empirical evidence on strongly rising income inequality in China from 1952 to 2018, with the GINI index rising by 1.05% annually. Labor productivity growth in ‘superstars’ (such as Huawei, driven by innovation, R&D and massive capital investment) notably exceeds real wage growth, intensifying the decoupling.
From a unique perspective on China's decoupling issue, the test results enable us to set a new hypothesis for China: the divergence between labor productivity and compensation is higher under classical growth models and planned market economies. Innovation-based growth models and free market adoption in China caused a decline in decoupling. Thus, labor compensation and wages closely follow labor productivity growth if economic growth is driven by technology advancement and free-market rules. Empirical test results presented in this study support such a hypothesis.
Studying decoupling issues in China can help future researchers to understand better the nature of decoupling in other countries. The divergence between productivity and worker's pay in China is far from the threshold of presenting a real economic problem. However, decoupling is a fact for China, and if policymakers, managers, and academics do not take it seriously in the future, it will present a significant headwind against China's future economic growth. Our study is limited by the data availability in the selection of variables and level (macro). Better results would be obtained using disaggregate data on regions and firms in China. Future research on the decoupling issue using disaggregating data would improve empirical evidence and scientific conclusions on the matter.
We are grateful to two anonymous reviewers and their suggestions to improve the paper as well the editor in chief for advices and very useful comments resulting in an improved version of the paper.
This exogeneity condition is a requirement for the specification in Robinson (1994) which is the methodology used in this work.