
Hospital readmissions are a major concern in terms of both cost and quality of care. The purpose of this study was to determine which patients were more likely to experience hospital readmissions after acute myocardial infarction in order to help develop more targeted programs and policies.
Patients and materials and methodsThe 2014 Nationwide Readmissions Database was used to calculate the national readmission rate by patient characteristics. All U.S. patients who presented to the hospital with acute myocardial infarction in 2014 and incurred a readmission were included in this analysis. The main outcome of interest was the rate of readmission by obesity. Obesity was measured using the comorbidity indicator found in the dataset. National secondary data of a sample of U.S. hospital discharges was used to measure hospital readmission rates. Bivariate analysis and logistic regression were used to determine if a significant relationship existed between readmissions and the patient characteristics. For this purpose odds ratio (OR) and 95% confidence interval has been calculated.
ResultsThere were 11.66% hospital readmissions in the database. Non-obese adults were 21% less likely to be readmitted than obese adults. Non-obese patients were 21.2% less likely to be readmitted than obese patients (OR 0.788, CI 0.751–0.827, p-value <.0001). Obese patients with no insurance had significantly higher readmissions compared to obese Medicare patients.
ConclusionsThe Hospital Readmissions Reduction Program has been effective at reducing hospital readmissions. However, greater focus needs to be placed on reducing hospital readmissions for patients with chronic conditions, especially obesity.
Los reingresos hospitalarios son una preocupación mayor en términos de coste y calidad de la atención. El objetivo de este estudio fue determinar qué pacientes tenían más probabilidad de experimentar reingresos tras un infarto de miocardio agudo, a fin de contribuir al desarrollo de programas y políticas más específicos.
Pacientes y materiales y métodosSe utilizó la base de datos de reingresos nacionales de 2014 para calcular la tasa nacional de reingresos por características del paciente. Se incluyó en este análisis a todos los pacientes de EE. UU. que ingresaron en el hospital con infarto de miocardio agudo en 2014, y que reingresaron posteriormente. El resultado de interés principal fue la tasa de reingreso por obesidad, que fue medida utilizando el indicador de comorbilidad encontrado en el conjunto de datos. Se utilizaron los datos secundarios nacionales de una muestra de altas hospitalarias de EE. UU. para medir las tasas de reingreso hospitalario. Se utilizaron análisis bivariante y regresiones logísticas para determinar si existía una relación significativa entre los reingresos y las características del paciente. A tal fin, se calcularon el odds ratio (OR) y el intervalo de confianza (IC) del 95%.
ResultadosEn la base de datos existía un 11,66% de reingresos hospitalarios. Los adultos no obesos tenían un 21% menos de probabilidad de ser reingresados que los adultos obesos. Los pacientes no obesos tenían un 21,2% menos de probabilidad de ser reingresados que los pacientes obesos (OR: 0,788; IC 95%: 0,751-0,827; valor p<0,0001). Los pacientes obesos que carecían de seguro reflejaron una tasa de reingresos significativamente superior, en comparación con los pacientes de Medicare obesos.
ConclusionesEl programa de reducción de reingresos hospitalarios ha reflejado su eficacia a la hora de reducir los reingresos hospitalarios. Sin embargo, debe hacerse mayor hincapié en la reducción de los reingresos hospitalarios de los pacientes con situaciones crónicas, y en especial la obesidad.
Prior to 2012, the average readmission rate in the U.S. was around 19%1 and cost a total of $17 billion.2 According to the Centers for Medicare and Medicaid Services (CMS), a readmission is “an admission to a subsection hospital within 30 days of discharge from the same or another subsection hospital.”3 Readmissions are a major quality of care concern and play a role in the rising cost of health care. As such, the reduction of hospital readmissions is a primary focus of healthcare policy.
One provision of the Affordable Care Act was the Hospital Readmissions Reduction Program (HRRP). Starting in 2012, this program “requires CMS to reduce payments to IPPS [Inpatient Prospective Payment System] hospitals with excess readmissions.”3 The reduction in Medicare reimbursement for excessive readmissions was 3% in 2015.3,4 The policy was created to reduce readmissions related to acute myocardial infarction (AMI), heart failure and pneumonia, and later expanded to include Chronic Obstructive Pulmonary Disease (COPD) and hip and knee arthroplasty.4 The goal of this policy was to improve quality of care by reducing excess readmissions by reducing hospital reimbursements for preventable readmissions.1,4,5 Recent studies have found that the Medicare readmission rates have declined as a result of the HRRP from 19.9% in 2005–20086 to 19–19.5% in 2011 to 18.4% in 20121 and 17.5% in 2013.4 The hypothesis of this study was that readmission rates continued to decline since the 2011 rate of 19% and that obese patients will experience higher readmission rates than non-obese patients.
The purpose of this study was to analyze the rate of hospital readmissions for acute myocardial infarction (AMI) according to patient characteristics. The main patient characteristic of interest was the present of obesity. There is a direct association between obesity and higher mortality rates, as well as an increased risk of other comorbidities.7 Obese patients admitted for AMI had higher mortality rates than normal weight patients.8 Few studies to date have analyzed the effects of obesity on AMI-related readmissions.
MethodsThe 2014 Nationwide Readmissions Database (NRD) was used to calculate the rate of all-cause first readmissions for patients who presented to the hospital with an index admission of AMI. The NRD is a national database that reports data from a subset of the nation's hospitals. The NRD is a database produced by the Healthcare Cost and Utilization Project (HCUP), sponsored by the Agency for Healthcare Research and Quality.9
Studied variablesThe NRD collects patient-level data on first and subsequent readmissions. Only the first hospital readmission for an index admission of AMI was calculated, and all secondary and tertiary readmissions were eliminated to avoid an unhealthy patient skewing the data. The dependent variable is the rate of 30-day all-cause first readmissions admitted for AMI. Readmission was calculated as the first readmission to the hospital for all-causes divided by all AMI index admissions.
Inclusion and exclusion criteriaTo be included in the analysis, the index admission must had an ICD-9 diagnosis code indicating AMI (410.xx excluding 410.x2 which is a subsequent episode of AMI care),6 admission from January 2014 to November 2014, the admission did not result in death, the patient was over the age of 17, and length of stay was not missing. December 2014 was excluded from the analysis due to the lack of a full 30 days post-discharge to measure potential readmissions. Only adults were included in the analysis, since children do not have the legal authority to make medical decisions and children's hospitals are excluded from the HRRP program.
Studied variablesIn the NRD, length of stay is required to calculate the initial discharge date, which is required to determine if a readmission occurred within 30 days; therefore, if length of stay is missing, readmission with 30 days cannot be accurately calculated. Once the index admission was created, the data was linked to the original discharge data. Any missing data on readmissions was coded as a non-readmission. The chronic condition indicator for obesity in the database was used to identify whether a patient was obese. According to the World Health Organization,10 “a person with a BMI [body mass index] of 30 or more is generally considered obese” (para. 1). The independent variables that were included in this analysis were selected based on Andersen's Behavioral Model: environment, predisposing characteristics, enabling resources, use of health care services, and personal health practices.11
The outcome measure of interest in this study was AMI readmissions. The external environment includes the patient location (metropolitan central area with >=1 million residents, fringe metropolitan area with >=1 million residents, metro area with 250,000–999,999 residents (medium metro), metro area with 50,000–249,999 residents (small metro, micropolitan areas, and rural). The predisposing characteristics include patient age (18–26, 27–44, 45–64, 65–85, 85+) and gender (male, female). The age variable was modeled after CMS age categories.12 The only change made to the age variable in comparison to CMS categories was the division of the category 18–44 into 2 separate categories. This was done to analyze whether the ACA provision of dependents covered to age 26 would affect readmission rates. The enabling resources include primary insurance (Medicare, Medicaid, private, self-pay, other) and median household income based on patient zip code (0-25th percentile, 26–50th percentile, 51–75th percentile, 76–100th percentile). The use of health care services includes number of procedures during hospitalization (0, 1, 2+) and length of stay (0–1 days, 2 days, 3–4 days, 5+ days). Length of stay was calculated using the univariate procedure. Finally, the personal health practices include the chronic condition indicator for obesity. “Comorbidities [e.g., obesity] are identified using ICD-9-CM diagnoses and the Diagnosis Related Group (DRG) in effect on the discharge date.”9 All of the independent variables were included in the analysis because, based on previous research, they have a direct or indirect relationship with patient outcomes.11
Several patient variables were excluded from the analysis. Patients with a readmission for an index admission other than AMI were excluded from further analysis. Furthermore, to reduce the number of voluntary or required readmissions in the calculations, several other variables were excluded, including comorbidity indicators for AIDS, renal failure, tumors, and metastatic cancer, patients who died during hospitalization, and patients under the age of 18.
Statistical analysisSAS 9.4 was used to analyze the data. Bivariate analysis was used to analyze the weighted frequency and percentage of 30-day first hospital readmissions for AMI by patient characteristics and by obesity. Multivariate logistic regression of the survey data was used to analyze the odds of readmission by patient characteristic. Significance was defined as a bilateral p-value of <0.05. This study was approved by the institutional IRB.
Ethical considerationsThere were limited ethical concerns pertaining to this study since the data is publicly-available secondary data, which has been de-identified. No attempt was made to identify the participants in this study. In accordance with the data use agreement, results with fewer than 10 observations were not reported.9
ResultsThe 2014 NRD contained 14,325,172 total observations. After all exclusions, there were 11,188,940 observations remaining in the database. For patients admitted for AMI, there were 371,424 weighted (171,814 unweighted) index admissions. Based on the index admission criteria, there were 43,292 weighted (20,352 unweighted) all-cause first readmissions for AMI. Readmissions were calculated by dividing the number of AMI readmissions by the index admission. Based on this equation, the readmission percentage for all-cause first readmissions of AMI was 11.66%. Of those readmissions, 7172 (16.57%) were among obese patients.
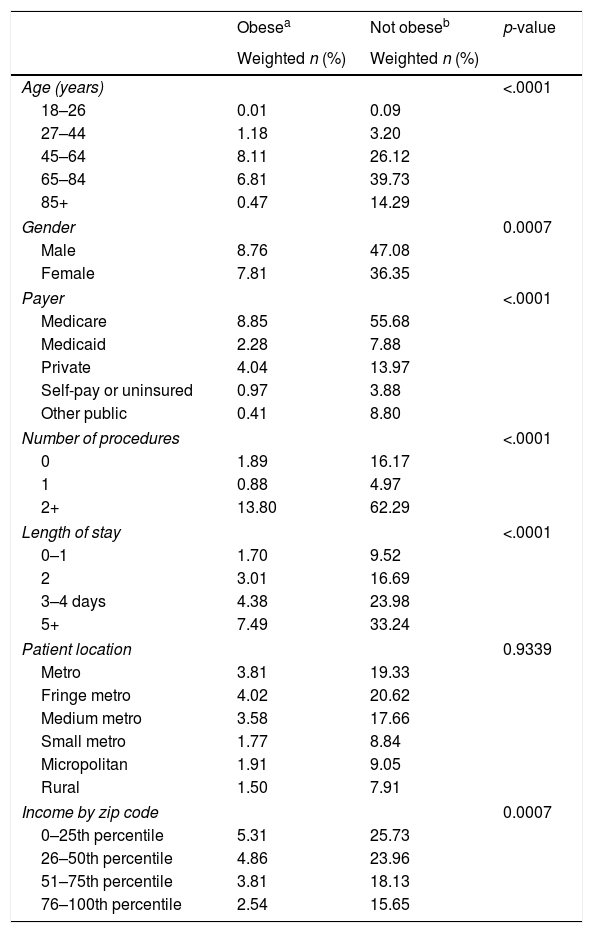
Analysis of AMI all-cause first readmissions by patient characteristics found that patients ages 65–85, males, patients with Medicare as their primary insurer, who resided in a large metropolitan area (center or fringe area), and who had lower median household income experienced higher readmissions than their counterparts. For healthcare utilization variables, patients who incurred two or more procedures during hospitalization and were hospitalized for 5 or more days had higher readmissions than their counterparts. Finally, patients who were not obese experienced higher readmissions compared to patients who were obese, 9.72% and 1.93%, respectively. When analyzing AMI all-cause first readmissions among obese patients (Table 1), results indicate that all trends remained the same as the previous analysis, except that obese adults 45–64 years old experienced higher readmissions than obese adults 65 and older, 8.11% and 6.81%, respectively.
Frequency of all-cause AMI readmissions by patient characteristics according to the presence of obesitya
| Obesea | Not obeseb | p-value | |
|---|---|---|---|
| Weighted n (%) | Weighted n (%) | ||
| Age (years) | <.0001 | ||
| 18–26 | 0.01 | 0.09 | |
| 27–44 | 1.18 | 3.20 | |
| 45–64 | 8.11 | 26.12 | |
| 65–84 | 6.81 | 39.73 | |
| 85+ | 0.47 | 14.29 | |
| Gender | 0.0007 | ||
| Male | 8.76 | 47.08 | |
| Female | 7.81 | 36.35 | |
| Payer | <.0001 | ||
| Medicare | 8.85 | 55.68 | |
| Medicaid | 2.28 | 7.88 | |
| Private | 4.04 | 13.97 | |
| Self-pay or uninsured | 0.97 | 3.88 | |
| Other public | 0.41 | 8.80 | |
| Number of procedures | <.0001 | ||
| 0 | 1.89 | 16.17 | |
| 1 | 0.88 | 4.97 | |
| 2+ | 13.80 | 62.29 | |
| Length of stay | <.0001 | ||
| 0–1 | 1.70 | 9.52 | |
| 2 | 3.01 | 16.69 | |
| 3–4 days | 4.38 | 23.98 | |
| 5+ | 7.49 | 33.24 | |
| Patient location | 0.9339 | ||
| Metro | 3.81 | 19.33 | |
| Fringe metro | 4.02 | 20.62 | |
| Medium metro | 3.58 | 17.66 | |
| Small metro | 1.77 | 8.84 | |
| Micropolitan | 1.91 | 9.05 | |
| Rural | 1.50 | 7.91 | |
| Income by zip code | 0.0007 | ||
| 0–25th percentile | 5.31 | 25.73 | |
| 26–50th percentile | 4.86 | 23.96 | |
| 51–75th percentile | 3.81 | 18.13 | |
| 76–100th percentile | 2.54 | 15.65 | |
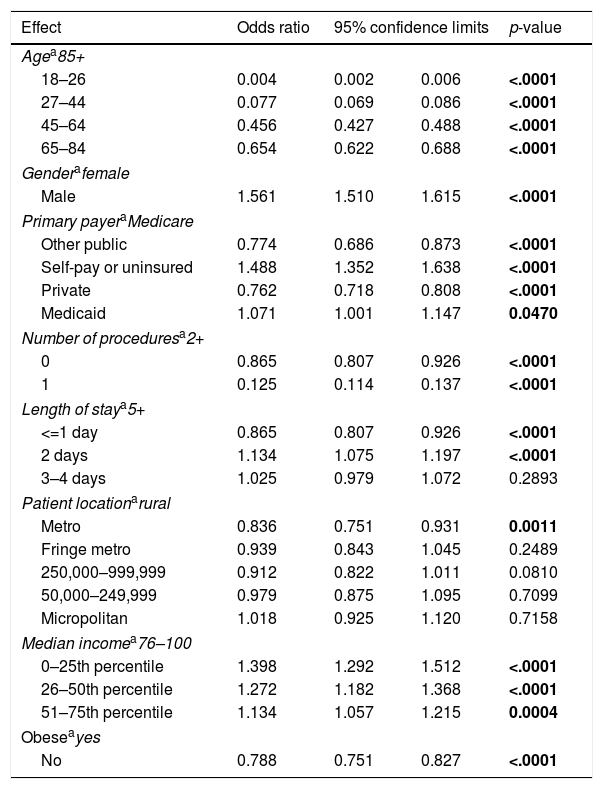
Logistic regression of the AMI all-cause first readmissions (Table 2) found that all age groups were significantly less likely to be readmitted than adults 85 years old and older. Males were significantly more likely to be readmitted than females (OR 1.561, CI 1.51–1.615, p-value <.0001). Patients with private and other public insurance types were significantly less likely to be readmitted compared to Medicare patients; however, self-pay or uninsured patients were significantly more likely to be readmitted (OR 1.488; CI 1.352–1.638, p-value <.0001). Patients who had more procedures during hospitalization had higher readmissions than their counterparts. Patients with a hospitalization lasting 2 days were significantly more likely to be readmitted (OR 1.134, CI 1.075–1.197, p-value <.0001), while patients who stayed up to one day were significantly less likely to be readmitted compared to patients who stayed for 5 or more days. Patients residing in the center of metropolitan areas were less likely to be readmitted than patients residing in rural areas. Patients with median household incomes below the 76th percentile for their county were significantly more likely to be readmitted compared to patients with median household incomes in the 76–100 percentiles, the effect was strongest among the poorest population (OR 1.398, CI 1.292–1.512, 0–25th percentile; OR 1.272, CI 1.182–1.368, 26–50th percentile; OR 1.134, CI 1.057–1.215, 51–75th percentile). Finally, non-obese patients were 21.2% less likely to be readmitted than obese patients (OR 0.788, CI 0.751–0.827, p-value <.0001).
Logistic regression of AMI hospital readmissions by patient characteristics.
| Effect | Odds ratio | 95% confidence limits | p-value | |
|---|---|---|---|---|
| Agea85+ | ||||
| 18–26 | 0.004 | 0.002 | 0.006 | <.0001 |
| 27–44 | 0.077 | 0.069 | 0.086 | <.0001 |
| 45–64 | 0.456 | 0.427 | 0.488 | <.0001 |
| 65–84 | 0.654 | 0.622 | 0.688 | <.0001 |
| Genderafemale | ||||
| Male | 1.561 | 1.510 | 1.615 | <.0001 |
| Primary payeraMedicare | ||||
| Other public | 0.774 | 0.686 | 0.873 | <.0001 |
| Self-pay or uninsured | 1.488 | 1.352 | 1.638 | <.0001 |
| Private | 0.762 | 0.718 | 0.808 | <.0001 |
| Medicaid | 1.071 | 1.001 | 1.147 | 0.0470 |
| Number of proceduresa2+ | ||||
| 0 | 0.865 | 0.807 | 0.926 | <.0001 |
| 1 | 0.125 | 0.114 | 0.137 | <.0001 |
| Length of staya5+ | ||||
| <=1 day | 0.865 | 0.807 | 0.926 | <.0001 |
| 2 days | 1.134 | 1.075 | 1.197 | <.0001 |
| 3–4 days | 1.025 | 0.979 | 1.072 | 0.2893 |
| Patient locationarural | ||||
| Metro | 0.836 | 0.751 | 0.931 | 0.0011 |
| Fringe metro | 0.939 | 0.843 | 1.045 | 0.2489 |
| 250,000–999,999 | 0.912 | 0.822 | 1.011 | 0.0810 |
| 50,000–249,999 | 0.979 | 0.875 | 1.095 | 0.7099 |
| Micropolitan | 1.018 | 0.925 | 1.120 | 0.7158 |
| Median incomea76–100 | ||||
| 0–25th percentile | 1.398 | 1.292 | 1.512 | <.0001 |
| 26–50th percentile | 1.272 | 1.182 | 1.368 | <.0001 |
| 51–75th percentile | 1.134 | 1.057 | 1.215 | 0.0004 |
| Obeseayes | ||||
| No | 0.788 | 0.751 | 0.827 | <.0001 |
Bold=significant p<.05.
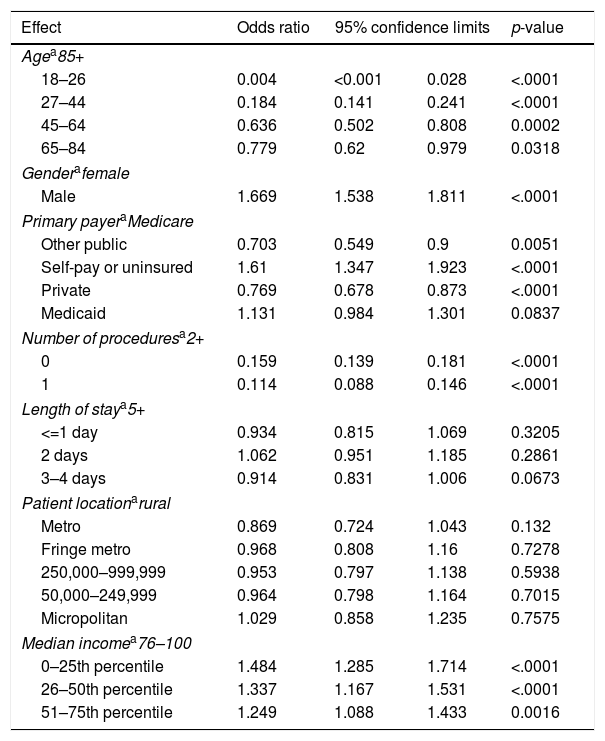
Obesity was added to the logistic regression model (Table 3), and the odds of being readmitted based on being obese were calculated. Similar to the last set of results, obese patients who were older than 85 years of age, males, subject to multiple procedures, and lower median incomes were significantly more likely to be readmitted than their counterparts. Compared to obese patients with Medicare, obese self-pay or uninsured patients were significantly more likely to be readmitted (OR 1.61, CI 1.347–1.923, p-value <.0001) and patients with private insurance and other public insurances were significantly less likely to be readmitted (OR 0.769, CI 0.678–0.873, p-value <.0001 for private; OR 0.703, CI 0.549–0.900, p-value 0.0051 for other public). There were no significant differences based on length of stay and patient location.
Logistic regression of readmissions based on presence of obesity.
| Effect | Odds ratio | 95% confidence limits | p-value | |
|---|---|---|---|---|
| Agea85+ | ||||
| 18–26 | 0.004 | <0.001 | 0.028 | <.0001 |
| 27–44 | 0.184 | 0.141 | 0.241 | <.0001 |
| 45–64 | 0.636 | 0.502 | 0.808 | 0.0002 |
| 65–84 | 0.779 | 0.62 | 0.979 | 0.0318 |
| Genderafemale | ||||
| Male | 1.669 | 1.538 | 1.811 | <.0001 |
| Primary payeraMedicare | ||||
| Other public | 0.703 | 0.549 | 0.9 | 0.0051 |
| Self-pay or uninsured | 1.61 | 1.347 | 1.923 | <.0001 |
| Private | 0.769 | 0.678 | 0.873 | <.0001 |
| Medicaid | 1.131 | 0.984 | 1.301 | 0.0837 |
| Number of proceduresa2+ | ||||
| 0 | 0.159 | 0.139 | 0.181 | <.0001 |
| 1 | 0.114 | 0.088 | 0.146 | <.0001 |
| Length of staya5+ | ||||
| <=1 day | 0.934 | 0.815 | 1.069 | 0.3205 |
| 2 days | 1.062 | 0.951 | 1.185 | 0.2861 |
| 3–4 days | 0.914 | 0.831 | 1.006 | 0.0673 |
| Patient locationarural | ||||
| Metro | 0.869 | 0.724 | 1.043 | 0.132 |
| Fringe metro | 0.968 | 0.808 | 1.16 | 0.7278 |
| 250,000–999,999 | 0.953 | 0.797 | 1.138 | 0.5938 |
| 50,000–249,999 | 0.964 | 0.798 | 1.164 | 0.7015 |
| Micropolitan | 1.029 | 0.858 | 1.235 | 0.7575 |
| Median incomea76–100 | ||||
| 0–25th percentile | 1.484 | 1.285 | 1.714 | <.0001 |
| 26–50th percentile | 1.337 | 1.167 | 1.531 | <.0001 |
| 51–75th percentile | 1.249 | 1.088 | 1.433 | 0.0016 |
Both hypotheses have been supported in this analysis. The all-cause first AMI readmission rate was 11.66%, a significant decline from the 2011 national rate of 19%. Of those readmissions, 16.57% were among obese adults; however, non-obese adults were 21% less likely to be readmitted than obese adults. There were several interesting findings in this study. One finding is that obese adults age 45–64 were significantly more likely to be readmitted, while non-obese adults age 65–84 were significantly more likely to be readmitted compared to other age groups.
We believe that there are several explanations for these findings. Older patients tend to have more chronic conditions and poorer overall health than younger patients, which could explain why older adults have higher readmission rates. Furthermore, an estimated 40% of adults age 40–59 were obese, the highest of any age group.13 The results of this study follow national trends of obesity.
When analyzing the results of logistic regression, patients who were self-pay or uninsured, in rural areas, and obese were significantly more likely to be readmitted than their counterparts. Uninsured individuals and those living in rural areas are more likely to use the emergency room because they have nowhere else to go or their provider's office was not open.14 In 2011, approximately 80% of adults visited the ER because they lacked access to other care providers.14 The results of this study indicate that males have higher readmissions than females. One explanation for this finding is that males tend to use less preventive care and delay seeking care until the condition is in a complex state, this could result in higher utilization of care and more procedures, which could result in higher readmissions.
Finally, the results of the logistic regression of AMI readmissions by obesity indicate that obese self-pay or uninsured patients have significantly higher readmissions compared to obese Medicare patients. This could be a result of the uninsured having limited access to follow-up care with other care providers.14 The uninsured population uses the emergency room for their usual source of care because of limited access to primary care for follow-up. This lack of access to quality primary care leads to decreased comprehensive care and lower continuity of care, which can result in higher readmission rates. Research has found that patients who have access to follow-up care within seven days of discharge are significantly less likely to be readmitted.15 One barrier to accessing follow-up care is insurance; the uninsured are more likely to forgo a necessary prescription because of cost compared to an insured individual.16 Medication management and lack of follow-up care are two of the main causes of hospital readmissions.17
When obesity is added to the model, length of stay and patient location are no longer significant indicators of readmissions. This means that obese patients are more likely to be readmitted to the hospital regardless of how long they are hospitalized. Similarly, obesity is a more important indicator of readmissions than location. Obese patients tend to have worse health status than normal weight patients.18 Furthermore, obesity can lead to higher utilization of health care services, including outpatient and emergency room visits, and higher costs.18 Obese patients, especially those who are uninsured with lower median incomes, may have a lower health status and lack the ability to pay for follow-up care. Lower health status increases the rate of readmissions. Inability to pay for follow-up care in an outpatient setting results in patients using the hospital as follow-up care if their condition worsens.
There are numerous quality improvement strategies aimed at reducing hospital readmissions. Specifically related to reducing AMI readmissions, post-discharge cardiac rehabilitation program participation was successful at significantly reducing cardiac and non-cardiac hospital readmission and mortality rates.19 Another strategy focused on heart health is the “Hospital to Home (H2H) Initiative”, which focuses on improving transitions of care from the hospital to the home among hospitals and cardiovascular providers.20 Transitions of care can be improved in three main ways: “early follow-up, post discharge medication management, and patient recognition of signs and symptoms.”20 The H2H Initiative contains three main challenges all aimed at reducing readmissions related to AMI. One challenge, See You in 7, created the goal of scheduling a follow-up appointment within 7 days of discharge.20Mind Your Meds relies on the teamwork of patients and doctors to improve medication management.20 Finally, Signs and Symptoms is an educational approach to patient engagement in early signs and symptoms of heart problems.20
Related to all-cause readmissions, one strategy is to improve care coordination between hospitals, primary care physicians, other medical institutions, and the communities.4,21 To develop this collaboration, the healthcare industry needs to enhance communication, efficiency of patient record sharing, and partnerships between hospitals and primary care physicians.21 Another strategy is the use of hospitalists to lower cost, length of hospitalization and readmission rate.22 Strong leadership, advanced electronic medical records and other technology used for clinical-decision support, and highly trained staff may also improve readmission rates.23 Several other strategies have been found to decrease hospital readmissions, including providing patients with emergency plans on returning to the hospital, patient outreach to determine follow-up care, and combining medication records for inpatients and outpatients.21 Any of these strategies could improve the quality of care patients receive throughout the healthcare delivery process and help reduce preventable readmissions.
There are several strengths and limitations of this study. Using national data allows for generalization of these findings to a broader audience. While beneficial for generalizability, publicly-available data limits the researcher's ability to modify variables. The inability to manipulate the coding of patient data and potential for miscoding at the hospital-level makes it difficult to decipher between preventable and required readmissions. Furthermore, hospitals can voluntarily report to HCUP; those with greater readmissions may opt-out of reporting which could skew the results. Finally, due to variations in coding practices across hospitals, there may be differential coding of patient data (e.g., race, ICD-9 codes, and present on admission indicators). Furthermore, we can only speculate as to the causes of high readmission rates among specific patient variables based on generalized theories. Another limitation is that the NRD does not use risk-standardized readmissions like CMS data, which consider hospital-based quality of care programs.6
ConclusionsThe HRRP has been effective at reducing hospital readmissions. Further attention needs to focus on preventive care and comprehensive follow-up care to ensure that patients with chronic conditions, such as obesity, can receive proper, less expensive follow-up care they need with the goal of preventing a hospital readmission. With over 30% of the U.S. population classified as obese, more targeted interventions and initiatives at the primary care level need to be implemented to improve access and adherence to preventive measures and enhance care coordination post-hospital discharge. By incentivizing the creation of hospital- and community-based programs that target those at higher risk of readmission, the overall quality of care and quality of life can be improved, while reducing the cost of care.
FundingNone declared.
Conflicts of interestThere are no conflicts of interest to declare.