


Artificial immune systems that have been inspired from organic immune systems, have drawn many attentions in recent years (and have been considered) as an evolutionary algorithm and have been applied in different papers. This algorithm can be used in two different areas of optimization and classification. In this paper, an artificial immune algorithm has been applied in optimization problem. In particular artificial immune systems have been used for computing the mapping matrices and improving features. Comparison of results of proposed method with other preprocessing methods shows the superiority of the proposed method so that in 90% of cases it has the best performance based on different measures. Evaluation measures are including classification rate, variance and compression measure.
Bio-Inspired Computing lies within the realm of Natural Computing, a field of research that is concerned with both the use of biology as an inspiration for solving computational problems and the use of the natural world experiences to solve real world problems. The increasing interest in this field lies in the fact that nowadays the world is facing more and more complex, large, distributed and ill-structured systems, while on the other hand, people notice that the apparently simple structures and organizations in nature are capable of dealing with most complex systems and tasks with ease. Artificial Immune Systems (AIS) is one among such computing paradigms, which has been receiving more attention recently and have widely been used in different application areas such as clustering/classification, anomaly detection, computer security, learning, web mining, numeric function optimization and combinatory optimization [1].
Artificial immune systems (AIS) have been inspired from mammal's immune systems against various diseases. These methods have been used in two areas of optimization and classification. In [2,3,4] the artificial immune algorithms have been grouped into two categories: 1.population based methods, 2. network dependent methods. Each one of these groups has two branches. This categorization is illustrated in Figure. 1. Generally clonal model is applied in optimization problems and negative selection in classification and clustering [5, 6]. Since the present work mainly focuses on population based methods, we introduce this model in the next sections.

In this paper artificial immune systems based on clonal selection model have been used and the optimization and features space transformation problems have been solved based on these algorithms.
Feature improvement and feature space transformation are one of the preprocessing methods that cause the amount of overlapping between dataset classes decrease and then classification of packages can be done very carefully at new feature space. One of the features transformation methods is based on Minimum Classification Error (MCE) algorithms [7].
Minimum Classification Error algorithms are efficient and effective methods of feature transformation and have many applications in the fields of data mining and machine learning [8]. This method as a discriminate method can be combined with each classification method and can be proposed as a preprocessing operation. The goal of this method is that with the aim of mapping on the features they could be transmitted into new space so the overlapping of classes in new space becomes less than previous state. This operation causes the classification error reduction. In this method the mapping is done with the multiplying of mapping matrix into data sets samples [9,10].
Mapping matrix of minimum classification error method is computed based on classification error and for computing this matrix in each step, mapping matrix changes so that classifying error reduces. The most important part of minimum classification error method is mapping matrix. Various methods have been presented for computing the matrix [8]. In this paper we use Artificial Immune System to calculate the mapping matrix [11].
The rest of the paper is organized as follow: in next section we have a brief explanation on AIS cycle and its operators. In section 3, the proposed method for calculating the transformation matrix is described. In section 4, a number of datasets are given and the experimental results from these datasets are presented and compared with the results of other methods. Finally in section 5 we discuss the benefits and limitations of our approach and came to a conclusion.
2Artificial immune systems in solving optimization problemsAll living beings are endowed with an immune system whose complexity varies according to their characteristics. Animals containing bones developed a highly effective and complex immune system. It's composed of a vast array of cells molecules and organs that work together to maintain life. The focus here will be on the immune system of vertebrates, more specifically of humans. When human's body faces with an external and unknown factor that has been entered into its body, bone marrow begins to generate and to proliferate cells and antibodies that can detect the external factor. For this purpose the bone marrow begins to generate different cells and each cell secretes a special type of antibody. Cells that secreted antibody by them better identifies and nurtures the external entered factor, is recognized as winner cell and from this time force bone marrow generates more of this cell, finally the winner cell will fill the most body's immune systems cells against external factors and secreted antibody from this cell is saved on bone marrows memory.
The mentioned procedure in this subsection is called clonal model. In this model two functions play the main role, these are the maturity function and affinity function. Fig. 1 shows different parts of the model.

Initial population. the first step is the initial population valuation. Each member of this set is called a chromosome. In this step a set of valid solutions for the problem is produced randomly, additionally, there is a memory that is called M and it exists beside this set. In each execution cycle, algorithm saves the best founded solution on its memory.
Affinity Calculation. Affinity calculation gives a chromosome as input and computes its fitness value. In fact with the aim of this function we can compare two chromosomes. This function plays the role of fitness function operator in genetic algorithms. So at this step a value is computed for each chromosome that could be used as a measure for comparison of chromosomes with each other at the next steps.
Selection operator. At this step existed chromosomes are sorted based on their affinities and among them chromosomes that have better affinity value are selected and other chromosomes are deleted. At this step the number of existed chromosomes of population decreases and only better chromosomes move to the next step.
Clonal selection. After sending better chromosomes to the next step, each chromosome duplicates and the duplicated chromosomes are placed among new population. Clonal operation are determined based on the value of the correlation function for each chromosome meaning that the chromosome that has more affinity value, is allowed to copy more samples of itself among population. So also in this step, number of existed chromosomes among population changes. Following formula shows the number of chromosomes among population.

In the above formula, Ns is the number of selected population, Pi is the number of samples that ith chromosome can copy to the new population.
Maturity operator. this function takes a chromosome as an input and with a change on that chromosome generates a new sample. In fact this operator is the substitute operator of mutation operator at genetic algorithms and is responsible for creating diversity at population.
3Proposed preprocessing methodAs discussed before, minimum classification error algorithm is a pre-processing and features improvement method. In this method that is implemented for some iteration, in each step a matrix is approximated that with multiplying this matrix into input data set, samples of this data set are mapped to a new space. In minimum classification algorithm the mapping matrix is computed so that the classes of mapped data set in new space have less overlapping than previous state and finally, the classifying error is decreased. De La Torre et al [8] have presented the method of computing the mapping matrices for least classifying error. Mohammadi et al. [12] also have presented an evolutionary algorithm based on genetic algorithm for computing the mapping matrices of least classifying error. In this paper the mapping matrices of minimum classification error algorithm is computed based on artificial immune evolutionary method. Different parts of proposed method will be investigated later. First in this section we will examine the chromosomes structuring, affinity function and maturity operator.
Initial population. The structure of chromosomes in the current problem is supposed to be a n*n matrix and its genes are valued randomly. n is the number of the features of the input data set.(in fact each chromosome of population is a mapping matrices).
Affinity function. As discussed before each chromosome is a transfer matrix for MCE prepossessing method. To determine the degree of suitability of each chromosome first we must impose that chromosome as a transfer matrix to data set and map the dataset to the space, then present the mapped samples as input to desired classification and take the value of obtained error from classification output as the value of evaluation function for this chromosome. Based on equation (2) classification error value is computed and this value is taken as the affinity value of the current chromosome.

In equation (2) C is the number of classes of data set, ECj is the number of errors that have been done on the class samples jth, NCj is the number of class samples of the Jth class.
Based on the above equation, lower affinity function value implies that fewer samples have been classified wrongly. Therefore the chromosome with the lowest affinity function value is the best one.
Maturity Operation. As discussed before, the Maturity Operation is used to generate diversity on the population and new chromosomes are generated based on this operator.
In order to get more diversity among population we use four different Maturity operators.
- •
Random Maturity: in this operator a gene of a chromosome is selected at random and its value is changed randomly
- •
Swap Maturity: in this operator, the places of two randomly selected gene of a chromosome are swapped.
- •
Creep Maturity: This Maturity operator works by adding a small (positive or negative) value to selected gene. It means that this operator can change the value of a gene smoothly. (Increase or decrease)
- •
Scramble Maturity: the value of all genes of a chromosome changes completely randomly and the new chromosome is generated.
In this section, first an introduction of evaluation measures is given briefly. Then we will evaluate our proposed method by these measures.
Evaluation measures that have been used in this paper are variance and compression measure of samples of dataset and classification accuracy. Each of these measures is explained in the following subsections.
4.1Compression Measure (DUNN)Dunn -a class validity index for evaluating each classification method- is proposed in (Dunn and Dunn, 74) and attempts to identify “compact and well-separated classes”. The index is defined by following equation for a specific number of classes

Where nc is number of classes, d(ci,cj) is the dissimilarity function between two classes Ci and Cj defined as:
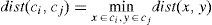
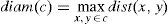
It is clear that if the dataset contains compact and well-separated classes, the distance between the classes is expected to be large and the diameter of the clusters is expected to be small. Thus, based on the Dunn's index definition, we may conclude that large values of the index indicate the presence of compact and well-separated classes.
4.2Variance Measure (SD)The SD validity index is defined based on the concepts of the average scattering for classes and total separation between classes [9]. Average scattering for classes is defined as Equation (6).

Where Vi is the center of the ith cluster and X is overall data. Total separation between clusters is defined as equation (7).
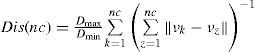
Where Dmax and Dmin are the maximum and minimum distance between cluster centers respectively.


Now, validity index SD is defined based on Equations (8) and (9) as follows:

The first term Scat(nc) defined in Equation (10) shows the average compactness of clusters and intra-cluster distance. A small value of this term indicates compact clusters. As the within-clusters scatter increases and clusters become less compact, the value of Scat(nc) increases. The second term Dis(nc) shows the total separation between nc clusters and inter-cluster distance. Dis(nc) is influenced by the geometry of the clusters centers. It increases with the number of clusters. Based on equation (10), we can say that small values of the index show the presence of compact and well-separated clusters. As the two terms of SD have the different ranges, the weighting factor λ is used in order to incorporate both terms in a balanced way. The number of clusters, nc, minimizes the above index. So, it can be considered as an optimal value for the number of clusters present in the dataset.
In the following, we will compare the results that have been obtained from the proposed feature improvement method with the four recommended states. It shows the proposed method can improve the classification accuracy.
In our experiment we have considered the neural network classifier as the classification method and we investigated the detection rate of packages for this class at four states.
- •
Without mapping and features improvement
- •
With features improvement based on standard MCE computation method
- •
With features improvement based on genetic algorithm computation
- •
With features improvement based on artificial immune systems computation method
We compare these methods on the following data sets (Table 1).
Four datasets from UCI repository (IRIS, Wine, Glass, Cmc) are chosen and a dataset which is collected from real traffic on the university router and in [13,14] the authors used this dataset for evaluating their proposed methods. For each data set number of features, number of classes along with the number of samples is shown in Table 1.
Table 2, shows the results of the first experiment. Each value in this table is the average of 100 different runs. All the experiments reported in this paper performed on a Pentium IV with 4GB of RAM.
Each row of this table shows the results of evaluation of different methods on the different data sets. In each row, the best obtained result has been highlighted. Obviously these results show that the preprocessing matrices that have been computed based on artificial immune method, in many cases could do the classification task with better accuracy relative to other states.
For evaluating our pre-processing approaches, we used Dunn index [15] as the next criteria. We calculated the Dunn index before applying any preprocessing method and after applying the discussed pre-processing methods. The results of this experiment are shown in the Table 3.
As it is shown in this Table, most of the time, the proposed method has the best result based on the Dunn index criteria so the better classification rate based on the proposed method is sensible.
Next, we measure the SD index on original dataset, and the ones mapped by the MCE, GAMCE, and AISMCE matrices. The results are shown in Table 4. We observe similar improvement in these measures when the original dataset is mapped into new dataset using the AISMCE matrix. This measure is decreased when we apply AISMCE matrix on the original dataset. This decrement shows the better separation between classes in new feature space after applying AISMCE matrix, most of the time.
As it can be seen from the tables, our results are promising. Comparing the obtained results from our approach with the results of the existing approaches in the Tables 2, 3 and 4 we can conclude that our approach in the most of the cases improve the existing ones.
5ConclusionArtificial immune systems constitute a novel computational intelligence paradigm inspired by the immune system. AIS algorithms are highly abstract models of their biological counterparts and applied to solve problems in different domain areas. In this paper we propose a pre-processing and features improvement method based on the minimum classification error method in conjunction with AIS. In the proposed method for computing the mapping matrices we have used artificial immune algorithms and have compared its results with another evolutionary algorithm (Genetic Algorithm). In order to evaluate the proposed method, we have used the standard data set (UCI) and one data set that have been gathered from actual university router traffic and then based on it and some different evaluation measures the proposed method have been investigated. Evaluation measures that have been used in this paper are the compression value of classes, variance of classes and classification rate. All the mentioned measures shows the superiority of presented features improvement method so that obtained results based on the presented method shows that the proposed combined method has the best results based on different evaluation measures in 90% of cases.