


Based on simulations of the transports of a typically formed Chinese intercity passenger train hauled respectively by major types of the locomotives on a certain railway line in China, this research analyzes the changes of the traction energy cost intensity and passenger transport efficiency of the train with varying its passenger capacity utilization rate and target speed. It is found that if the passenger capacity utilization rate of such a train is higher than 60.00%, the effect of its passenger capacity utilization rate and target speed on its traction energy cost intensity and passenger transport efficiency is relatively very small. In contrast, if the passenger capacity utilization rate of the train is reduced from 40.00%, the efficiencies of its traction energy cost and passenger transport both decrease obviously and such decreases are evidently affected by its target speed. Therefore, strictly preventing the passenger capacity utilization rate of a conventional intercity passenger train from decreasing from 40.00% in particular and meanwhile striving to make its passenger capacity utilization rate higher than 60.00% as new evaluation benchmarking are able to effectively improve the railway passenger transport operation management in China.
Although the high-speed railway network in China is being formed at the moment and Chinese highspeed railway trains are playing more and more important roles in the intercity passenger transport work, most of the intercity railway passenger transport services are still provided by the Traditional Intercity Passenger (TIP) Trains (which are locomotive-hauled). For instance, the TIP trains in China completed about 1.44 billion passenger-trips in 2011, i.e. almost 80% of the totally around 1.86 billion passenger-trips of the whole Chinese intercity railway system in this year [1]. There are daily more than 3,000 TIP trains running on the national railway network of China and their tractions consume huge amount of energy every day. As a result, how to make such a train transport its passengers efficiently with a low Traction Energy Cost (TEC) intensity (i.e. TEC per unit transport) is extremely significant for the efficiently sustainable development of the railway transport in China, because of the importance of energy efficiency which has been receiving more and more attention for solving energy problems such as climate change[2].
Decreasing TEC intensities and reducing Transport Operation Time (TOT) wastes of trains have always been one of the most important issues studied by researchers and practitioners. It is true that rationally taking advantage of downward slopes of a rail line in a comprehensive manner is able to not only cut down the TEC of a train for the whole trip but also optimize its TOT [3]. As a result, many studies focus on the optimizations of trains’ operating controls. For example, Liu and Golovitcher [4] make use of the optimal control theory to judge the change points of the control of a train in its transport process to minimize its TEC for its whole trip in certain TOT. Kim and Chien [5, 6] utilize the simulated annealing algorithm to determine the control patterns of a train in different stages of its transport procedure in consideration of track alignments, speed limits and transport schedule adherence for the minimal TEC. Ding et al. [7] develops a two-level hierarchical model solved with the genetic algorithm to decide the coasting points of a train within a scheduled TOT for its trip to decrease its TEC. In contrast, some effort to minimize the TEC of a train in view of its TOT is made with attaching much importance to specific factors of the train. Such factors include a train’s general mass [8], stop frequency or stop-spacing [9, 10], mass distribution [11], acceleration and braking performance [12], out-put powers from different engines [13], target speed [14, 15], formation [16, 17], energy storage [18, 19], etc. In addition, from a comparatively systematic perspective, there are also works about the transports of multi-trains to optimize their TECs and TOTs in general. For instance, Wong and Ho [20, 21] apply the dynamic programming method to analyze the dwell and run times of trains on the same rail line for their energy saving and service time regulation. Artificial neural networks, genetic algorithms and simulation approaches are also used in integrated ways by Acikbas and Soylemez [22] and Yang et al. [23] to seek the coasting strategies of trains on a rail network to minimize the overall TEC for the target TOTs of these trains. A fuzzy linear programming model is established as well to optimize the transport time schedule of trains for minimizing the TEC under the uncertain delays of trains [24]. Li et al. [25] further propose a multi-objective fuzzy scheduling model to minimize the TEC, carbon emission and TOT of multi-trains.
In spite of worthwhile previous studies revealing many facts and putting forward valuable proposes for the optimizations of TECs and TOTs of trains, the influence of the utilization rate of the passenger capacity of a train upon its TEC intensity and TOT waste has not been fully detected in an adequately accurate manner. It is truly correct that improving the utilization rate of the passenger capacity of a train generally decrease its TEC and TOT per unit transport. However, the decrease trends of the TEC and TOT per unit transport of a train with increasing the utilization rate of its passenger capacity especially in the effect of its target speed still need to be explored in detail for the cost and efficiency management of railway transport. Utilizing a computer-aided simulation approach, this research systematically studies the changes of the TEC and TOT per unit transport of a typically formed Chinese TIP train with the variations of the utilization rate of its passenger capacity, i.e. the utilization ratio of all the passenger seats and berths of the train, as well as its target speed.
The contents of this paper are organized as follows. The applied simulation approach together with the studied train and the selected railway line are explained in Section 2. Thereafter, Section 3 and Section 4 successively analyze the changes of the TEC per 10,000 passenger-kilometers (p-km) and TOT per 10,000 p-km of the studied TIP train in view of both the utilization ratio of all its passenger seats and berths and its target speed. Finally, Section 5 draws conclusions and indicates some future research issues.
2Computation workA typically formed TIP train in China consists of 1 electric locomotive whose type is usually SS3, SS8 or SS9 [26] and 18 railway cars whose type is mostly 25K [27]. These 18 cars in their connected sequence from the locomotive are 1 Car equipped with the Power Unit (CPU), 5 Cars equipped with Passenger Seats (CPS), 1 Car providing Dining Services (CDS), 1 Car equipped with Soft Berths (CSB), 9 Cars equipped with Common Berths (CCB) and 1 Car carrying Checked Luggage (CCL). Their total length is about 360.00 m. The mass of a railway car of 25K is 60.50 tons (t) (CPU), 48.80 t (CPS), 48.00 t (CDS), 66.00 t (CSB), 46.50 t (CCB) or 42.40 t (CCL). A railway car of 25K commonly has 118 passenger seats (CPS), 36 soft berths (CSB) or 66 common berths (CCB). A CPU or CCL does not carry passengers and CDS has no fixed passenger seats or berths.
The designed top-speeds of SS3, SS8 and SS9 are 100.00 kilometers per hour (km/h), 170.00km/h and 170.00km/h in a respective manner. Their masses are correspondingly 138.00 t, 88.00 t and 126.00 t. The target speed of such a TIP train in China is ordinarily between 60.00km/h and 170.00km/h. In this research, the passenger transports of such a TIP train with different target speeds and various utilization rates of its passenger capacity for the same trip from Station-A to Station-B of a certain intercity railway line in China are studied in simulation. The target speed and utilization ratio of all the passenger seats and berths of the train are constant for one whole trip which is made up of 4 successive transport sections whose lengths are 4.50 kilometers (km), 19.20km, 50.50km and 43.50km in sequence from Station-A to Station-B. The average mass of a railway passenger together with his/her hand baggage is 80.00kg [28].
The approach shown in Figure 1 is used in this work to compute the TEC and TOT of a passenger transport work completed by a train with a certain target speed from its origin station to its terminus. The train is regarded as a line segment with its mass evenly distributed in simulation. Successive simulation intervals are set to be equal to 0.10 second (s) in this study. The traction power and traction force of the train are assumed to be unchanged in one simulation interval. The train starts up with its full traction power towards its target speed (V).

In order to prevent the speed of the train from breaking through the speed restrictions at some parts of the rail line and also ensure the safe stop of the train at the next station, the train decides at the end of each simulation interval its operating condition in the next interval. Such a decision is based on the current speed (v 1) of the train, the shorter length (Ls) of the transport distances from the current location of the train to both the nearest rail site with a speed restriction and the next station, the permitted maximum speed (v 2) of the train at the nearest rail part with the speed restriction (i.e. 0 < v2 < V) or the next station (i.e. v2 = 0) and the shortest braking distance (Lv) of the train decreasing its speed from V to v2 in consideration of the braking performance of the train. If Ls > Lv, the train in the next simulation interval takes the operating condition of braking, coasting or motoring with some operating handle position according to the degree of the deviation of its speed at the end of this simulation interval from the target speed. If Ls ≤ Lv and C1 ≤ v2-v1 < C2, the train coasts in the next simulation interval.
The values of C1 and C2 are positive and set to prevent the speed of the train at the end of the next simulation interval from exceeding v2 due to coasting and the train from accidentally stopping in the next interval before its arriving at the next station respectively. If Ls ≤ Lv and v2 - v1 ≥ C2, the train motors with a particular operating handle position in the next simulation interval. If Ls < Lv and 0 ≤ v2 - v1 < C1, the train in the next interval brakes normally. If Ls ≤ Lv and v2 -v1 < 0, the train brakes to decrease its speed as soon as possible in the next simulation interval to a comparatively small value to fully ensure the safety of the train. No sooner has the train stopped in a station than its engines stop working. The studied train in this research stops in each of its intermediate stations for 1.00 s in simulation.
Each type of electric trains has a particular traction force for the split second of its startup with a certain traction power requiring its engines have some amperage under the voltage provided by its electric power supply network. A train has also its own series of operating handle positions making the traction power of the train changed by degrees from 0 W to its full traction power for its running after its startup. When the train is coasting or braking in its running process, its operating handle is at the position of racing.
As a result, the traction power of the train is 0 W at such a time. However, the engines of the train meanwhile still consume electric energy with certain amperage under the provided voltage.
When the running operation of the train is motoring, i.e. its traction power decided by its operating handle position is non-zero, the traction force of the train and accordingly the amperage of its engines are changed with not only its traction power but also its speed. As afore-explained, the engines of the train in stop do not work in this study and certainly have no amperage. Therefore, the train in stop neither has traction force nor consumes electricity. The traction force of a train is interpreted by Eq. (1):
where FkV is the traction force of the train with the target speed of V in the kth simulation interval, unit: N, FkP is the traction force of the train for its startup with the traction power of P in the k th simulation interval, unit: N, Pk is the traction power of the train for the running operation after its startup in the kth simulation interval, unit: W, and vk-1 is the speed of the train at the end of the (k -1)th simulation interval after its startup, Unit: m/s.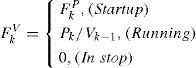
As explained by Eq. (2), the speed of the train at the end of a simulation interval is determined by the speed of the train at the end of the previous simulation interval, the traction force of the train in this simulation interval, the resistance force of the train in this simulation interval and the total mass of the train and its passengers:
where vk is the speed of the train at the end of the kth simulation interval, unit: m/s, fk is the resistance force of the train in the k th simulation interval, unit: N, M is the total mass of the train and its passengers, unit: kg, and Δt is the length of a simulation interval.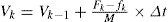
The resistance force of the train for its startup is determined by its resistance force intensity depending on detailed type of the train, the total mass of the train and its passengers and the ramps, curves, etc. of the rail line.
In contrast, the resistance force of the train for its running after its startup is increased with the speed of the train and also influenced by the ramps, curves, etc. of the rail line. If the train is in stop, it has no resistance force to overcome for its passenger transport mission. All these are illuminated by Eq. (3):
where q is the resistance force intensity for the startup of the train, unit: N/kg, α0, α1 and α2 are the basic resistance coefficients for the running operation of the train after its startup due to its frictions with air and rail, and fka is the additional resistance force from the ramps, curves, etc. of the rail line in the kth simulation interval, unit: N.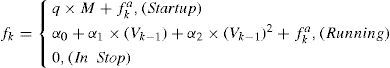
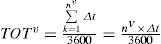
The TEC and TOT of one transport of the train from its origin station to its terminus are clarified by Eqs. (4) and (5) respectively:
where TECv is the TEC of the whole trip of the train with the target speed of v, unit: kilowatt hours (kWh), U¯k is the average voltage provided for the transport of the train in the k th simulation interval, unit: V, I¯k is the average amperage under the average voltage of U¯k for the transport of the train in the k th simulation interval, unit: A, nv is the total number of the simulation intervals used by the train with the target speed of v to complete the whole trip, and TOTv is the TOT of the train with the target speed of v for the whole trip, Unit: hours (h).3Traction energy cost intensity analysis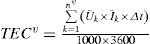
As explained by Eq. (6), the TEC per 10,000 p-km is utilized in this research to analyze the change of the TEC intensity of a train with varying its target speed and the utilization ratio of all its passenger seats and berths for the same trip:
where ev is the TEC per 10,000 p-km of the train with the target speed of v for the whole trip, unit: kWh/10,000 p-km, m is the number of all the transport sections consisting of the whole trip of the train, C is the total number of the passenger seats and berths of the train, Ri is the utilization ratio of the passenger seats and berths of the train in the transport section of i, unit: %, Di is the transport distance of the train in the transport section of i, unit: 10,000km, R¯ is the average utilization ratio of the passenger seats and berths of the train for the whole trip, unit: %, and D is the transport distance of the train for the whole trip, unit: 10,000km.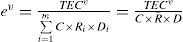
Because the studied train does not change the utilization rate of its passenger capacity for one trip from Station-A to Station-B, the utilization ratios of the passenger seats and berths of the train for the whole trip and each of the transport sections are equal to each other in this work. The change of the TEC per 10,000 p-km with increasing the target speed and utilization rate of the passenger capacity of the studied TIP train hauled respectively by SS3, SS8 and SS9 for the trip from Station-A to Station-B is presented in Figure 2, Figure 3 and Figure 4 in a corresponding manner. It is indicated in these three figures that the increase of the TEC per 10,000 p-km of the train with the decrease of its passenger capacity utilization rate which is over 40.00% is relatively slow. At the same time, varying the target speed of the train has small influence upon its TEC per 10,000 p-km especially for a utilization ratio of the passenger seats and berths of the train higher than 60.00%. On the contrary, if the utilization rate of the passenger capacity decreases from 40.00%, the TEC per 10,000 p-km increase sharply. Such a trend could be accelerated by the improvement of the target speed of the train. Meantime, distinct characteristics of the TEC intensions of different locomotives because of their various target speeds are capable of making very apparent effect on the TEC per 10,000 p-km of the train.
4Passenger transport efficiency evaluation


The TOT per 10,000 p-km, as interpreted by Eq. (7), is applied in this study to comparatively evaluate the passenger transport efficiencies of a train for its different target speeds and various utilization ratios of all its passenger seats and berths for the same transport work:
where tv is the TOT per 10,000 p-km of the train with the target speed of v for the whole trip, Unit: h/10,000 p-km.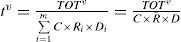
The influence of the utilization rate of the passenger capacity and the target speed upon the TOT per 10,000 p-km of the studied train hauled by SS3, SS8 and SS9 respectively for the same trip is correspondingly shown in Figure 5, Figure 6 and Figure 7.


It is revealed in these three figures that if the utilization ratio of the passenger seats and berths of the train is higher than 40.00%, the TOT per 10,000 p-km of the train decreases slowly with raising the utilization rate of its passenger capacity. Meanwhile, improving the target speed of the train has a very limited impact on cutting down its TOT per 10,000 p-km in particular for a passenger capacity utilization rate over 60.00%. In contrast, if the utilization ratio of the passenger seats and berths of the train is reduced from 40.00%, the TOT per 10,000 p-km of the train increases obviously and the decrease of its transport efficiency is exacerbated evidently by lowering the target speed.
5ConclusionsIt is empirically confirmed that the TEC and TOT per unit transport of a TIP train in China are both obviously increased with decreasing its passenger capacity utilization rate from 40.00%. Moreover, the increase of the TOT per unit transport of the train at such a time is greatly accelerated by decreasing its target speed. In contrast, if the utilization ratio of the passenger seats and berths of a TIP train is higher than 60.00% in particular, neither the utilization rate of the passenger capacity nor the target speed of the train has very conspicuous influence upon its TEC intensity as well as passenger transport efficiency. Therefore, the utilization ratio of the passenger seats and berths of a TIP train below 40.00% ought to be avoided strictly for the intercity railway transport operation in China. At the same time, striving to make the utilization rate of the passenger capacity of a TIP train higher than 60.00% avails not only traction energy saving but also transport efficiency improvement of the railway passenger transport work. The establishment of new evaluation benchmarking according to these study results is able to substantially improve the operation management of railway passenger transport. This is also very important to our lives which today rely heavily on the reliable operation and intelligent management of critical infrastructures including transportation systems [29].
Only the passenger transports of a typically composed TIP train hauled by three representative types of locomotives on a certain intercity railway line in China have been studied in this research. Transports of more kinds of trains on different railway lines are necessary to be analyzed to further validate the conclusions of this study in our future work. Moreover, the impacts of many other factors including regenerative braking, strong wind, very high or low temperature, etc. should be explored as well in an integrated manner in the future.