


Social anxiety disorder (SAD) is a common mental health problem, and its core cognitive manifestation is the persistent fear of being evaluated, including both negatively (FNE) and positively (FPE). This study aimed to examine the longitudinal relationships of FNE, FPE and SAD and explore their neural basis.
MethodsThree samples were retrieved in this study. First, the data of 649 college students who completed a survey and fMRI scan were used to explore the neural basis of FNE, FPE, and SAD symptoms. Next, the data of 450 participants who completed the same survey twice were used to examine the longitudinal relationships of the variables. Finally, the overlapping of the two samples (N = 288) who completed two surveys and the fMRI scan were used to establish a brain-behavior model.
ResultsBoth FNE and FPE predicted SAD, and SAD also predicted FPE. The neural signals of subregions in prefrontal cortex were correlated with the scores of FNE, FPE and SAD. Abnormal prefrontal signals influenced SAD symptoms via fears of evaluation.
ConclusionsOur findings explain the behavioral and neural underpinnings of social anxiety from a fear of evaluation angle. This contributes to a better theorical understanding of SAD and clinical practice.
Social anxiety disorder (SAD) is a mental health condition in which individuals experience marked and chronic fear of social situations (American Psychiatric Association, 2013). Like many psychological phenomena, the experience of social anxiety sits within a continuum of severity (Ruscio, 2010). While mild symptoms are part of normative developmental trajectories and often do not impair normal functioning, severe symptoms may be associated with significant functional impairment in social and daily functioning and lead to a diagnosis of SAD (Beesdo-Baum et al., 2012; Vilaplana-Pérez et al., 2021). Social anxiety typically starts in adolescence and is common in young adults, with a 12-month prevalence of 8.2% (Kessler et al., 2012; Klumpp et al., 2012). Thus, research exploring the risk factors of social anxiety in young adults with different levels of social anxiety symptoms can help to better understand this condition (Hur et al., 2020; Leigh & Clark, 2018; Ruscio, 2010).
Individuals who suffer from SAD experience fear of being negatively judged or evaluated by others (Spence & Rapee, 2016), which is the core cognitive symptom of SAD (American Psychiatric Association, 2013). Indeed, fear of negative evaluation (FNE) is closely associated with social anxiety in both adolescents and adults (Heimberg et al., 2014). Traditional SAD research mostly focused on FNE. However, more recent research has suggested that the persistent fears in SAD include not only fear of negative evaluation but also fear of positive evaluation (FPE, Rodebaug et al., 2012; Weeks et al., 2008). FPE refers to the apprehension and distress over positive evaluations by others (Weeks et al., 2008). FPE has been shown to have a robust correlation with social anxiety symptoms and has consequently been incorporated into SAD models (Heimberg et al., 2014; Reichenberger & Blechert, 2018; Weeks et al., 2008; Weeks et al., 2008). Compared with FNE, which is also seen in some other anxiety and depressive disorders, FPE is a unique factor for social anxiety (Weeks, 2015). Although Cook et al.'s (2022) meta-analysis found that FPE plays an important role in research, diagnosis, and treatment of social anxiety, compared with FNE, there have been very limited (only one, to our knowledge) intervention studies focused on FPE (Weeks et al., 2020).
There are different views on the relationships between the two types of fear of evaluation and social anxiety. At an earlier stage, researchers proposed that FPE is a delayed form of FNE because when individuals receive positive evaluation from others, they believe such evaluation can increase others’ expectations from their subsequent performance, which they will be unable to meet. This, ultimately, results in potential negative evaluation from others because the bar one sets for oneself is increasingly higher (Wallace & Alden, 1995; Wallace & Alden, 1997). This view assumes that FPE is rooted in FNE with an underlying mechanism implying the causal relationship from FNE to FPE. Rodebaugh et al. (2012) referred to this hypothesis as the delayed hypothesis.
An alternative hypothesis named bivalent fear of evaluation (BFOE) suggests that FNE and FPE are distinct but correlated factors of SAD (Weeks & Howell, 2012). The BFOE is rooted in the psycho-evolutionary theory: human society is a hierarchical organization and individuals tend to maintain their own class stability by fearing general evaluation (Cook et al., 2019; Gilbert, 2001). It has been suggested that the distinct constructs of FPE and FNE may derive from different adaptive goals (Reichenberger & Blechert, 2018). Specifically, on the one hand, being evaluated negatively could cause individuals to lower their social hierarchy and eventually be excluded from the group. Thus, FNE is seen as an inherited threat detection mechanism that protects us from social exclusion (Liu et al., 2020). On the other hand, being evaluated positively could improve individuals’ social hierarchy and get them into social competition states. As such, FPE is another inherited threat detection mechanism that helps us avoid conflict and threats from social competitions (Reichenberger & Blechert, 2018). Although moderate FNE and FPE have positive adaptive significance, the BFOE suggests that individuals develop a higher level of social anxiety when the psycho-evolutionary alarms are exaggerated and become distorted due to persistent negative thinking patterns (Weeks & Howell, 2014). According to the BFOE hypothesis, both FNE and FPE could be considered as risk factors for SAD symptoms (Cook et al., 2019; Fredrick & Luebbe, 2022). This idea has been endorsed by numerous empirical studies according to a recent systematic review and meta-analysis (Cook et al., 2022).
Although the two theoretical accounts (i.e., the delayed hypothesis, and the BFOE hypothesis) seem controversial, they emphasize different aspects of the FNE-FPE relationship. The delayed hypothesis suggests that FPE is anticipated FNE in social situations based on preliminary evidence (Wallace & Alden, 1995; Wallace & Alden, 1997). In contrast, the BFOE hypothesis suggest that FNE and FPE are independent, based on Gilbert's reasoning about adaptive functions (Gilbert, 2001; Weeks & Howell, 2012). Although both have theoretical implications, growing evidence from laboratory-based and psychometric studies supported the BFOE hypothesis (Reichenberger et al., 2015; Rodebaugh et al., 2012). Importantly, most studies this far (e.g., Cook et al., 2019; Heimberg et al., 2014; Rodebaugh et al., 2017) have used cross-sectional designs. This limits the ability for causal inference. Only a few studies employed longitudinal designs (e.g., Fredrick & Luebbe, 2022; Johnson et al., 2020; Rodebaugh et al., 2012). These, nevertheless, have not reached a consistent conclusion, likely because of the employment of short-time frameworks and heterogeneous samples, scales and methods. Therefore, it is important to further explore the process from fears of evaluation to SAD symptoms, and ideally to use a long-time framework (several years) longitudinal design in a large sample.
In addition to the behavioral relationship perspective, there is also limited knowledge regarding the neural basis of fears of evaluation and social anxiety, especially in healthy young people. To date, Birk et al. (2019) examined the neural response to social evaluation with a task-based fMRI paradigm in SAD patients. Their results showed that FNE and SAD scores were associated with neural response of the amygdala and insula. Bishop (2007) suggested that the prefrontal cortex plays a significant role in top-down control of attention, emotion regulation, and receiving the bottom-up signals from the amygdala. Numerous studies have confirmed Bishop's model and demonstrated that the prefrontal cortex is a key region in social-evaluation (Cremers et al., 2015; Gunther Moor et al., 2010; Somerville et al., 2013). Furthermore, Hare et al. (2009) demonstrated that ventromedial prefrontal cortex (vmPFC) is responsible for coding value signals while dorsolateral prefrontal cortex (dlPFC) mediates self-control through the modulation of the value signal in the vmPFC. Based on these findings, we proposed that an abnormal functioning of the prefrontal cortex would be associated with elevated fears of social evaluation and social anxiety.
The abovementioned studies used task-based fMRI paradigm, and ultimately provide a good starting point in understanding the neural underpinnings of social evaluation and SAD. However, a limitation of this paradigm is that tasks and analyses can vary by study; and this may prevent researchers from reaching a consistent conclusion (Mizzi et al., 2021). In contrast, the resting-state fMRI method is not dependent on the task performance and could avoid potential confounding effects (Lv et al., 2018; Mizzi et al., 2021). We hence employ it here, without discounting the importance of past task-based fMRI studies.
We specifically use the fractional amplitude of low-frequency fluctuation (fALFF) approach, which employs useful, valid and reliable resting-state metrics to describe the human brain function (Mennes et al., 2011; Zou et al., 2008). Although to date there is no resting-state fMRI study that directly investigates fears of evaluation under the BFOE framework, several studies used amplitude of low-frequency fluctuation in SAD patients. They found consistent results of abnormity across frontal regions (Mizzi et al., 2021; Qiu et al., 2015; Yuan et al., 2018; Zhang et al., 2015). In addition, vmPFC and dlPFC serve as the key regions of the default mode network and frontoparietal control network respectively. They mediate rumination and social value representation (Chen & Yan, 2021; Chen et al., 2020; Speer & Delgado, 2020). Based on these findings, it is reasonable to investigate the neural basis representing fears of evaluation in social anxiety by using the fALFF metrics. It is also reasonable to expect that the prefrontal cortex is a neural basis of fears of evaluation and social anxiety.
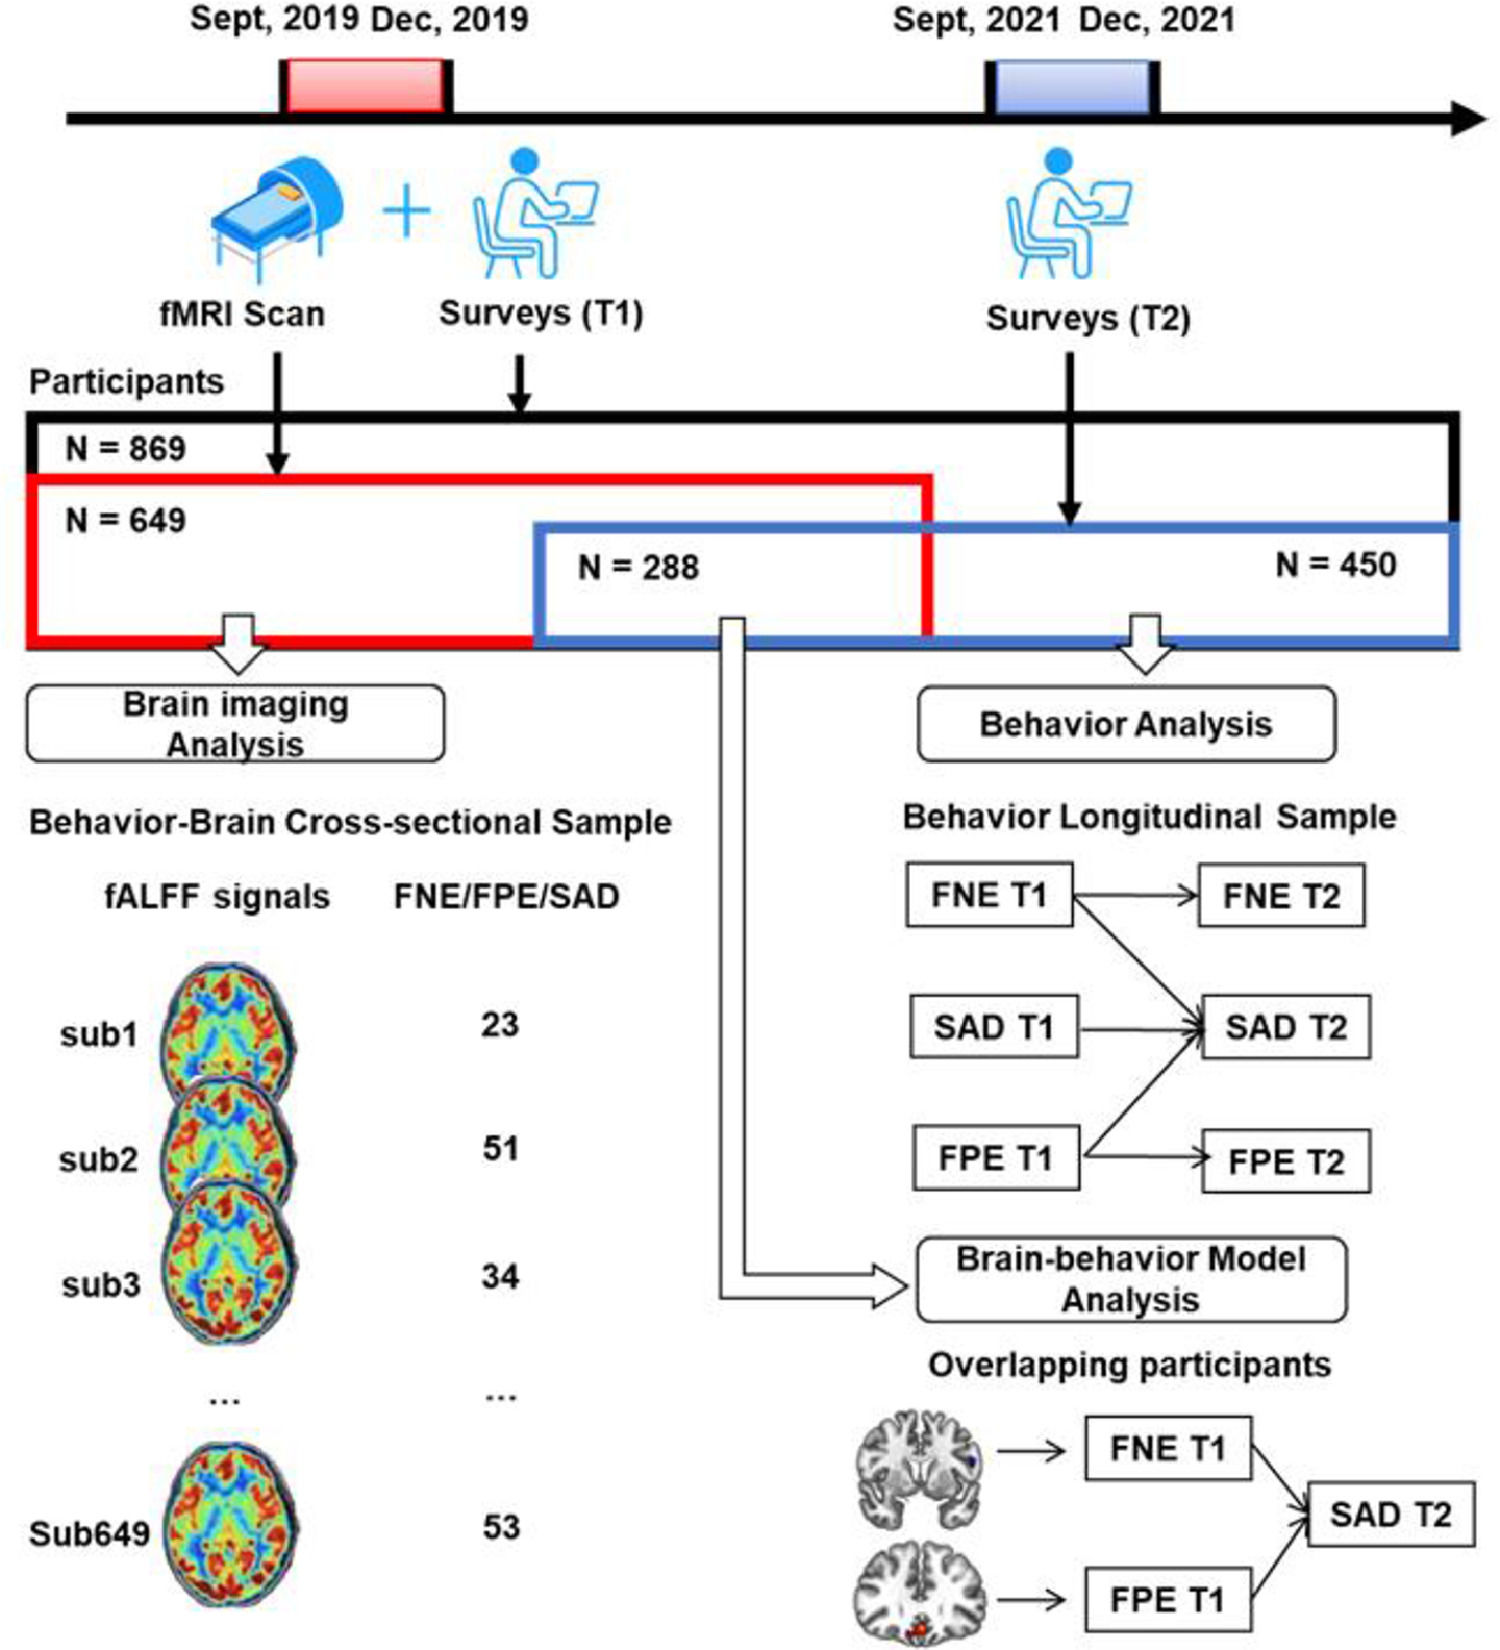
All in all, the first goal of the present study is to test the longitudinal relationships among FNE, FPE, and SAD in a large sample of healthy young adults. A cross-lagged panel model analysis across 2 years is conducted to examine the two hypotheses (i.e., the delayed hypothesis and the BFOE hypothesis). We hypothesized that the dominant BFOE would be supported where FNE and FPE would predict SAD respectively. In addition, no cross-lagged effect would be found from FNE to FPE. This would demonstrate that the delayed hypothesis is not supported. The second goal is to investigate the neural basis of SAD using fALFF. To this end, correlational analyses across the whole brain voxels is conducted to determine where the fALFF signals are correlated with FNE, FPE, and SAD. We hypothesized that the prefrontal region would be the correlated region. Finally, based on the results of the two goals above, the third goal is to establish a brain-behavior model describing a process that accounts for both neural signals and behavioral responses. A schematic overview of this study is presented in Fig. 1.
MethodsParticipants
A large Behavior Brain Research Project provided data for this study. All participants reported no history of neurological or psychiatric illness and gave written informed consent that was approved by local IRB. During September to December 2019, a total of 869 college students completed the surveys, and 692 of them completed the fMRI scan. Out of them, 43 were excluded due to poor scan quality, excessive head motion (above 2 mm) or larger scrubbed timepoints (above 25%). The resultant fMRI sample included 649 participants. After 2 years (September–December 2021), all the potential participants who completed the first survey were invited to complete the second survey online. Out of them, 450 responded and completed the second survey.
This process resulted in two partially-overlapping samples (see Fig. 1 and Table1). The behavior-brain cross-sectional (BBC) sample included 649 healthy young adults (215 males, mean age = 18.96 ± 0.97 years), who completed both the fMRI scan and first survey (September–December 2019). The behavior longitudinal (BL) sample included 450 healthy young adults (119 males, mean age at the first behavior collection = 18.81 ± 0.82 years) who completed both the first (September–December 2019) and second surveys (September–December 2021). The overlapping sample included 288 healthy young adults (93 males, mean age at the first behavior collection = 18.81 ± 0.93 years) who completed fMRI scan in 2019 and all two surveys in 2019 and 2021.
Demographic and descriptive information of the BBC sample and BL sample at first and second data collection period.
Note: T1= Time 1; T2 = Time 2. SD = standard deviation. BBC = The behavior-brain cross-sectional sample; BL = The behavior longitudinal sample. The BBC data at T2 were not presented because not all the participants completed the T2 data collection.
A priori power analysis was conducted using G power 3.1 (Faul et al., 2009) to determine the minimal sample size for correlational analyses with expected r = 0.15, α = 0.05, power = 0.80. The minimum sample size was 343. Thus, our sample is adequate for testing the study correlation hypotheses. Another power analysis was conducted using R 4.2.1 (Hofmann & Roth, 1996; Preacher & Coffman, 2006) to determine the minimal sample size of the structural equation models. The results showed that the minimum sample size for the BFOE hypothetic model was 300 (df = 4, α = 0.05, power = 0.80) while for the delayed hypothesis it was 365 (df = 3, α = 0.05, power = 0.80). Thus, the BL sample size of 450 is more than adequate to test the theoretically proposed structural models.
Behavior measuresSocial anxietySocial anxiety was measured with the short forms of the Social Interaction Anxiety Scale (SIAS-6) and Social Phobia Scale (SPS-6; Peters et al., 2012). SIAS-6 captures the social performance aspect of SAD. SPS-6 captures the social interaction aspect of SAD. Both the SIAS-6 and SPS-6 have been reliable with α=0.89 in student samples (Peters et al., 2012). Participants rate each item on a 5-point Likert scale, from 0 (Not at all characteristic or true of me) to 4 (Extremely characteristic or true of me). In this study, social anxiety score is a composite of the SIAS-6 and SPS-6, the internal consistencies of which ranged from 0.89 to 0.91.
Fear of negative evaluationThe Brief Fear of Negative Evaluation Scale is a 12-item scale that measures distress related to negative evaluation from others. Participants rated each item on a 5-point Likert scale from 0 (“not at all”), to 4 (“extremely characteristic of me”). The scale has been reliable: α=0.96 in student samples (Leary, 1983). In our samples, the internal consistencies ranged from 0.90 to 0.91.
Fear of positive evaluationThe Fear of Positive Evaluation scale is a 10-item scale that measures distress related to positive evaluation from others. Participants rated each item on a 10-point Likert scale, from 0 (“Not at all true”) to 4 (“Very true”). The scale has been reliable: α=0.80 in student samples (Weeks et al., 2008). In our samples, the internal consistencies ranged from 0.89 to 0.91.
Image acquisition and preprocessingAll participants underwent an 8-min resting-state fMRI scanning using a 3T SIEMENS PRISMA scanner (Erlangen, Germany). During scanning, participants were instructed to keep their eyes open, but not to sleep and rest without thinking anything. A total of 240 functional volumes were obtained with gradient echo‐planar imaging sequence: repetition time (TR) = 2,000 ms, echo time (TE) = 30 ms, field of view (FOV) = 224 × 224, flip angle (FA) = 90°, slices = 62, thickness = 2 mm, slice gap = 0.3 mm, voxel size = 2 × 2 × 2 mm3. High-resolution T1-weighted structural images were acquired using a magnetization prepared rapid acquisition gradient-echo (MPRAGE) sequence: TR = 2530 ms, TE = 2.98 ms, FOV = 224 × 256 mm2, resolution matrix = 448 × 512, FA = 7°, slices = 192, thickness = 1.0 mm, inversion time = 1100 ms, voxel size = 0.5 × 0.5 × 1 mm3.
The resting-state fMRI data were preprocessed by SPM12 (Welcome Department of Cognitive Neurology, London, UK; implemented by MATLAB, MathWorks, Inc., Natick, MA, USA) and functional connectivity toolbox (CONN, Whitfield-Gabrieli & Nieto-Castanon, 2012). Slice timing and realignment were performed at first, then the realigned images were normalized to MNI152 space (ICBM 2009a nonlinear symmetric template) using the DARTEL process, resampled into 3 × 3 × 3 mm3 resolution, and smoothed with 6 mm FWHM Gaussian kernel. The head motion parameters signals were regressed using Friston 24 parameters method (Satterthwaite et al., 2013), and the aCompCor method (Behzadi et al., 2007) was adopted to further avoid nuisance noises and head movement artifacts. A scrubbing method (FD_Power) was used to remove bad volumes caused by head motion. Participants with too many scrubbing time points (25%) were excluded in subsequent analysis. Linear detrending was also applied to the images.
Behavior analysisBehavior statistical analysis was performed in SPSS22.0 and Mplus8.0. A partial correlational analysis with age and gender as covariates was employed for the two samples. A false discovery rate correction (FDR) was used to correct the p values (Benjamini & Hochberg, 1995). Harman's single factor analysis was used to test possible common method variance risks (Chang et al., 2020).
To test the relationships between FNE, FPE, and SAD, a cross-lagged panel model analysis based upon the structural equation model was conducted using the longitudinal data of the BL sample. Firstly, all possible pathways in the cross-lagged panel model were included to produce a saturated model. According to the significant pathways in the saturated models, a final model which excluded the nonsignificant pathways was established. The final model was evaluated based on several fit indices: the chi-square (χ2) test, the comparative fit index (CFI), the Tucker-Lewis index (TLI), the root mean square error of approximation (RMSEA), and the standardized root mean square residual (SRMR). The above-mentioned FDR was used to correct the p-values for the multiple pathways in the model.
Brain imaging analysisBrain imaging analysis was conducted using the cross-sectional data of the BBC sample. The fALFF calculation was performed by the tool Data Processing & Analysis for Brain Imaging (DPABI, Yan et al., 2016). The resulting fALFF map for each participant was calculated and then converted into a z-map by Fisher's r-to-z transformation. In order to explore the neural basis of FNE, FPE and SAD, this study used correlational analyses in DPABI. Specifically, partial correlation analyses among the scales (i.e., FNE, FPE, SAD) with age and gender as covariates and the zfALFF values across all the voxels were performed. These resulted in three correlation coefficient maps. Then, the multiple comparisons corrections were used for the three maps with Gaussian random field correction (GRF, voxel p < 0.001; cluster p < 0.05).
Brain-behavior model analysisBehavior-brain model analysis was performed using SPSS22.0 and Mplus8.0 to integrate the findings from the behavioral and brain imaging analyses. Firstly, using the GRF corrected results, this study generated the specific masks of measurements-related brain regions and extracted the mean zfALLF signals from the masks. Subsequently, a partial correlation analysis with age and gender as covariates was conducted to uncover the relationships between each scale (i.e., FNE, FPE, SAD) and the zfALFF signals of the specific brain regions in the BBC sample. Finally, a structural equation model using the data of the 288 overlapping participants from the BBC and BL samples was estimated. This model integrates the neural and behavioral perspectives. We used the FDR method for correction purposes in the structural equation modeling analysis.
ResultsBehavior resultsFor the BBC and BL samples, demographic and descriptive information is presented in Table 1. Partial correlations are presented in Table 2. The FNE, FPE and SAD were significantly and positively correlated in both samples. Harman's single factor analysis showed that in both samples, the total variance explained by the first factor was less than the 50% threshold (detailed results are provided in the supplementary materials). Thus, common method variance was reasonable.
Pearson correlations between FNE, FPE and SAD of the BBC sample and BL sample separately (age and gender as covariates).
Note: T1= Time 1, T2 = Time 2. BBC = The behavior-brain cross-sectional sample; BL = The behavior longitudinal sample. FDR correction was used to correct the p value, ⁎⁎⁎ adjusted p < 0.001. The BBC sample's correlational results at T2 were not showed since not all the participants completed the second data collection.
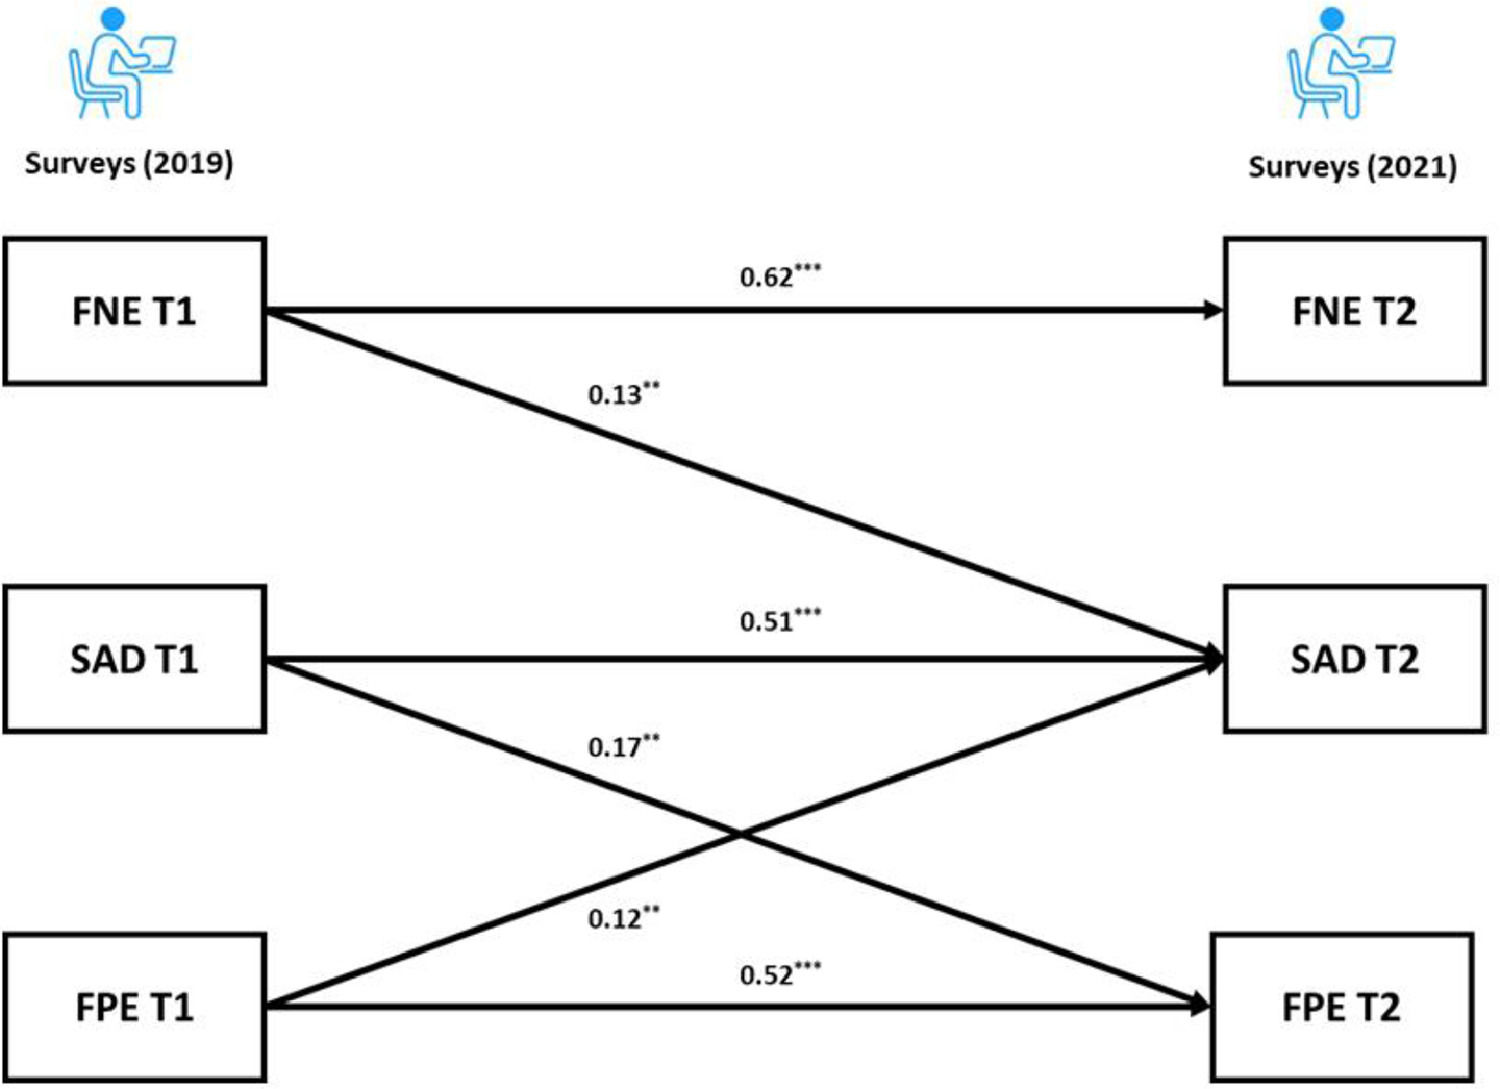
For the BL sample, the cross-lagged panel model results revealed that the autoregressive paths of the FNE, FPE and SAD were all significant (adjusted ps < 0.001) across the two time points. As for the cross-lagged effects, both the FNE and FPE at Time 1 (T1) predicted SAD at Time 2 (T2) (FNE: adjusted p = 0.004; FPE: adjusted p = 0.009). Furthermore, the FNE at T1 did not significantly predict the FPE at T2 (adjusted p = 0.603). Interestingly, the results showed a significant cross-lagged effect from SAD at T1 to FPE at T2 (adjusted p = 0.003). The coefficients of the cross-lagged panel model are provided in the supplementary materials. Following recommendation of Kline (2015), the final model (Fig. 2) had acceptable fit: χ2/df = 0.74, p = 0.534, CFI = 1.00, TLI = 1.00, RMSEA = 0.00, SRMR = 0.02.
Brain imaging results
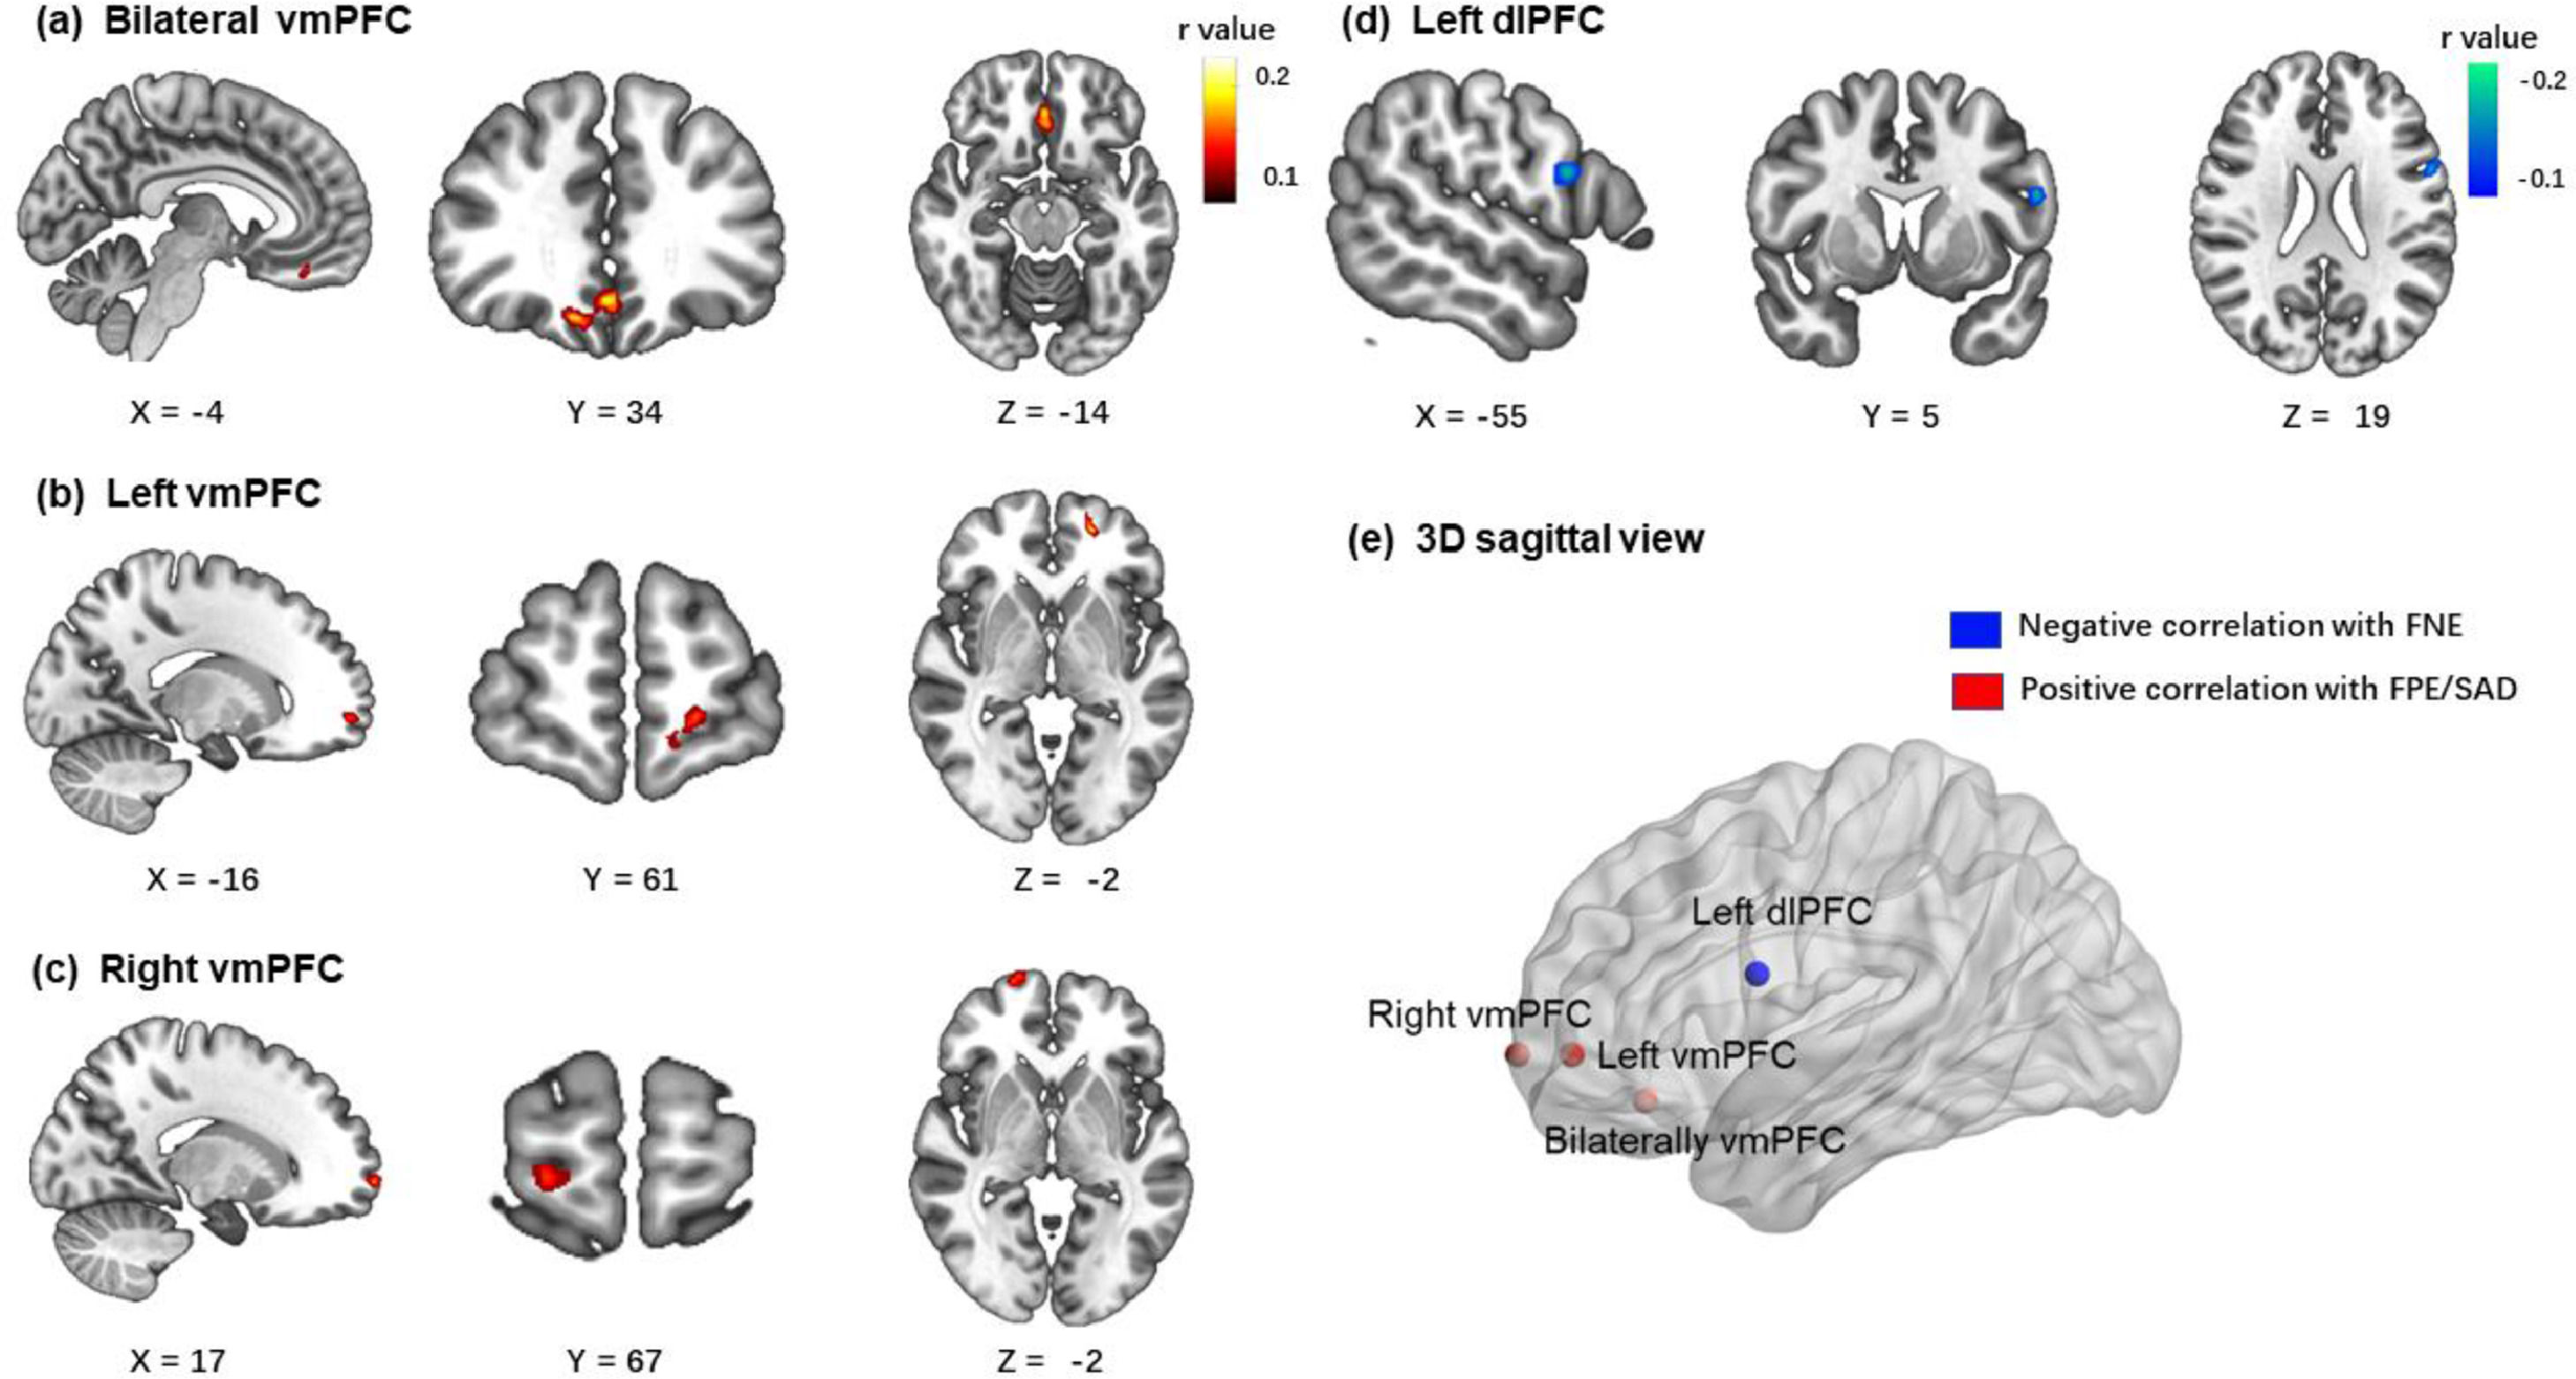
In the BBC sample, the brain imaging correlations corrected by GRF (voxel p < 0.001; cluster p < 0.05) revealed that the FNE was negatively associated with zfALFF signals in the left dorsolateral prefrontal cortex (x = -56, y = 4, z = 18, peak r = -0.18, voxels = 53). The FPE was positively associated with zfALFF signals in two clusters of ventromedial prefrontal cortex (bilateral vmPFC: x = 0, y = 34, z = -12, peak r = 0.19, voxels = 145; left vmPFC: x = -20, y = 54, z = -2, peak r = 0.19, voxels = 58). The SAD score was positively associated with zfALFF signals in the right vmPFC (x = 0, y = 34, z = -12, peak r = 0.17 voxels = 44). All results are presented in Fig. 3.
 between all three measures and zfALFF signals results (voxel p < 0.001; cluster p < 0.05, GRF corrected). (a, b) FPE were positively correlated with zfALFF signals in two clusters of ventromedial prefrontal cortex. (c) SAD were positively correlated with zfALFF signals in right vmPFC. (d) FNE were negatively correlated with zfALFF signals in the left dorsolateral prefrontal cortex. (e) The 3D sagittal view mapped where the 4 regions located in brain.")
The correlation results (age and gender as covariates) between all three measures and zfALFF signals results (voxel p < 0.001; cluster p < 0.05, GRF corrected). (a, b) FPE were positively correlated with zfALFF signals in two clusters of ventromedial prefrontal cortex. (c) SAD were positively correlated with zfALFF signals in right vmPFC. (d) FNE were negatively correlated with zfALFF signals in the left dorsolateral prefrontal cortex. (e) The 3D sagittal view mapped where the 4 regions located in brain.
Based on the results of zfALFF correlational analyses, we generated four masks and extracted the mean zfALFF signals from them. The correlational results with FDR corrections demonstrated the relationships between each measurement and the specific region's zfALFF signals (Table 3). Both FPE and SAD were positively correlated significantly with all three clusters of vmPFC. Given that this study did not have a priori hypothesis regarding lateralization of vmPFC, and that there is no conclusive discussion on the lateralization in the existing research (Konu et al., 2020; Rolls, 2022), we inferred that the three clusters of vmPFC might represent the same region and were separated due to strict GRF correction. To confirm this inference, a supplementary correlation analysis with a looser threshold was performed. Results showed that the three clusters were located in one joint cluster under a looser threshold (detailed results and visualization are provided in the supplementary materials). For these reasons, the three clusters’ masks of vmPFC were merged into one mask. Mean zfALFF signals were reextracted from the merged mask of vmPFC.
Pearson correlations between all measurements and the specific regions’ zfALFF signals in BBC sample (age and gender as covariates).
| L.dlPFC | B.vmPFC | L.vmPFC | R.vmPFC | |
|---|---|---|---|---|
| FNE | -0.171⁎⁎⁎ | -0.004 | 0.032 | 0.075 |
| FPE | -0.079 | 0.226⁎⁎⁎ | 0.194⁎⁎⁎ | 0.127⁎⁎ |
| SAD | -0.066 | 0.103⁎⁎ | 0.098⁎⁎ | 0.180⁎⁎⁎ |
Note: The correlation relationship between the specific regions’ zfALFF signals was not considered in this study and the correlation relationship between all behavioral measurements were reported in table 2, so they were not presented here. L.dlPFC = Left dorsolateral prefrontal cortex, B.vmPFC = Bilateral ventromedial prefrontal cortex, L.vmPFC = Left ventromedial prefrontal cortex, R.vmPFC = Right ventromedial prefrontal cortex. FDR correction was used to correct the p value ⁎⁎ adjusted p < 0.01, ⁎⁎⁎ adjusted p < 0.001.
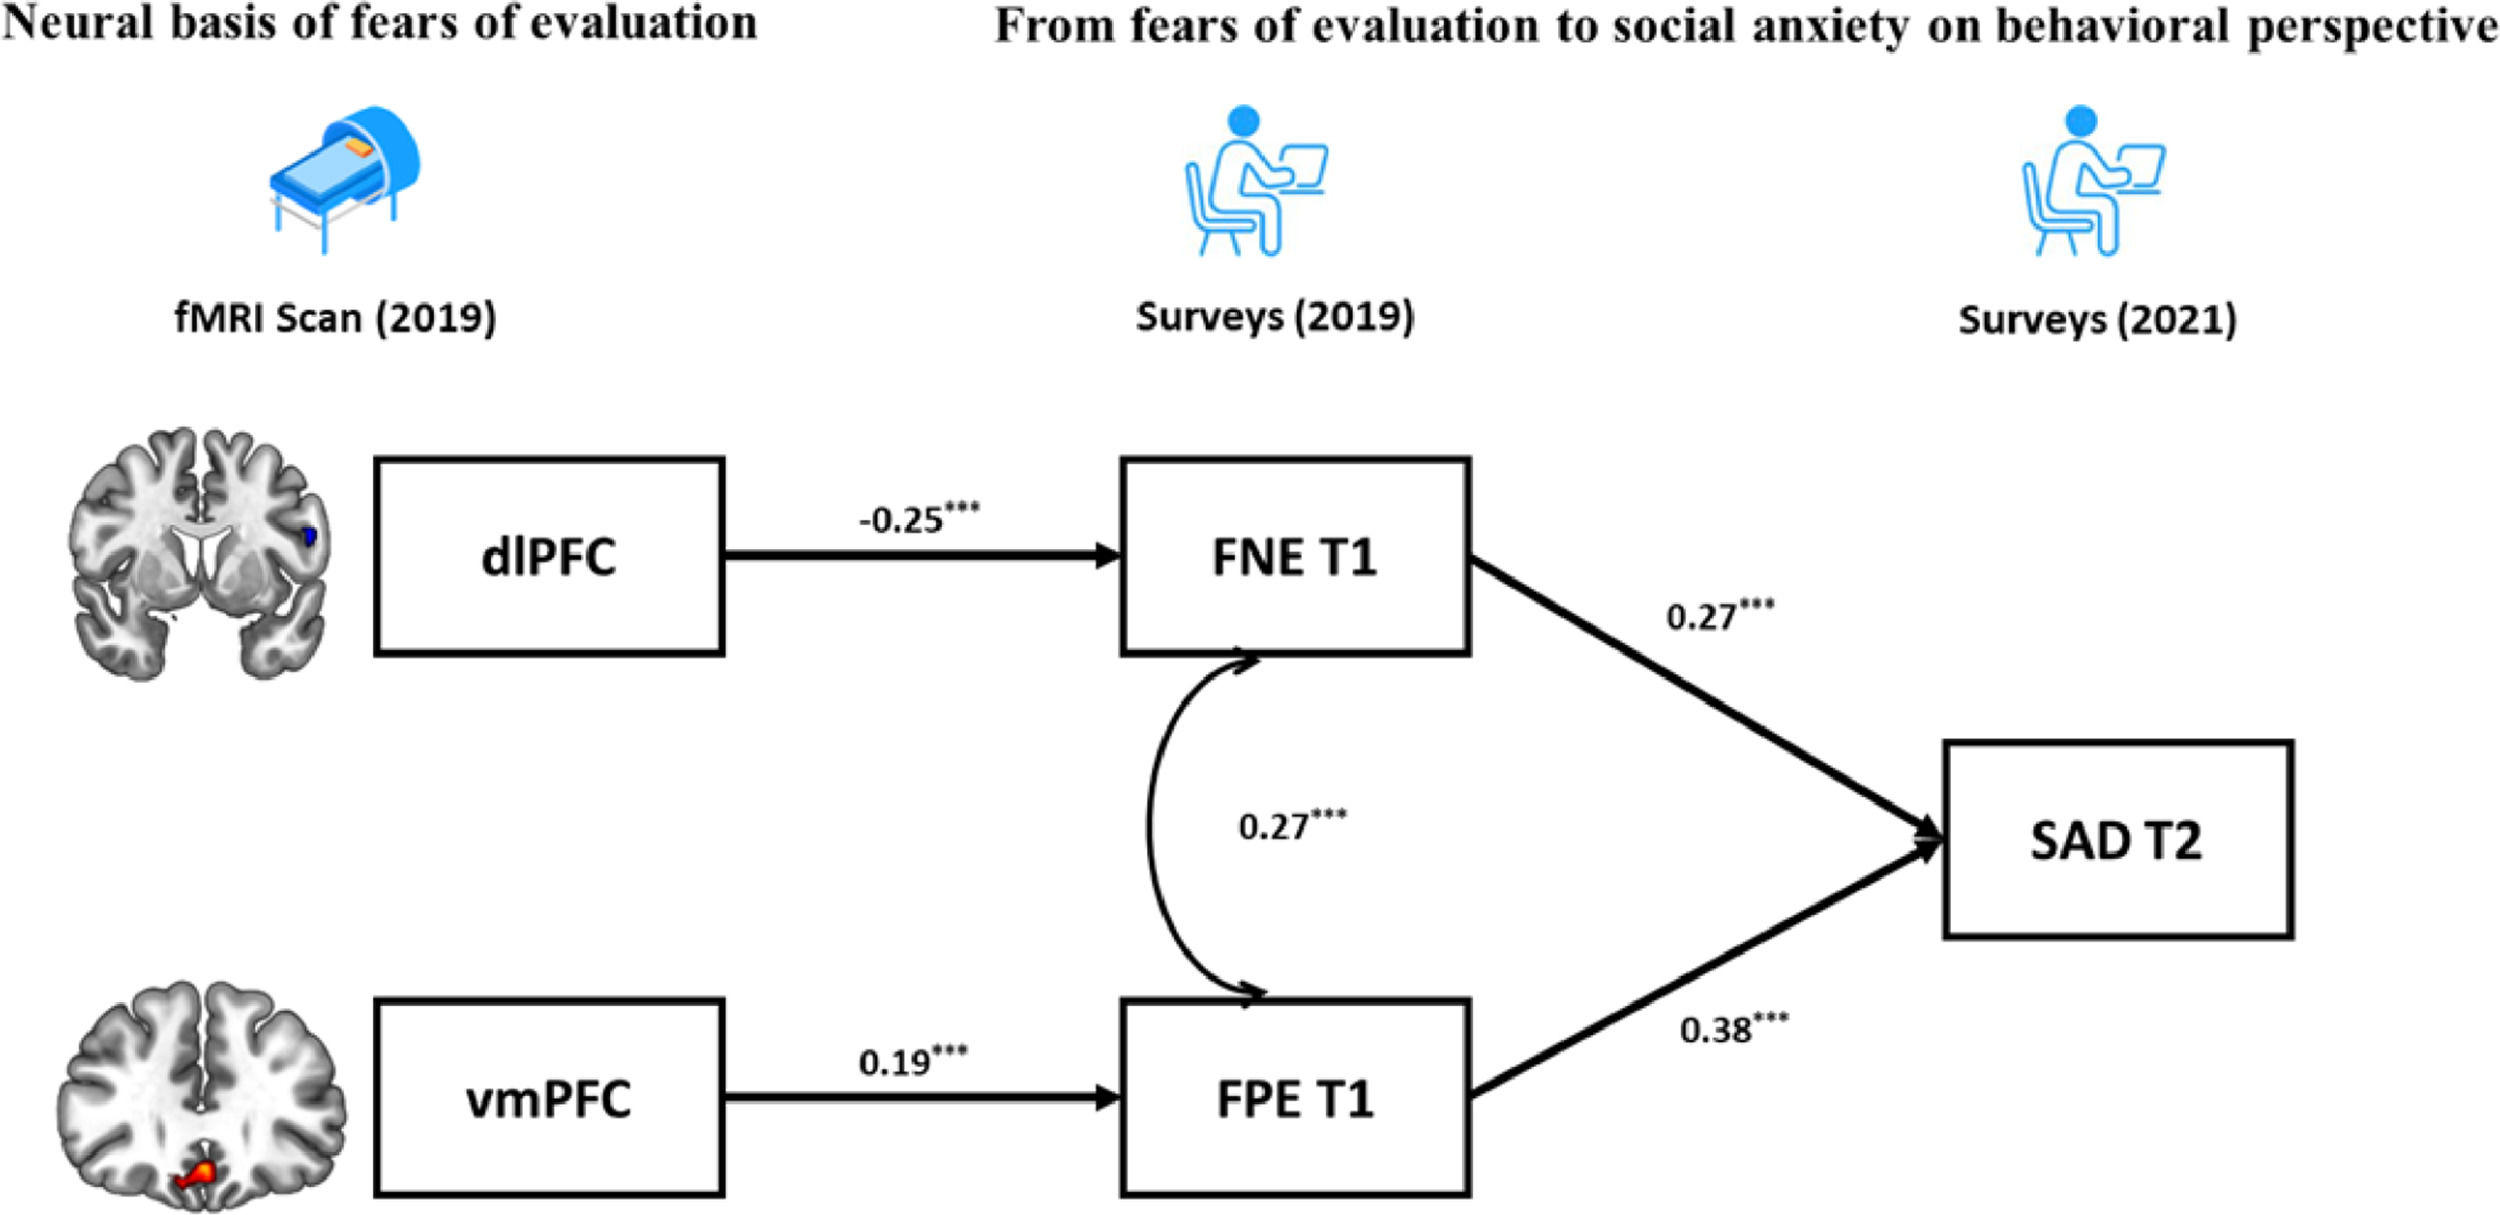
Finally, based on the BFOE hypothesis (which was supported by the behavior results) and the brain imaging results, a structural equation model integrating neural signals and behavioral relationships was established (Fig. 4). The zfALFF signals were considered as the neural basis of fears of evaluation, which in turn led to future SAD symptoms. Considering the correlations between the vmPFC and SAD symptoms, the direct effect from vmPFC to SAD symptoms was tested in the initial model. However, this pathway representing the effect from vmPFC to SAD symptoms was not significant and the initial model obtained suboptimal fit statistics (χ2/df = 3.26, p = 0.02, CFI = 0.96, TLI =0.87, RMSEA = 0.09, SRMR = 0.04). As such, we excluded it in the final brain-behavior model (Fig. 4), which demonstrated two indirect effects from two prefrontal signals to SAD symptoms, namely the dlPFC indirectly predicted SAD through negatively affecting FNE, and vmPFC indirectly predicted SAD through positively affecting FPE. The final model (Fig. 4) had an acceptable fit: χ2/df = 2.65, p = 0.03, CFI = 0.96, TLI =0.90, RMSEA = 0.07, SRMR = 0.05.
Discussion
The current study examined the behavioral and neural relationships between fears of evaluation and social anxiety. In the BL sample, the BFOE hypothesis was supported by the cross-lagged effects from FNE and FPE to SAD symptoms. To our surprise, the results also showed a significant cross-lagged effect from SAD symptoms to FPE. In the BBC sample, correlational analyses revealed that FNE was negatively related to fALFF signals in dlPFC whereas FPE and SAD were positively related to vmPFC signals. The brain-behavior results using the overlapping participants of the BL and BBC samples, demonstrated that the dlPFC and vmPFC serve as a neural basis of FNE and FPE distinctly, and that they eventually influence SAD symptoms through fears of evaluation. In sum, these findings provided a behavioral-neural perspective on the relationships between fears of evaluation and social anxiety; and this perspective have more causal credence than cross-sectional perspectives.
Our cross-lagged panel analyses showed that the autoregressive paths of FNE, FPE and SAD were all positively related and stable across two years, and both FNE and FPE predicted greater social anxiety symptoms two years later. These results are consistent with the BFOE perspective, which proposes that fears of evaluation are comprised of two related, but distinct constructs that lead to social anxiety symptoms (Reichenberger & Blechert, 2018; Weeks & Howell, 2014). FNE did not predict FPE in our samples, which did not support the delayed hypothesis. This is consistent with previous longitudinal studies results (Fredrick & Luebbe, 2022; Rodebaugh et al., 2012).
Furthermore, the unexpected link from SAD to FPE in the current study is consistent with Fredrick and Luebbe (2022). This finding may reflect a causal effect of psychopathology (i.e., social anxiety) on FPE. Researchers have argued that individuals with problematic social anxiety may experience interpretation bias of positive evaluation and disqualify positive social outcomes, which could lead to an increase in FPE (Cook et al., 2019; Fredrick & Luebbe, 2022; Reichenberger & Blechert, 2018). Similarly, Weeks and Zoccola (2016) found high social anxious individuals engaged in FPE (but not FNE) in response to social threat. As such, FPE may not only be a risk factor for but also a consequence of social anxiety, whereas FNE may only be a risk factor. From the perspective of psychopathology, FNE has been found to be related to not only social anxiety but also depression and eating disorder symptoms (Levinson & Rodebaugh, 2012; Weeks, 2015), serving as a transdiagnostic factor across different disorders. Taking into account our findings, it is possible that FPE is a unique factor that plays a key role in social anxiety. Future research that uncovers the unique role of FPE in social anxiety and its underlying mechanisms could contribute to a more comprehensive understanding of social anxiety.
The relationships between FNE, FPE and SAD have been examined using two perspectives. Some studies investigated FNE and FPE as cognitive components of SAD in clinical samples to provide evidence for its relationships with diagnosis and treatment (Reichenberger et al., 2019; Teale Teale Sapach et al., 2015). Other studies considered FNE and FPE as risk factors for SAD in healthy samples in an attempt to advance the understanding of the development of social anxiety symptoms (Cook et al., 2019; Fredrick & Luebbe, 2022; Yap et al., 2016). Based on the latter perspective, longitudinal designs can strengthen support in the idea that FNE and FPE are risk factors in SAD symptoms development. However, the current state of the field is that very few studies employed a longitudinal approach and those that did, reached inconsistent insights (Fredrick & Luebbe, 2022; Johnson et al., 2020; Rodebaugh et al., 2012). Thus, the current study aimed at shedding lighter on the associations among FPE, FNE and SAD by using a longer-time framework (2 years) and a larger sample than those typically used.
Although the accumulating evidence gradually supports the BFOE hypothesis (Cook et al., 2022), limited brain imaging research has been conducted to examine the BFOE framework. To provide insights on the neural basis of BFOE, the current study integrated fALFF signals and self-reported behavioral data. Results showed that prefrontal regions’ fALFF signals were relevant as hypothesized.
Results demonstrated that FNE was negatively correlated with the fALFF signals in the left dlPFC. This is in line with previous studies that found that SAD patients showed lower ALFF in dlPFC (Qiu et al., 2015; Yuan et al., 2018; Zhang et al., 2015). FNE, as core risk factor for SAD, has been argued to be correlated with dysfunction of downregulating the automatic response evoked by a negative evaluation (Heimberg et al., 2014), which may be mediated by the dlPFC that governs higher-level cognition and control in social situation (Squire et al., 2009). Similarly, Bishop (2007) highlights the top-down regulation of dlPFC in social threat situations, which could also explain our results. With lower fALFF signals in dlPFC, individuals may have difficulties regulating their responses to negative evaluations (e.g., ruminating negative feedback from others) in social situations, which could lead to further FNE (Wong & Moulds, 2009).
However, the current results did not reveal a correlation between SAD symptoms and dlPFC, which was not consistent with previous clinical findings (e.g., Qiu et al., 2015; Zhang et al., 2015). Shen et al. (2020) suggested that dlPFC is associated with anxiety symptoms’ illness duration rather than severity. That is, the dlPFC may be involved in the progression of social anxiety. Notably, our sample comprised of healthy individuals. This may explain why their SAD symptoms were not directly associated with dlPFC. However, the brain-behavior model revealed this developmental process via FNE and pointed to indirect association between the dlPFC and SAD.
Results demonstrated that both FPE and SAD symptoms were positively correlated with the fALFF signals in the vmPFC. This is in line with Qiu et al. (2015) who found that SAD patients show increased ALFF in vmPFC. In addition, Tian et al. (2016) found that positive ALFF signal in vmPFC predicts individual differences in trait anxiety. The vmPFC is related to a sequence of social cognitions and affective functions especially representing the value-based reward judgement (Hiser & Koenigs, 2018). According to Weeks and Howell (2012)’s view of the BFOE hypothesis, positive evaluation is seen as a threat of social competition. Therefore, abnormally higher fALFF in vmPFC may impair individuals’ ability to receive and code the social positive rewards, which could result in FPE and in turn SAD symptoms. The brain-behavior model results revealed that the association between vmPFC activity and SAD symptoms was fully mediated by FPE. This was similar to the mediating mechanism between dlPFC and SAD. These findings suggest that the abnormal prefrontal fALFF signals may be the early neural representation of SAD symptoms, although they are not correlated directly. They further suggest that different subregions have an impact respectively on different valence of fears of evaluation and lead to further SAD symptoms. In our brain-behavior model, we only considered FPE as a risk factor of SAD symptoms rather than including their bidirectional relationship. This is because the BFOE framework does not include such bisectional associations. Thus, an exploratory analysis carried (see supplementary materials). Results suggested that the vmPFC is the neural basis of FPE and SAD. It further models and points to the reciprocal relationship between FPE and SAD. This finding is novel. It suggests that the relations among FPE, SAD, and neural signals need to be more carefully examined in the future.
Our findings have important clinical implications. First, our longitudinal data support the BFOE hypothesis and suggest FNE and FPE as respective risk factors for SAD. These findings extend the existing literature by providing more solid evidence with long-term longitudinal data, which contribute to a more comprehensive understanding of the relationships between fears of evaluation and SAD. This knowledge may enhance our understanding of the development of SAD and assist early identification of this condition. Second, the result showed that FPE is not only a risk factor but also the consequence of SAD. This echoes the view of reciprocal relations models which suggested that SAD symptoms and related traits (e.g., self-critical perfectionism, FPE) could have a causal role in the development of one another (Gautreau et al., 2015; Widiger & Smith, 2008). This finding underscores the more important role of FPE (compared do FNE) in the development and maintenance of SAD (at least in healthy young adults). FPE form a destructive positive feedback loop which may lead to SAD symptoms. As such, treatment protocols that target FPE should be developed and evaluated. Indeed, research on interventions targeting FPE is insufficient. Cook et al. (2022) proposed that FPE should be integrated within existing Cognitive Behavior Therapy protocols. Finally, the neural findings implicate that the prefrontal cortex is a key region that mediates fears of evaluation. Brehl et al. (2020) suggested that prefrontal cortex could serve as a biomarker in pathology-based diagnosis and treatment. Indeed, several protocols based on non-invasive brain stimulation targeting prefrontal region have been developed and shown to reduce SAD-related symptoms(Clarke et al., 2020; Heeren et al., 2016). Under the BFOE framework, researches should further consider subregions of the prefrontal cortex (i.e., dlPFC, vmPFC) and examine their responses to distinct fears of social evaluations in treatments for SAD.
Several limitations of this study are noteworthy. First, using a sample of healthy young adults may limit the potential applicability towards diagnosis and interventions. Future research should replicate the current study design by using clinical samples. Second, given the limitation of the data structure, it was hard to uncover strong causal relations between neural signals and behavioral measurements. In the future, more longitudinal measurements and experimental design should be considered. Finally, the fALFF signals only reflect the power of local neuronal activities. Thus, future investigations using resting state connectivity analysis (e.g., by using Dynamic causal modelling) could explain further neural substrates. Note that the current resting-state fMRI results only demonstrated the aberrant fALFF in prefrontal cortex. However, no other widely reported region (e.g., amygdala) was related to fears of evaluation or SAD symptoms (Klumpp & Fitzgerald, 2018; Wang et al., 2022). To explain this finding, Qiu et al. (2015) suggested a compensatory mechanism between prefrontal and limbic regions and Wang et al. (2022) argued that the amygdala is a central element in one's threat detection network. Thus, the amygdala may not be so sensitive in regional spontaneous brain activities during resting-state fMRI scans (Bishop, 2008; Öhman, 2005). Thus, these explanations and the prefrontal-limbic circuitry that may underlie SAD require further research.
ConclusionThe present study examined the relationships among FNE, FPE and SAD using two-years longitudinal data. Results demonstrated that both FNE and FPE could predict SAD symptoms independently and that SAD symptoms could also predict subsequent FPE. Next, the fALFF metric were used to investigate the neural basis of FNE, FPE and SAD. They revealed that the dlPFC signals were negatively associated with FNE, whereas the vmPFC signals were positively related to FPE and SAD. Finally, a brain-behavior model was built to integrate fALFF results and the BFOE model. It revealed that abnormal prefrontal cortex signals influenced SAD symptoms via fears of evaluation. Overall, the present study provides a unique joint behavioral longitudinal and neural perspectives on the processes that link fears of evaluation to social anxiety. The findings contribute to a better theorical understanding of SAD, and can serve as a basis for intervention research that can help clinical practice.
This work was supported by research grants from the National Natural Science Foundation of China (31972906), Natural Science Foundation of Chongqing (cstc2020jcyj-msxmX0215), Fundamental Research Funds for the Central Universities (SWU2209235), the Innovation Research 2035 Pilot Plan of Southwest University (SWUPilotPlan006), the High-end Foreign Expert Introduction Program (G2022168001L), and the Open Research Fund of the State Key Laboratory of Cognitive Neuroscience and Learning (CNLZD2102).
