


This paper aimed to validate the Spanish version of scores of the Visual Analogue Scale for Anxiety-Revised (VAA-R) in child population, and to verify the existence of anxiety profiles and to relate them to school refusal.
MethodThe sample was made up of 911 Spanish students between 8 and 12 years old (M = 9.61, SD = 1.23). The measures used were the VAA-R and the School Refusal Assessment Scale-Revised for Children (SRAS-R-C).
ResultsConfirmatory factorial analysis supported the three-dimensional VAA-R structure: Anticipatory Anxiety (AA), School-based performance Anxiety (SA) and Generalized Anxiety (GA). The VAA-R has an adequate reliability and structural invariance across sex and age. No latent mean differences were found across sex, but did occur through age in AA and GA factors. Cluster analysis identified four child anxiety profiles: High Anxiety, High Anxiety School-type, Low Anxiety, and Moderate Anxiety, which differed significantly in all dimensions of school refusal.
ConclusionsThese findings may be useful for the assessment and treatment of anxious symptoms originated at school.
Este trabajo tuvo como objetivo validar la versión española de las puntuaciones de la Visual Analogue Scale for Anxiety-Revised (VAA-R) en población infantil, y comprobar la existencia de perfiles de ansiedad y relacionarlos con el rechazo escolar.
MétodoLa muestra estuvo conformada por 911 alumnos españoles entre 8 y 12 años (M = 9,61; DT = 1,23). Las medidas usadas fueron la VAA-R y la School Refusal Assessment Scale-Revised for Children (SRAS-R-C).
ResultadosEl análisis factorial confirmatorio apoyó la estructura tridimensional de la VAA-R: Ansiedad Anticipatoria (AA), Ansiedad de ejecución en la Escuela (AE) y Ansiedad Generalizada (AG). La VAA-R posee una adecuada fiabilidad e invarianza estructural en función del sexo y de la edad. No se encontraron diferencias de medias latentes en función del sexo, pero sí a través de la edad en los factores AA y AG. Los análisis de conglomerados identificaron cuatro perfiles de ansiedad infantil: Alta Ansiedad, Alta Ansiedad de tipo Escolar, Baja Ansiedad y Moderada Ansiedad, que difirieron significativamente en todas las dimensiones de rechazo escolar.
ConclusionesEstos hallazgos pueden resultar útiles para la evaluación y el tratamiento de síntomas ansiosos originados en la escuela.
Anxiety disorders are characterized by the manifestation of excessive fears to certain stimuli, resulting in maladaptive avoidance behavior (Taboas, Ojserkis, & McKay, 2015). These disorders tend to appear in childhood or adolescence (Essau, Lewinsohn, Olaya, & Seeley, 2014) and there is a risk of continuing until the adult stage (Rodríguez-Testal, Senín-Calderón, & Perona-Garcelán, 2014; Schönfeld, Brailovskaia, & Margraf, 2017). In this sense, Orgilés, Méndez, Espada, Carballo and Piqueras (2012) conducted a study with Spanish children and adolescents between 8 and 17 years old. They analyzed the differences according to sex and age in the presence of anxiety disorders: separation anxiety disorder, specific phobia, social anxiety disorder, generalized anxiety disorder and agoraphobia. Sex differences were statistically significant for all the disorders, with higher scores in females. This finding is consistent with international scientific literature (e.g., Kozina, 2014). Regarding age, they found statistically significant differences in all the disorders except for specific phobia. In the same vein, numerous researchers have indicated that at older age, fewer manifestations of separation anxiety disorder (e.g., Arendt, Hougaard, & Thastum, 2014; Gormez et al., 2017) but greater symptomatology of anticipatory anxiety (e.g., Orgilés, Espada, García-Fernández, & Méndez, 2009), social anxiety disorder (e.g., Arendt et al., 2014) and generalized anxiety disorder (e.g., Kozina, 2014). Anxiety disorders in childhood and adolescence can be originated by school dimensions that students perceive as threatening and/or dangerous, such as difficulty of tasks or competitiveness among equals (e.g., Yoo et al., 2016).
These findings demonstrate the need for clinical and educational psychologists to have instruments, with valid and reliable scores, that allow early identification of anxiety disorders produced in the school environment. However, only one scale has been specifically built and validated for that purpose: the Visual Analogue Scale for Anxiety-Revised (VAA-R; Bernstein & Garfinkel, 1992). The VAA-R is a self-report measure that detects nature of anxiety symptoms in children and adolescents with school refusal (i.e., in those who show resistance to attending school), and the school situations that originate them. Bernstein and Garfinkel (1992) assessed its psychometric properties using two differentiated samples: one clinical, with American students between 8 and 17 years old (M = 13.5, SD = 2.3) diagnosed with school refusal, and the other one was a community sample with students between 14 and 19 years old. The scale proved to be reliable: Cronbach's alpha of .80 in the clinical sample and .78 in the community sample. In addition, female participants of the clinical sample scored significantly higher in the VAA-R. Regarding the internal structure of scores, the mentioned authors obtained a three-factor solution through a principal components analysis (PCA): Anticipatory Anxiety (AA), which includes five items referring to situations that precede arrival at school; School-based performance Anxiety (SA), whose three items show school situations that can develop into social anxiety disorder; and Generalized Anxiety (GA), with three items that assess anxiety responses related to generalized anxiety disorder. Psychometric properties of the VAA-R have not been analyzed in Spanish population.
On the other hand, knowledge about anxious profiles and differences among them in relation to other constructs is limited. In this vein, Martínez-Monteagudo, Inglés, Trianes and García-Fernández (2011) established profiles of Spanish adolescents with school anxiety between 12 and 16 years (M = 13.71, SD = 1.47) from situational factors. Nevertheless, the existence of child anxiety profiles is unknown.
Scientific interest in school refusal has steadily grown (García-Fernández et al., 2016). Moreover, recent studies have revealed comorbidity between this construct and anxiety disorders (e.g., Inglés, Gonzálvez, García-Fernández, Vicent, & Martínez-Monteagudo, 2015). In this sense, validations of the School Refusal Assessment Scale-Revised for Children (SRAS-R-C; Higa, Daleiden, & Chorpita, 2002; Kearney, 2002) and other subsequent investigations (Gómez-Núñez et al., 2017; Hendron, 2011; Kearney & Albano, 2004) have analyzed the relationship between anxiety disorders and the school refusal profiles of the instrument: I) Avoidance of stimuli that provoke negative affectivity; II) Escape from aversive social and/or evaluative situations; III) Pursuit of attention from significant others; and IV) Pursuit of tangible reinforcement outside of school. These studies agree on the fact that students who get higher scores in anxiety disorders are those who get significantly higher scores in refusal for negative reinforcement (factors I and II). However, students with lower scores in anxiety disorders show significantly higher scores in factor IV, since this type of refusal is more associated with behavioral disorders. Therefore, it is necessary to study the relationship between possible anxious profiles and school refusal factors.
In order to overcome the shortcomings above-mentioned, the general aim of this work is twofold: to validate scores of the VAA-R in Spanish child sample between 8 and 12 years old, and to examine the relationship between anxiety profiles and school refusal scores. The specific objectives are: (a) to test the adjustment model of the VAA-R; (b) to confirm its reliability; (c) to examine the factorial invariance and the latent mean differences across sex and age groups; (d) to verify whether there are profiles of students with child anxiety; and (e) to relate the possible profiles to the variable of school refusal. Considering the previous empirical evidence on this theme, it is expected that: 1) the Spanish version of the VAA-R presents the three-dimensional structure (Bernstein & Garfinkel, 1992); 2) it shows adequate reliability indexes (Bernstein & Garfinkel, 1992); 3) it remains invariant across sex and age; 4) girls present significantly higher latent mean scores (Bernstein & Garfinkel, 1992; Kozina, 2014; Orgilés, Méndez, Espada, Carballo, & Piqueras, 2012); 5) 8-year-old students show less anxiety than the oldest groups for factors AA, SA and GA (Arendt et al., 2014; Kozina, 2014; Orgilés et al., 2009, 2012); 6) the combinations of the scores in the factors of the VAA-R result in anxious profiles (Martínez-Monteagudo, Inglés, Trianes, & García-Fernández, 2011); 7) the existence of statistically significant differences with large effect sizes between the highest and lowest anxiety profiles for factors I and II of the SRAS-R-C (Gómez-Núñez et al., 2017; Hendron, 2011; Higa et al., 2002; Kearney & Albano, 2004; Kearney, 2002).
MethodParticipantsFor this instrumental and quasi-experimental study (Montero & León, 2007) a random cluster sampling was performed, with the primary units being the provinces of Murcia and Alicante, the secondary units were the schools, and the tertiary units were the classrooms. 991 students from 3rd to 6th grade of Primary Education were recruited in eight schools. Nevertheless, 43 participants (4.33%) were excluded due to lack of informed consent from their parents, and 37 (3.73%) were excluded due to errors in their answers. Thus, the sample was composed of 911 students between 8 and 12 years old (M = 9.61, SD = 1.23), with 49.4% of girls. The distribution by age was as follows: 22.3% (n = 203) 8 years old, 28.3% (n = 258) 9 years old, 22.5% (n = 205) 10 years old, 19.4% (n = 177) 11 years old, and 7.5% (n = 68) 12 years old. The χ² test showed that there were no statistically significant differences according to sex x age (χ²(4) = 5.71, p = 0.22). The sociocultural context was assessed using an ad hoc questionnaire that reported the parents’ level of studies: school graduate (9.85% of the fathers and 10.20% of the mothers), secondary studies of vocational training or baccalaureate (68.43% of fathers and 66.57% of mothers) and university studies (18.28% of fathers and 14.11% of mothers). The remaining percentage of fathers and mothers did not provide information about it.
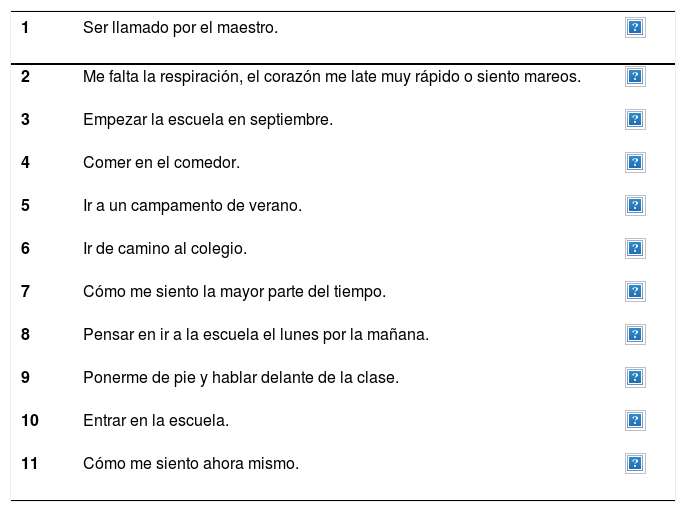
InstrumentsVisual Analogue Scale for Anxiety-Revised (VAA-R; Bernstein & Garfinkel, 1992). The VAA-R is a scale that assesses anxiety in child and adolescent population. It is composed by the three factors mentioned in the introduction: AA, SA, and GA, which include a total of 11 items. The visual response scale consists of 10 points (steady vs. nervous). It has good internal consistency indexes: Cronbach’s alpha of .80 in clinical sample and .78 in community sample (Bernstein & Garfinkel, 1992). The back-translation method was used to adapt the VAA-R to Spanish. Two bilingual specialists translated it into Spanish and a native English speaker with Spanish language knowledge translated it backward. The three translators compared the back-translation with the original version to establish the degree of semantic and cultural equivalence. In this process, they identified no adequacy to the Spanish context in item 6 (riding the school bus), since in Spain most students do not use school buses. They therefore proposed “on my way to school” as the most appropriate translation. Two experts in Psychology compared the original and Spanish versions, assessing the writing of the items suggested by the translators. After contrasting their assessments, they unanimously approved the suitability of the final version for its implementation. Appendix 1.
School Refusal Assessment Scale-Revised for Children (SRAS-R-C; Kearney, 2002). The SRAS-R-C is a scale that assesses the causes of school refusal in children and adolescents. It consists of 24 items organized into the four factors named in the introduction. The Likert-type response scale has 7 points (0 = Never; 6 = Always). The Spanish version was used. It consists of 18 items, maintains the factorial structure, and has adequate reliability values: .70, .79, .87, and .72 (Gonzálvez et al., 2016).
ProcedureThe management team of the centers was interviewed to present the goals and request permission. Informed consent was also requested from the parents. The VAA-R and the SRAS-R-C were collectively administered in classroom during 35 minutes (five minutes orientations, 5-10 minutes the VAA-R, and 15-20 minutes the SRAS-R-C). A researcher was present to confirm the anonymity and the voluntary nature of the tests, explain the completion instructions, and solve doubts. This research was approved by the Ethics Committee of the University of Alicante and followed the ethical standards of the Declaration of Helsinki.
Statistical analysesThe internal structure of the VAA-R was tested using four confirmatory factor analyses (CFAs), corresponding to a null model, a 1-factor model, a 3-factor model (uncorrelated), and the 3-factor model (correlated) proposed by Bernstein and Garfinkel (1992). The multivariate kurtosis coefficient (Mardia coefficient) was 40.93, reflecting that there was no multivariate normality in data, since it is higher than 5 points (Bentler, 2005). Therefore, the Robust Maximum Likelihood (RML) and the Satorra-Bentler χ² scaled (S-Bχ²) were used. The model’s goodness-of-fit was determined by the next indexes: Robust Root Mean Square Error of Approximation (R-RMSEA): <.05 excellent, <.08 acceptable; Standardized Root Mean Square Residual (SRMR): <.05 good fit, close to .08 acceptable; Robust Comparative Fit Index (R-CFI): ≥.90 acceptable, ≥.95 good fit; Tucker Lewis Index (TLI): ≥.90 acceptable (Brown, 2006). The reliability of the total of the scale and its factors were analyzed calculating Cronbach’s alpha coefficients. Reliability coefficients were considered acceptable ≥.70, as long as these were not too high, which suggests the presence of redundant items (Cho & Kim, 2015).
A multigroup confirmatory factorial analysis (MGCFA) was used to test the configural, measurement (metric, strong or scalar, and strict) and structural invariance of the own model of the VAA-R across sex and age groups. Considering that Mardia coefficients were higher than 5 in all cases, the S-Bχ2 was used to adjust the base multigroup model (configural model). Then, several hierarchical steps were followed (Samuel, South, & Griffin, 2015). Firstly, it was verified whether the factorial structure of the configural model (Model 0) was similar among the sex and age groups without establishing equality constraints. Next, the metric invariance (Model 1) was tested imposing the constraint of equality of factor loadings among the groups. The strong or scalar invariance (Model 2) was analyzed by fixing equality of the factor loadings and the variables’ intercepts. Lastly, the strict invariance (Model 3) was tested constraining the factor loadings, the variables’ intercepts and the variances and covariances of the errors to be equal among the groups. Regarding the structural invariance (Model 4), it was verified whether all the latent or non-observed variables had the same relationship across sex and age by equaling the variances and covariances of the factors in Model 2. The models’ goodness-of-fit was determined by the indexes above-mentioned. Several invariance criteria among the nested models were calculated: the S-Bχ2 difference test (ΔS-Bχ²; p >.05) and the ΔR-CFI (ΔR-CFI <.01).
The study of latent means was performed across sex and age. The model for comparing sex groups used boys’ latent means as reference setting them to 0. The girls’ latent means were estimated freely. Three age models were established to make all possible group combinations. The latent means of the lowest age group were set to 0 in each model. The analysis of means variance was performed using the Critical Ratio (CR).
On the other hand, the correlations between the VAA-R and the SRAS-R-C were analyzed. Then, a cluster analysis was performed, using the non-hierarchical method of quick cluster analysis. Previously, the raw scores were standardized because the number of items of each factor of the VAA-R is different. The anxiety profiles were established from the possible combinations of z scores, which were interpreted according to the following criteria: z ≤ -.5 = low levels; -.5 ≤ z ≤ .5 = moderate levels; and z ≥ .5 = high levels (Sanmartín et al., 2018). The number of clusters was chosen using as criteria the maximization of inter-group differences.
Analyses of variance (ANOVA) were conducted to examine the differences among the anxiety profiles in the SRAS-R-C dimensions. In cases of statistical significance, post hoc tests (Scheffé method) were performed to identify among which groups the differences had been identified. The effect size was calculated using the d index to know the magnitude of the differences found. It was interpreted by means of the criteria: .20-.49 small; .50-.79 moderate; ≥.80 large (Cohen, 1988). SPSS/PC 24.0 and EQS 6.1 programs were used.
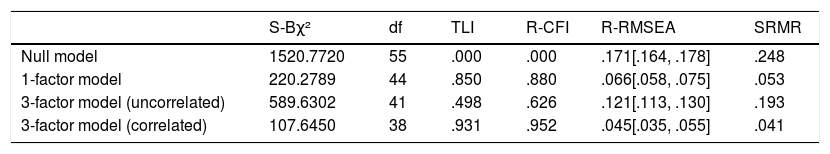
ResultsConfirmatory factor analyses and reliabilityTable 1 presents the goodness-of-fit indexes of the models tested by means of CFAs. The results suggest that the 3-factor model (correlated) of the VAA-R provides the best fit to the sample data. Cronbach’s alpha coefficient for the total of the scale was .89, and for each factor: .87 (AA), .76 (SA), and .70 (GA).
Goodness-of-fit indexes of the statistic models of the VAA-R.
| S-Bχ² | df | TLI | R-CFI | R-RMSEA | SRMR | |
|---|---|---|---|---|---|---|
| Null model | 1520.7720 | 55 | .000 | .000 | .171[.164, .178] | .248 |
| 1-factor model | 220.2789 | 44 | .850 | .880 | .066[.058, .075] | .053 |
| 3-factor model (uncorrelated) | 589.6302 | 41 | .498 | .626 | .121[.113, .130] | .193 |
| 3-factor model (correlated) | 107.6450 | 38 | .931 | .952 | .045[.035, .055] | .041 |
Note. p <.001 for the S-Bχ2 in all cases; S-Bχ2 = Satorra-Bentler χ² scaled; df = degrees of freedom; TLI = Tucker Lewis Index; R-CFI = Robust Comparative Fit Index; R-RMSEA = Robust Root Mean Square Error of Approximation; SRMR = Standardized Root Mean Square Residual.
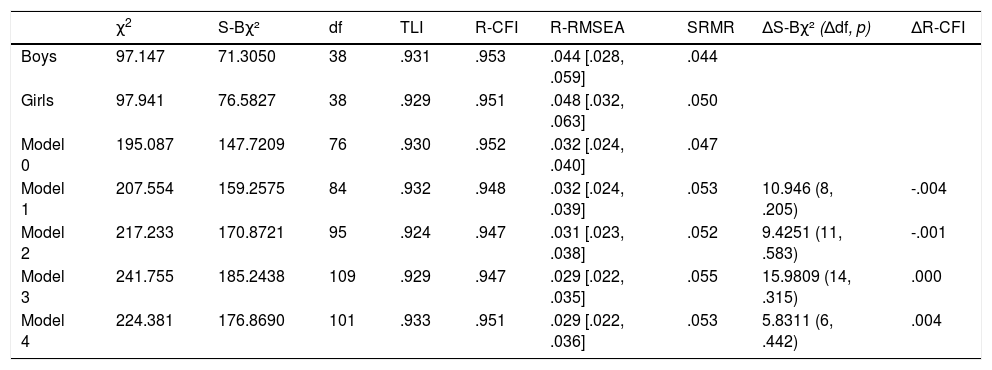
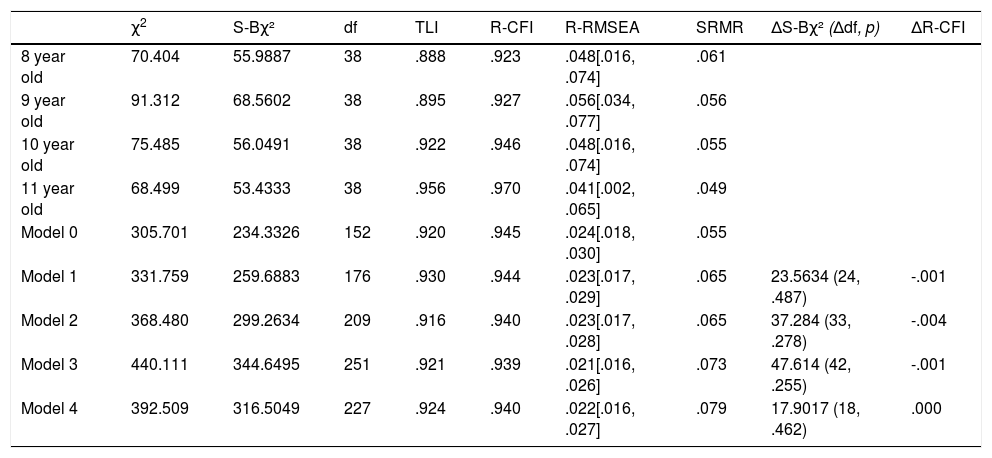
Tables 2 and 3 show the measurement and structural invariance levels according to sex and age, respectively. It is observed that for all models, both across sex and age, adequate goodness-of-fit indexes, a no significant p for ΔS-Bχ², and a ΔR-CFI value <.01 were obtained. This data highlights the measurement and structural invariance of the VAA-R across sex and age.
Goodness-of-fit indexes for the Spanish version of the VAA-R depending on sex.
| χ2 | S-Bχ² | df | TLI | R-CFI | R-RMSEA | SRMR | ΔS-Bχ² (Δdf, p) | ΔR-CFI | |
|---|---|---|---|---|---|---|---|---|---|
| Boys | 97.147 | 71.3050 | 38 | .931 | .953 | .044 [.028, .059] | .044 | ||
| Girls | 97.941 | 76.5827 | 38 | .929 | .951 | .048 [.032, .063] | .050 | ||
| Model 0 | 195.087 | 147.7209 | 76 | .930 | .952 | .032 [.024, .040] | .047 | ||
| Model 1 | 207.554 | 159.2575 | 84 | .932 | .948 | .032 [.024, .039] | .053 | 10.946 (8, .205) | -.004 |
| Model 2 | 217.233 | 170.8721 | 95 | .924 | .947 | .031 [.023, .038] | .052 | 9.4251 (11, .583) | -.001 |
| Model 3 | 241.755 | 185.2438 | 109 | .929 | .947 | .029 [.022, .035] | .055 | 15.9809 (14, .315) | .000 |
| Model 4 | 224.381 | 176.8690 | 101 | .933 | .951 | .029 [.022, .036] | .053 | 5.8311 (6, .442) | .004 |
Note. Model 0 = Free model; Model 1 = Model 0 with factor loadings; Model 2 = Model 1 with intercepts; Model 3 = Model 2 with variances and covariances of errors; Model 4 = Model 2 with variances and covariances of factors; S-Bχ2 = Satorra-Bentler χ² scaled; df = degrees of freedom; TLI = Tucker Lewis Index; R-CFI = Robust Comparative Fit Index; R-RMSEA = Robust Root Mean Square Error of Approximation; SRMR = Standardized Root Mean Square Residual; ΔS-Bχ² = S-Bχ² difference test; Δdf = difference between degrees of freedom; ΔR-CFI = R-CFI difference test.
Goodness-of-fit indexes for the Spanish version of the VAA-R depending on age groups.
| χ2 | S-Bχ² | df | TLI | R-CFI | R-RMSEA | SRMR | ΔS-Bχ² (Δdf, p) | ΔR-CFI | |
|---|---|---|---|---|---|---|---|---|---|
| 8 year old | 70.404 | 55.9887 | 38 | .888 | .923 | .048[.016, .074] | .061 | ||
| 9 year old | 91.312 | 68.5602 | 38 | .895 | .927 | .056[.034, .077] | .056 | ||
| 10 year old | 75.485 | 56.0491 | 38 | .922 | .946 | .048[.016, .074] | .055 | ||
| 11 year old | 68.499 | 53.4333 | 38 | .956 | .970 | .041[.002, .065] | .049 | ||
| Model 0 | 305.701 | 234.3326 | 152 | .920 | .945 | .024[.018, .030] | .055 | ||
| Model 1 | 331.759 | 259.6883 | 176 | .930 | .944 | .023[.017, .029] | .065 | 23.5634 (24, .487) | -.001 |
| Model 2 | 368.480 | 299.2634 | 209 | .916 | .940 | .023[.017, .028] | .065 | 37.284 (33, .278) | -.004 |
| Model 3 | 440.111 | 344.6495 | 251 | .921 | .939 | .021[.016, .026] | .073 | 47.614 (42, .255) | -.001 |
| Model 4 | 392.509 | 316.5049 | 227 | .924 | .940 | .022[.016, .027] | .079 | 17.9017 (18, .462) | .000 |
Note. Model 0 = Free model; Model 1 = Model 0 with factor loadings; Model 2 = Model 1 with intercepts; Model 3 = Model 2 with variances and covariances of errors; Model 4 = Model 2 with variances and covariances of factors; S-Bχ2 = Satorra-Bentler χ² scaled; df = degrees of freedom; TLI = Tucker Lewis Index; R-CFI = Robust Comparative Fit Index; R-RMSEA = Robust Root Mean Square Error of Approximation; SRMR = Standardized Root Mean Square Residual; ΔS-Bχ² = S-Bχ² difference test; Δdf = difference between degrees of freedom; ΔR-CFI = R-CFI difference test.
Acceptable values of fit statistics were obtained for the model of latent mean differences across sex: TLI = .922; R-CFI = .946; R-RMSEA = .033, 90% CI = .026, .040; SRMR = .054; S-Bχ² (92) = 230.691, p <.001.
With regard to age, all models also obtained satisfactory values: Model 1 taking 8-year-olds as reference (TLI = .915; R-CFI = .941; R-RMSEA = .026, 90% CI = .020, .031; SRMR = .065; S-Bχ²(200) = 391.833, p <.001); Model 2 taking 9-year-olds as reference (TLI = .924; R-CFI = .947; R-RMSEA = .028, 90% CI = .021, .035; SRMR = .061; S-Bχ²(146) = 282.548, p <.001); Model 3 taking 10-year-olds as reference (TLI = .942; R-CFI = .959; R-RMSEA = .033, 90% CI = .020, .044; SRMR = .057; S-Bχ²(92) = 169.000, p <.001).
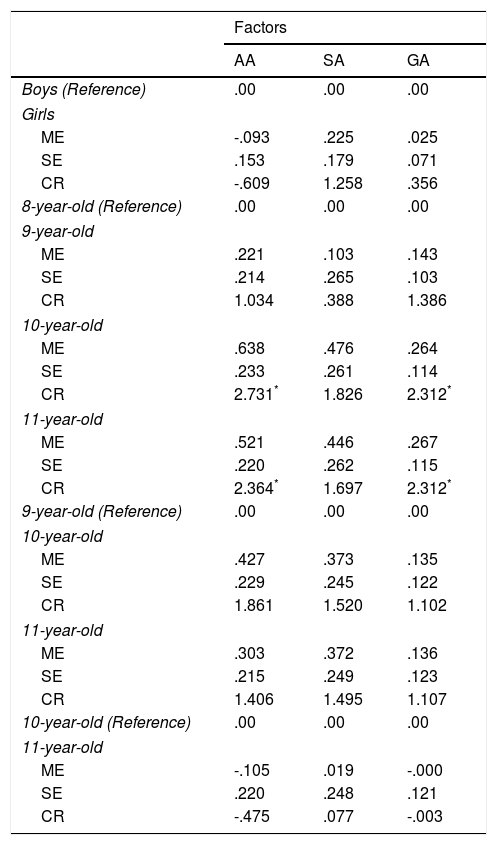
Considering Table 4, no statistically significant differences were found across sex for any factor. Regarding age groups, no significant differences were found in SA, but significant differences were observed in the remaining two factors. Thus, 8-year-olds had significantly lower latent means in AA and GA than 10- and 11-year-olds.
Scores of latent mean differences across sex and age groups for the Spanish version of the VAA-R.
| Factors | |||
|---|---|---|---|
| AA | SA | GA | |
| Boys (Reference) | .00 | .00 | .00 |
| Girls | |||
| ME | -.093 | .225 | .025 |
| SE | .153 | .179 | .071 |
| CR | -.609 | 1.258 | .356 |
| 8-year-old (Reference) | .00 | .00 | .00 |
| 9-year-old | |||
| ME | .221 | .103 | .143 |
| SE | .214 | .265 | .103 |
| CR | 1.034 | .388 | 1.386 |
| 10-year-old | |||
| ME | .638 | .476 | .264 |
| SE | .233 | .261 | .114 |
| CR | 2.731* | 1.826 | 2.312* |
| 11-year-old | |||
| ME | .521 | .446 | .267 |
| SE | .220 | .262 | .115 |
| CR | 2.364* | 1.697 | 2.312* |
| 9-year-old (Reference) | .00 | .00 | .00 |
| 10-year-old | |||
| ME | .427 | .373 | .135 |
| SE | .229 | .245 | .122 |
| CR | 1.861 | 1.520 | 1.102 |
| 11-year-old | |||
| ME | .303 | .372 | .136 |
| SE | .215 | .249 | .123 |
| CR | 1.406 | 1.495 | 1.107 |
| 10-year-old (Reference) | .00 | .00 | .00 |
| 11-year-old | |||
| ME | -.105 | .019 | -.000 |
| SE | .220 | .248 | .121 |
| CR | -.475 | .077 | -.003 |
Note. AA = Anticipatory Anxiety; SA = School-based performance Anxiety; GA = Generalized Anxiety; ME = Mean Estimate; SE = Standard Error; CR = Critical Ratio
Positive significant correlations (p < .001) were found between the first factor of the SRAS-R-C and AA (.45), SA (.36), GA (.34), and the total score of the VAA-R (.48) with moderate magnitude. Positive significant correlations (p < .001) were also found between the second factor of the SRAS-R-C and AA (.34), SA (.32), and the total score of the VAA-R (.40) with moderate magnitude, and between the second factor of the SRAS-R-C and AG (.27) with small magnitude. Positive significant correlations (p < .001) were obtained between the third factor of the SRAS-R-C and AA (.27), SA (.24), GA (.14), and the total score of the VAA-R (.27) with small magnitude. Correlations with factor IV of the SRAS-R-C were only significant (p < .001) but negative for SA (-.09) and the total score of the VAA-R (-.09) with small magnitude.
Identification of anxiety profiles in the VAA-RFour anxious groups were obtained (see Fig. 1). The first group (130 participants; 14.3%), which was called High Anxiety, presented high scores in the three factors. The second group (183 participants; 20.1%) was characterized by high scores in AA and SA, and moderately low scores in GA. Since the factors AA and SA are related to the school environment, this profile was named High Anxiety School-type. The third group (341 participants; 37.4%) obtained low scores in the three factors, so it was designated as Low Anxiety. The fourth group (257 participants; 28.2%), which was named Moderate Anxiety, scored moderately low in AA and moderately high in SA and GA.
Differences among the anxiety profiles in school refusal
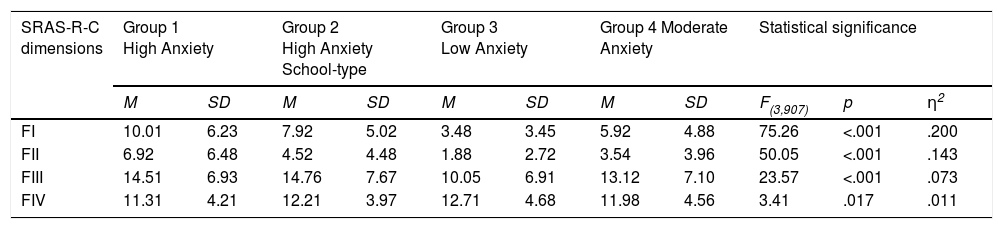
Statistically significant differences were found among the four anxious groups in all the SRAS-R-C dimensions (see Table 5). The Low Anxiety group obtained the lowest means in the first three factors, and the highest mean in the fourth factor. In contrast, the High Anxiety group presented the highest means in the first two factors, and the lowest mean in the fourth factor. The High Anxiety School-type group scored the highest mean in the third factor.
Means and standard deviations obtained by the four child anxiety groups and effect size for each SRAS-R-C dimension.
| SRAS-R-C dimensions | Group 1 High Anxiety | Group 2 High Anxiety School-type | Group 3 Low Anxiety | Group 4 Moderate Anxiety | Statistical significance | ||||||
|---|---|---|---|---|---|---|---|---|---|---|---|
| M | SD | M | SD | M | SD | M | SD | F(3,907) | p | η2 | |
| FI | 10.01 | 6.23 | 7.92 | 5.02 | 3.48 | 3.45 | 5.92 | 4.88 | 75.26 | <.001 | .200 |
| FII | 6.92 | 6.48 | 4.52 | 4.48 | 1.88 | 2.72 | 3.54 | 3.96 | 50.05 | <.001 | .143 |
| FIII | 14.51 | 6.93 | 14.76 | 7.67 | 10.05 | 6.91 | 13.12 | 7.10 | 23.57 | <.001 | .073 |
| FIV | 11.31 | 4.21 | 12.21 | 3.97 | 12.71 | 4.68 | 11.98 | 4.56 | 3.41 | .017 | .011 |
Note. FI = Avoidance of stimuli that provoke negative affectivity; FII = Escape from aversive social and/or evaluative situations; FIII = Pursuit of attention from significant others; FIV = Pursuit of tangible reinforcement outside of school.
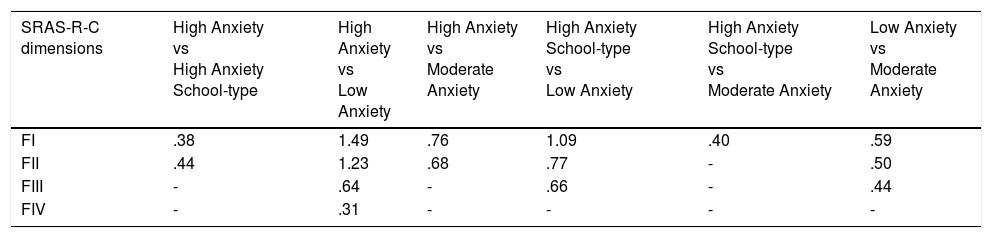
The post hoc analyses (see Table 6) revealed statistically significant differences between the High Anxiety and the High Anxiety School-type groups in the first two factors of the SRAS-R-C, with small effect sizes. The High Anxiety and Low Anxiety groups differed significantly, with large (factors I and II), moderate (factor III), and small effect sizes (factor IV). Significant differences were found between the High Anxiety and Moderate Anxiety groups with moderate effect sizes (factors I and II). Significant differences were observed between the High Anxiety School-type and Low Anxiety groups with large (factor I) and moderate effect sizes (factors II and III). The High Anxiety School-type and Moderate Anxiety groups differed significantly with small effect size (factor I). Lastly, significant differences were found between the Low Anxiety and Moderate Anxiety groups with moderate (factors I and II) and small effect sizes (factor III).
Cohen’s d value for post hoc contrasts between the mean scores obtained by the four child anxiety groups in the SRAS-R-C factors.
| SRAS-R-C dimensions | High Anxiety vs High Anxiety School-type | High Anxiety vs Low Anxiety | High Anxiety vs Moderate Anxiety | High Anxiety School-type vs Low Anxiety | High Anxiety School-type vs Moderate Anxiety | Low Anxiety vs Moderate Anxiety |
|---|---|---|---|---|---|---|
| FI | .38 | 1.49 | .76 | 1.09 | .40 | .59 |
| FII | .44 | 1.23 | .68 | .77 | - | .50 |
| FIII | - | .64 | - | .66 | - | .44 |
| FIV | - | .31 | - | - | - | - |
Note. FI = Avoidance of stimuli that provoke negative affectivity; FII = Escape from aversive social and/or evaluative situations; FIII = Pursuit of attention from significant others; FIV = Pursuit of tangible reinforcement outside of school.
The first general aim of the study was to validate scores of the VAA-R in a Spanish child sample. As expected in the first hypothesis, the three-dimensional model proposed by Bernstein and Garfinkel (1992) has been replicated for the first time in this sample. The results also support the second hypothesis, since the VAA-R has shown reliability levels ≥.70, but not too high (Cho & Kim, 2015), for its three factors. Cronbach’s alpha coefficient for the total of the scale using community sample was also satisfactory. Therefore, this finding is consistent with the original validation (Bernstein & Garfinkel, 1992). It is presented the first evidence about the invariance of the VAA-R across sex and age, corroborating the third hypothesis.
Regarding the latent mean differences, the results across sex refuse the fourth hypothesis given that no statistically significant differences were found for any factor. In contrast, previous studies obtained significantly higher latent means for the female sex (Bernstein & Garfinkel, 1992; Kozina, 2014; Orgilés et al., 2012). However, girls scored higher in SA and GA in the present study.
The fifth hypothesis is corroborated, since 8-year-old students had significantly lower latent means in AA than 10- and 11-year-old students. This finding follows the trend of school fears involving anticipatory anxiety (e.g., Orgilés et al., 2009), but not the trend of separation anxiety disorder (e.g., Arendt et al., 2014; Gormez et al., 2017; Orgilés et al., 2012). This is due to the fact that the items of the factor AA are mainly linked to the anticipation of arrival at school, although they reflect a certain relationship with the anxiety to be separated from affective figures. Despite the fact that social anxiety disorder symptoms increase with age (e.g., Arendt et al., 2014; Orgilés et al., 2012), no significant latent mean differences were found in SA. However, 10- and 11-year-old students scored higher than 8- and 9-year-olds, and 11-year-olds scored higher than 10-year-olds. In line with Kozina (2014) and Orgilés et al. (2012), 8-year-old students reported suffering less generalized anxiety disorder symptoms, with significantly lower latent means in GA than older students.
The second general aim was to analyze the relationship between anxiety profiles and school refusal. In this sense, the sixth hypothesis is supported by the four profiles that, in line with Martínez-Monteagudo et al. (2011), could be configured by combining standardized scores. The findings support the seventh hypothesis given that the significant differences with larger effect sizes were identified between the High Anxiety and Low Anxiety groups for factors I and II of the SRAS-R-C. Therefore, these are the factors that mainly justify school refusal due to anxiety, following the line of Gómez-Núñez et al. (2017); Hendron (2011); Higa et al. (2002); Kearney (2002), and Kearney and Albano (2004). It should be added that these works did not identify relationship of factor IV with anxiety, but obtained a positive significant correlation of factor IV with externalizing behaviors and oppositional defiant disorder. In the present study, the Low Anxiety profile scored significantly higher in the fourth factor, which confirms the need to consider variables other than anxiety when analyzing this factor.
This research has several limitations. Firstly, by using a community sample no knowledge about validity of scores of the VAA-R has been obtained for Spanish children diagnosed clinically. Nor has it been confirmed the convergent validity of this scale with other anxiety measures (e.g., Spanish short form of the State-Trait Anxiety Inventory; Buela-Casal & Guillén-Riquelme, 2017). The concreteness of the study of anxiety profiles in child population has not allowed knowing their evolution in adolescence. Finally, it is necessary to consolidate and expand the scientific contribution of this work regarding the relationship between anxiety and school refusal, using the profiles found and analyzing the possible causal relationship with the scores of the SRAS-R-C (Inglés et al., 2015). The predictive capacity of sex and age in the anxious profiles should also be examined using, for example, a multinomial logistic regression model.
Despite the limitations, the present study provides relevant practical implications. Regarding the assessment, a specific visual analogue scale for the self-report of anxious symptoms originated at school has been validated for the first time in a Spanish child sample. With regard to the treatment, the High Anxiety profile has shown greater scores of school refusal due to negative reinforcement than the other profiles. This result suggests the application of cognitive-behavioral programs (Bornas, de la Torre-Luque, Fiol-Veny, & Balle, 2017; Taboas et al., 2015), which enhance emotional self-protection (e.g., FORTIUS Program; Méndez, Llavona, Espada, & Orgilés, 2012).
FundingThis study was supported by the Spanish Ministry of Science and Innovation [EDU2012-35124], the University of Alicante [GRE16-07], and the Ministry of Education, Culture and Sport [FPU16-01386].
A continuación encontrarás una serie de frases que te hablan de situaciones relacionadas con el colegio. Tu tarea consiste en valorar de 0 a 10 lo nervioso que pueden ponerte estas situaciones. Para ello, debes leer cada frase, fijarte en la regla que encontrarás a su lado y rodear el número que mejor describa tu grado de nerviosismo ante esa situación. No existen respuestas correctas o incorrectas.
| 1 | Ser llamado por el maestro. | |
|---|---|---|
| 2 | Me falta la respiración, el corazón me late muy rápido o siento mareos. | |
| 3 | Empezar la escuela en septiembre. | |
| 4 | Comer en el comedor. | |
| 5 | Ir a un campamento de verano. | |
| 6 | Ir de camino al colegio. | |
| 7 | Cómo me siento la mayor parte del tiempo. | |
| 8 | Pensar en ir a la escuela el lunes por la mañana. | |
| 9 | Ponerme de pie y hablar delante de la clase. | |
| 10 | Entrar en la escuela. | |
| 11 | Cómo me siento ahora mismo. |
