


Studies of the dimensionality of the Life Orientation Test-Revised (LOT-R), considered as the gold standard in the measurement of dispositional optimism, yield controversial results due to the various factorial solutions found. Consequently, the factorial structure of the test has not yet been fully established. The aim of this study is to determine the factorial structure of the LOT-R by comparing seven previous models and their empirical evidence. The test was administered to 906 Spanish participants, ages 18 to 61 (mean age: 23; 56% males). Confirmatory factor analyses were conducted using polychoric correlations. Considering the theoretical background and the best model fit indices (RMSEA=.038; CFI=.98), we conclude that the test presents a factorial structure of a second-order factor (life orientation) composed of two factors (optimism and pessimism). Thus, we recommend using a single global score that could be referred to as life orientation but which ultimately represents the level of dispositional optimism.
Los estudios sobre la dimensionalidad del Test de Orientación Vital-Revisado (LOT-R), considerado el estándar en la medida del optimismo disposicional, resultan controvertidos al encontrar diversas soluciones factoriales. Así, no se ha establecido la estructura factorial definitiva de la prueba. El objetivo del presente estudio es determinar la estructura factorial del LOT-R mediante la comparación de los siete modelos empíricos existentes en la literatura. El instrumento fue administrado a 906 participantes españoles, de edades comprendidas entre los 18 y los 61 años (edad media=23; 56% hombres). Se llevaron a cabo análisis factoriales confirmatorios sobre la matriz de correlaciones policóricas. Teniendo en cuenta los modelos teóricos existentes y los mejores índices de ajuste (RMSEA=0,038; CFI=0,98), concluimos que el LOT-R presenta una estructura factorial de segundo orden (orientación vital), compuesta por dos factores (Optimismo y Pesimismo). En consecuencia, recomendamos utilizar una única puntuación global que puede denominarse orientación vital y que, en último término, representa el nivel de optimismo disposicional.
The first references to the study of optimism date back to the modern period of philosophy in the 18th century (Chang, 2001). No comprehensive analysis of optimism took place in relation to works on learned helplessness until the end of the 20th century (Seligman, 1975) and above all, in relation to work on generalized outcome expectancies (Carver & Scheier, 1981; Scheier & Carver, 1985). Optimism is an individual difference variable that reflects the extent to which people hold generalized favourable expectancies for their future (Carver, Scheier, & Segerstrom, 2010). Optimism is associated with physical wellbeing, provided it is realistic and translates into healthy behaviour (Peterson & Bossio, 2001). It is also negatively correlated with clinical depression (Leising et al., 2013). At the same time, optimism predicts daily happiness while pessimism is a predictor of daily sadness among patients with chronic illnesses (Affleck, Tennen, & Apter, 2001). Optimism also serves to balance the relationship between negative life events and suicidal ideation and attempts (Lam, Bond, Chen, & Wu, 2010). Optimistic people have higher subjective wellbeing, experience less stress, confront stress more actively and are more persistent in attaining their goals (Carver et al., 2010). They also report greater satisfaction with their lives (Busseri, 2013). In fact, when stress factors are manageable, optimism has been associated with better functioning of the immune system (Segerstrom, 2005).
There have been many different meta-analyses of optimism. Andersson (1996) analysed 56 studies that used the Life Orientation Test (LOT), and found significant effect sizes, relating optimism to coping (.27), symptom reporting (-.23), negative effect (-.43), and depression (-.45). Nes and Segerstrom (2006) examined 50 studies that utilized the LOT and the Life Orientation Test-Revised (LOT-R) to analyse how optimism is associated with coping. In general terms, they found that optimism was positively associated with approach coping strategies (.17) and negatively associated with avoidance coping strategies (-.21). Rasmussen, Scheier, and Greenhouse (2009) reviewed studies that link optimism with physical health and found a significant global effect size (.17). For some of the markers, the associations exceeded this effect size, as was the case for cancer outcomes (.27), cardiovascular outcomes, pain, physiological markers (.25), and immune functions (.21).
In terms of the measurement instrument, the LOT was created by the developers of the psychological study of optimism (Scheier & Carver, 1985) in order to measure generalized outcome expectancies. The authors applied an initial set of 16 items to diverse samples of college students, and obtained two factors through the factor analysis of principal factors with oblique rotation. After several revisions of the tool and applications to diverse samples, the tool was ultimately composed of twelve items: four that measured optimism, four that measured pessimism, and four which served as fillers. Over time, many authors have questioned the predictive validity of the LOT with respect to constructs such as neuroticism, trait anxiety, self-esteem, and self-mastery. This led to a revision of the LOT and ultimately, to the development of the LOT-R (Scheier, Carver, & Bridges, 1994). In the LOT-R, three of the items included in the original LOT were eliminated, including two that measured optimism and one that measured pessimism, and a new item measuring optimism was added. In the exploratory factor analysis (EFA) with varimax rotation, only one factor was obtained. However, the confirmatory factor analysis (CFA) revealed a promising fit for the solution of both one factor, optimism (RMR=.012), and for two factors, optimism and pessimism (RMR=.012). The authors opted for a one-factor solution, inverting the scores of the pessimism items to provide a score for dispositional optimism.
The LOT, and especially the LOT-R, have become the gold standard of measures of optimism. The tests have been adapted to Japanese (Sumi, 2004), French (Trottier, Mageau, Trudel, & Halliwell, 2008), Portuguese (Laranjeira, 2008), German (Glaesmer, Hoyer, Klotsche, & Herzberg, 2008; Glaesmer et al., 2012; ten Klooster et al., 2010), Greek (Lyrakos, Damigos, Mavreas, Georgia, & Dimoliatis, 2010), Serbian (Jovanović & Gavrilov-Jerković, 2013), Spanish of Latin America (Landero Hernández & González Ramírez, 2009; Vera-Villarroel, Cordova-Rubio, & Celis-Atenas, 2009; Zenger et al., 2013) and Spanish of Spain (Ferrando, Chico, & Tous, 2002). A recent meta-analytical study on the internal consistency of the LOT-R yielded a mean alpha coefficient of .73 (Vassar & Bradley, 2010), a level considered acceptable in the first stages of research of a construct (Nunnally & Bernstein, 1994).
The results of the studies were somewhat ambiguous in terms of the factorial structure of the LOT-R. Several of these studies have obtained two-factor structures. This is the case of the Japanese and the Serbian adaptations, which were carried out with samples of students, the first of which used CFA and the second used EFA (Jovanović & Gavrilov-Jerković, 2013; Sumi, 2004). The Greek version was performed with samples of nurses by means of an EFA (Lyrakos et al., 2010), and the German adaptations were carried out using CFA both on the general population (Glaesmer et al., 2008; Glaesmer et al., 2012) and on samples of patients (ten Klooster et al., 2010). The same occurs with the Chilean adaptation, which was executed with students (Vera-Villarroel et al., 2009); two-factor structures were obtained using factor analysis of principal components with varimax rotation. In the Colombian adaptation performed on the general population (Zenger et al., 2013) and in the Spanish version carried out with college students (Ferrando et al., 2002) CFA was utilized, and the two-factor model obtained higher fit indices (RMSEA=.041-.044, and NNFI=.96-.98, respectively) than the one-factor model (RMSEA=.079-.174, and NNFI=.85-.69, respectively).
Two studies designed to address the issues of the factorial structure of the LOT-R should be mentioned. Herzberg, Glaesmer and Hoyer (2006) utilized CFA to test different structural models of the LOT-R, by controlling age, gender and medical diagnosis in a sample of 46,133 people who participated in a population health study in Germany. These authors concluded that the best-fit structure was the two-factor structure (CFI=.987, TLI=.987, RMSEA=.042). Segerstrom, Evans, and Eisenlohr-Moul (2011) administered two versions of the LOT-R, (the original version and another version which excluded extreme adverbs), to a sample of 971 college students and to an Internet sample of 2,806 people. Although they obtained psychometric support for the bi-factorial structure, they found high correlations between the two factors (r=.53-.61). Given that the authors did not detect any substantial differences between the one-factor and two-factor models with regards to the various personality constructs utilized as criteria, they concluded by recommending a one-factor model to improve reliability (six items are more reliable than three). In addition to the original study on the LOT-R (Scheier et al., 1994), the Portuguese-language adaptations performed on college students (Laranjeira, 2008) and the French-language adaptation in Canada (Trottier et al., 2008) both found one-factor solutions using EFA.
There is, however, a third option for the factorial structure of the LOT-R: a solution composed of two factors and one second-order factor. The results of a study carried out with the Spanish-language adaptation among 154 fibromyalgia patients from different Spanish-speaking countries (Landero Hernández & González Ramírez, 2009) point to just such a solution. These authors found equivalent fit indices in the CFA in the two-factor model and one second-order factor (RMR=.058, RMSEA=.073, CFI=.971) to those in the model of two correlated factors (RMR=.059, RMSEA=.075, CFI=.969), and better fit indices to those in the single factor model (RMR=.074, RMSEA=.117, CFI=.916).
The LOT-R uses a common strategy to reduce response bias (method effects) on psychometric instruments: this consists of balancing the positively worded items with those written in the negative. However, it is precisely this strategy which may have caused this instrument, designed to measure a single bi-dimensional construct, to display a bivariate structure in so many studies. Alessandri et al. (2010) demonstrated that method effects such as acquiescence could explain the bi-factorial structure of the LOT-R. These authors tested six models of LOT-R structure on 653 Italians: one factor, optimism; two orthogonal factors, optimism vs. pessimism; two oblique factors, optimism vs. pessimism; one factor, optimism, plus a method factor associated with the items in the positive; one factor, optimism, plus a method factor associated with the items in the negative; one factor, optimism, plus a factor method associated with all items (acquiescence). The best fits obtained corresponded to the latter three models, which all incorporated a method effect.
However, as suggested by the LOT-R authors in a recent examination of optimism, the dimensionality of the test is still not entirely clear (Carver et al., 2010). It is thus important at both the theoretical and clinical level to determine whether optimism and pessimism are two sides of the same coin or if both are found on the two sides of every coin. Therefore, the goal of this work is to test the factorial structure of the LOT-R by comparing the models which already have empirical evidence in their favour: (a) one factor, optimism (model 1); (b) two independent factors, optimism and pessimism (model 2); (c) two correlated factors, optimism and pessimism (model 3); and (d) a second-order factor, life orientation, comprised of two factors, optimism and pessimism (model 4). Additionally, in an attempt to take into account the influence of method effects, three additional models are analysed: based on model 1, (e) an additional factor formed by the items referring to pessimism (model 5); (f) an additional factor formed by the items referring to optimism (model 6); and (g) an additional factor formed by all the items (model 7).
MethodParticipantsData were obtained from 906 participants, aged 18 to 61. Their mean age was 23.53 (SD=6.62). In terms of percentages, 37.7% were candidates for the local police force who were training at a police academy and 62.3% were students of psychology at the University of Seville. Both were samples of convenience. With regards to gender, 43.6% were women and 56.4% were men. As for their marital status, 69.2% were single, 24.9% married and the remaining 5.9% were separated or divorced. In terms of education, 73.7% had higher education, 21.7% secondary-level studies, 3.6% primary-level studies and 1% had not finished primary-level studies but had carried out training as an adult which enabled them to sit the police entrance exams. Finally, 10.3% pertained to the working class; 11.6% were lower-middle class; 71.8%, middle-class; 5.8%, upper-middle class; and .5%, upper class. This categorisation into a specific social class was self-reported, and hence estimated by study participants.
InstrumentsThe Spanish version of the LOT-R (see Appendix) is a test to measure individual differences in generalized optimism versus pessimism (Ferrando et al., 2002). It consists of ten items: items 1, 4 and 10 refer to optimism; items 3, 7 and 9, to pessimism; and four filler items that were included in order to disguise (to some extent) the underlying purpose of the test. Each item presents a rating scale from 0 to 4 (0=strongly disagree; 1=disagree; 2=neutral; 3=agree; and 4=strongly agree). To obtain the total score, the items referring to pessimism (3, 7 and 9) are inverted and the scores corresponding to the six items about optimism and pessimism (1, 3, 4, 7, 9 and 10) are added up.
ProcedureDuring three academic years (2010-11, 2011-12 and 2012-13) the students completed the Spanish-language version of the LOT-R in class along with other psychological tests as part of their hands-on training in personality psychology. During the same period, the candidates for the local police force completed the LOT-R as part of their theoretical training in the social sciences. Each participant filled in the tool only once, and hence the data obtained are cross-sectional.
In terms of software, SPSS 17 was used to store the data obtained and to analyse the internal consistency of the test and the average discrimination index; PRELIS and LISREL 8.71 were used to estimate the matrix of polychoric correlations, to test the bivariate normality, and to contrast the seven different models previously described.
After inverting the values obtained in items 3, 7 and 9 referring to pessimism, in order to check the psychometric properties of the test, the internal consistency of these items was calculated using Cronbach's alpha coefficient, whereby values of .7 or higher were considered to be acceptable (Tavakol & Dennick, 2011). The average discrimination index was also calculated, with values higher than .39 considered to be excellent (Sabri, 2013). Appropriate values in internal consistency and in the average discrimination index are considered necessary prior to testing the factor structure.
In order to evaluate the factor structure underlying the LOT-R, the polychoric correlations were estimated and the asymptotic variance-covariance matrix for the estimation was computed (Holgado-Tello, Chacón-Moscoso, Barbero-García, & Vila-Abad, 2010). We did not estimate a matrix of Pearson correlations since, when using rating scales, the measurement is ordinal, and hence responses cannot be treated as if they were quantitative. Furthermore, if Pearson correlations are used to analyse the degree of association between ordinal variables lacking a metric scale, then the values obtained will be lower as all subjects situated at different points of the interval may be assigned the same score (Morata-Ramírez & Holgado-Tello, 2013). Jöreskog and Sörbom (1996) found polychoric correlations to be the most consistent and robust estimator.
To justify the use of the matrix of polychoric correlations, it was necessary to test the assumption of bivariate normal distribution by: the chi squared test (χ2); the percentage of tests that rejected the null hypothesis of bivariate normality for each pair of correlations, assuming a confidence level of 95%; and the Bonferroni correction. Additionally, given the sensitivity of the χ2, particularly in large samples, the root mean square error of approximation (RMSEA) was considered, by taking into account that that parameter estimation is not significantly affected when RMSEA values do not exceed .1 (Hooper, Coughlan, & Mullen, 2008).
The seven models described above were tested using CFA (Bagozzi & Yi, 2012). Since polychoric correlations were being used, the chosen method of estimation was the weighted least squares (WLS), a particular case of the generalized least squares (GLS) method, because in large samples with fewer than 20 indicators, it is recommended because it provides: the most consistent estimators; better factor loadings than other methods such as GLS and the un-weighted least squares (ULS); and the lowest standard errors for the estimated factor loading compared with GLS, ULS and the maximum likelihood (ML) (Holgado-Tello et al., 2010; Jöreskog & Sörbom, 1996). In these cases, the asymptotic variance-covariance matrix is considered a weighting element in the estimation.
In order to resolve the problem of identification of the models and with the purpose of establishing the measurement scale of the latent variables, in most cases, the lambda parameter corresponding to the relationship of the first item with each factor was fixed at 1.
Standardized factor loadings were calculated. Furthermore, the fit indices used to reach conclusions about each model tested were (a) the χ2 test, where accepting the null hypothesis (p ≥ .05) implies a good fit of the model; (b) the expected cross-validation index -ECVI- (Arias, Verdugo, Navas, & Gómez, 2013); (c) the consistent Akaike information criterion (CAIC), where the smaller the obtained values, the better the fit (Bandalos, 1993); in both cases, the fit is considered adequate when the value of the index is closer to the value for the saturated model than the independence one; (d) the RMSEA (Hooper et al., 2008), where values lower than .05 are considered a good fit, values between .05 and .08 a reasonable fit, values between .08 and .1 a poor fit, and values higher than .1 unfit (Browne, Cudeck, Bollen, & Long, 1993); (e) the goodness-of-fit index (GFI); (f) the adjusted goodness-of-fit index -AGFI- (Hooper et al., 2008); (g) the comparative fit index -CFI- (Byrne, 2013); (h) the normed fit index (NFI); and (i) the non-normed fit index -NNFI- (Hoe, 2008). In the last five indices mentioned, values higher than .9 are indicative of a good fit; potential values of GFI, AGFI, CFI and NFI oscillate between 0 and 1 (Bendayan, Blanca, Fernández-Baena, Escobar, & Victoria Trianes, 2013).
Finally, the increment in χ2 (Δχ2) was calculated in order to check whether the differences between models were statistically significant (when p<.05).
ResultsThe internal consistency using Cronbach's alpha coefficient was .73 (an acceptable value) and the average discrimination index was .48 (an excellent one).
Bivariate normality was tested. As there were six items, a total of fifteen correlations (6× 5/2) were obtained. Results showed that this assumption was accepted on only three of the fifteen occasions at the significance level of α=.05/15=.003 using the Bonferroni correction. Despite this, the RMSEA value was significantly lower than .1 in all cases. These results support the use of the matrix of polychoric correlations as the basis for the factor analyses.
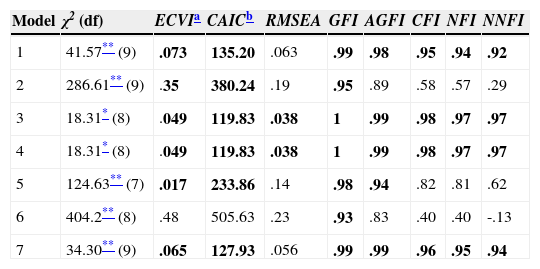
The fit indices presented in Table 1 show the most adequate results in models 3 and 4, both of which obtained the same values. χ2 presents a good fit at a confidence level of 99%, an acceptable result taking into account the influence of this index by the sample size. The other fit indices present optimal results. Although models 1 and 7 resulted in a satisfactory fit, the different indices were never better than in models 3 and 4; furthermore, they did not present a good fit taking into account the values obtained in χ2. The remaining models (2, 5 and 6) did not fit in accordance with at least 5 fit indices.
Fit indexes of all tested models.
| Model | χ2 (df) | ECVIa | CAICb | RMSEA | GFI | AGFI | CFI | NFI | NNFI |
|---|---|---|---|---|---|---|---|---|---|
| 1 | 41.57** (9) | .073 | 135.20 | .063 | .99 | .98 | .95 | .94 | .92 |
| 2 | 286.61** (9) | .35 | 380.24 | .19 | .95 | .89 | .58 | .57 | .29 |
| 3 | 18.31* (8) | .049 | 119.83 | .038 | 1 | .99 | .98 | .97 | .97 |
| 4 | 18.31* (8) | .049 | 119.83 | .038 | 1 | .99 | .98 | .97 | .97 |
| 5 | 124.63** (7) | .017 | 233.86 | .14 | .98 | .94 | .82 | .81 | .62 |
| 6 | 404.2** (8) | .48 | 505.63 | .23 | .93 | .83 | .40 | .40 | -.13 |
| 7 | 34.30** (9) | .065 | 127.93 | .056 | .99 | .99 | .96 | .95 | .94 |
Note. The values in boldface correspond to adequate fit indexes. Model 1=one factor (optimism); model 2=two independent factors (optimism and pessimism); model 3=two correlated factors (optimism and pessimism); model 4=a second-order factor (life orientation) comprised of two factors (optimism and pessimism); model 5=one factor (optimism) and an additional factor (method effects) related to the items referred to pessimism; model 6=one factor (optimism) and an additional factor (method effects) related to the items referring to optimism; model 7=one factor (optimism) and an additional factor (method effects) affecting the six items.
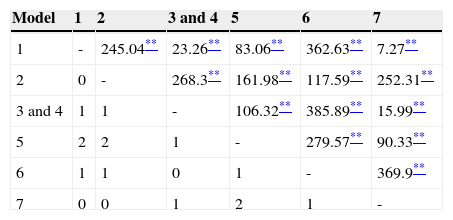
When comparing models 3 and 4 with the others, the significant Δχ2 suggests a significant improvement in the goodness of fit in those models in all cases (see Table 2). In fact, all the models were statistically different when compared in pairs (except for models 3 and 4, which yielded exactly the same results). Standardized factor loadings for each model are presented in Figures 1–7.
Δχ2 for each pair of models.
| Model | 1 | 2 | 3 and 4 | 5 | 6 | 7 |
|---|---|---|---|---|---|---|
| 1 | - | 245.04** | 23.26** | 83.06** | 362.63** | 7.27** |
| 2 | 0 | - | 268.3** | 161.98** | 117.59** | 252.31** |
| 3 and 4 | 1 | 1 | - | 106.32** | 385.89** | 15.99** |
| 5 | 2 | 2 | 1 | - | 279.57** | 90.33** |
| 6 | 1 | 1 | 0 | 1 | - | 369.9** |
| 7 | 0 | 0 | 1 | 2 | 1 | - |
Note. The values above the diagonal correspond to the increment of the chi square (Δχ2). The values under the diagonal are the increment in the degrees of freedom (Δdf).
.")
.")
.")
 comprised of two factors (OPT=optimism and PES=pessimism).")
 formed by the items referred to pessimism in model 1: one factor (OPT=optimism).")
 formed by the items referring to optimism in model 1: one factor (OPT=optimism).")
 formed by all the items in model 1: one factor (OPT=optimism).")
Considering the factor loadings of the four models that present the best fit indices (1, 3, 4 and 7), the models that present the best results are clearly 3 and 4 (with the same values). These two models yielded the highest λ (concretely, .82 between item 9 and the construct pessimism); and, as a consequence, the lowest error (δ=.33). The lowest λ in models 3 and 4 is .59 (between item 1 and the construct optimism), a value higher than the lowest λ in the other models.
The correlation between constructs in model 3 is strong and, as expected, presents an inverse relationship (Φ=-.79). In model 4, the γ parameters are high, showing a very strong relationship between the second-order factor life orientation and the factors optimism (γ=.85, direct relationship) and pessimism (γ=-.92, inverse relationship).
It can also be of interest to comment that the other models without such good fit indices present low path coefficients (close to zero) or negative ones (e.g., -.26 in model 6) which implies inexistent and inverse relationships, respectively, between the items and the construct. Furthermore, in model 7, the same factor weights are suggested for all the items with respect to the construct method because it was desired to study if better fit was given by including an external factor called method that would affect all the items equally and that could explain part of the variability of the model.
DiscussionBoth two correlated factors model (model 3) and a second-order factor model (4) are statistically exactly the same and obtained the best fit. Obtaining the same results makes it very difficult to decide which model to prefer without additional data and analyses. The facts that acceptable fit indices were obtained in various models, and the best fit was found in two models, would explain why results obtained in many different studies on the factorial structure of LOT-R presented so many different and contradictory solutions (Herzberg et al., 2006; Lyrakos et al., 2010; Segerstrom et al., 2011; Sumi, 2004; ten Klooster et al., 2010; Vera-Villarroel et al., 2009).
Despite the difficulty found, based on the results obtained in this study, to roundly defend one model against the others, we would prefer to conclude that LOT-R is a second-order factor composed of two factors, optimism and pessimism (model 4) because the high correlation between the factors optimism and pessimism found in model 3 (-.79, see Figure 3) implicitly indicates that both factors form part of the same second-order factor (referred to, in this case, as life orientation), indicative of unidimensionality; that is, a single dimension from a positive to a negative continuum in life orientation.
In contrast to the findings of some other studies (Alessandri et al., 2010), when the “method effects” factor is added to the one-factor model (models 5 to 7), the fit is not better than in models 3 and 4, so it could be considered an irrelevant factor to be eliminated from the model. Furthermore, it could be considered a methodological artefact, taking into account that the influence studied could be attributed to method effects or to any other construct, such as social desirability or personality traits.
In short, based on the theoretical background and the results obtained from model fit indices, we defend the second-order factor model (model 4) as the factorial structure of the LOT-R. In this regard, our results are similar to those of Segerstrom et al. (2011) who presented a sample of 971 U.S. college students and another general international sample of 2,806 people obtained via the Internet, and obtained high correlation between factors. In addition, our results are practically identical to those obtained by Landero Hernández and González Ramírez (2009) with a sample of fibromyalgia patients in several Spanish-speaking countries. Thus, we recommend the option chosen by the authors of the original test (Scheier et al., 1994) of using a single global score that could be referred to as life orientation but which ultimately represents the level of dispositional optimism.
Some limitations could be inferred from this study: (a) the conclusions cannot be fully affirmed because two of the raised models (and indeed those of better fit) exactly obtain such results after the analyses; (b) measures of other constructs with which the factors that have been considered could be related do not appear; and (c) the characteristics of the sample can generate doubts about the capacity of generalisation of the results.
In relation to first of the possible limitations, we would emphasise that from our point of view it is rather a strength of the study. The scientific method does not suggest absolute and immovable conclusions, but contributes indications of validity about the knowledge. In this sense, this study opens the possibility of delving more deeply into the theme, which leads us to comment on the other two suggested possible limitations.
In relation to the absence of data on other constructs that could influence the measurement obtained in pessimism, optimism and/or life orientation, such as mood (Leising et al., 2013) or hope (Heaven & Ciarrochi, 2008), a potential solution would involve tests designed to measure each construct individually (Chacón-Moscoso, Sanduvete-Chaves, Portell-Vidal, & Anguera-Argilaga, 2013) and incorporate the data obtained into the model. This could be a useful way to obtain measurements of other factors potentially related and, considering those constructs as external criteria, could contribute valuable information to support the chosen model over others (Drews & Hazlett-Stevens, 2008). In this sense, we recommend obtaining measurements of all the factors which are going to be included in the model at the same time because most of those constructs, though considered traits, do not necessarily stay the same over time; they could change drastically for a single participant due to life circumstances, for example.
Finally, to resolve the last commented limitation about the capacity of generalisation of the results, the accomplishment of studies of factor invariance is foreseen with the purpose of verifying that the finally proposed factor structure remains stable in different subsamples (e.g., between men and women, between people of different professions, or between citizens of different Spanish speaking countries).
FundingThis research was funded by the Projects with reference PSI2011-29587 (Spanish Ministry of Science and Innovation) and title Methodological quality and effectiveness from evidence (Chilean National Fund of Scientific and Technological Development–FONDECYT-).
We would like to dedicate this article to our fellow researcher José A. Pérez-Gil, who passed away while the article was being written. May he rest in peace.
Available online 28 February 2015
