


Edited by: Andre R Brunoni, Marie-Anne Vanderhasselt, Leigh Chavert
Last update: August 2022
More infoAnxiety disorders are highly prevalent and negatively impact daily functioning and quality of life. Transcranial direct current stimulation (tDCS) targeting the dorsolateral prefrontal cortex (dlPFC), especially in the right hemisphere impacts extinction learning; however, the underlying neural mechanisms are elusive. Therefore, we aimed to investigate the effects of cathodal tDCS stimulation to the right dlPFC on neural activity and connectivity patterns during delayed fear extinction in healthy participants.
MethodsWe conducted a two-day fear conditioning and extinction procedure. On the first day, we collected fear-related self-reports, clinical questionnaires, and skin conductance responses during fear acquisition. On the second day, participants in the tDCS group (n = 16) received 20-min offline tDCS before fMRI and then completed the fear extinction session during fMRI. Participants in the control group (n = 18) skipped tDCS and directly underwent fMRI to complete the fear extinction procedure. Whole-brain searchlight classification and resting-state functional connectivity analyses were performed.
ResultsWhole-brain searchlight classification during fear extinction showed higher classification accuracy of threat and safe cues in the left anterior dorsal and ventral insulae and hippocampus in the tDCS group than in the control group. Functional connectivity derived from the insula with the dlPFC, ventromedial prefrontal cortex, and inferior parietal lobule was increased after tDCS.
ConclusiontDCS over the right dlPFC may function as a primer for information exchange among distally connected areas, thereby increasing stimulus discrimination. The current study did not include a sham group, and one participant of the control group was not randomized. Therefore, to address potential allocation bias, findings should be confirmed in the future with a fully randomized and sham controlled study.
Anxiety disorders are highly prevalent and negatively impact the quality of life. Fear conditioning and extinction procedures are widely employed to model the therapeutic benefits of exposure-based therapies in ameliorating anxiety-related symptoms (Eysenck, 1979; Pitman & Orr, 1986). A recent meta-analysis (Foa & McLean, 2016) demonstrated that exposure-based therapies are moderately efficacious for anxiety disorders. However, more effective treatments are needed to increase extinction efficacy and address relapse which is common after treatment cessation (Bradley et al., 2005).
During fear conditioning, fear responses are acquired via repetitive pairing of conditioned (CS+) and aversive unconditioned (US) stimulus (Sotres-Bayon et al., 2006). Fear conditioning protocols involve the presentation of two stimuli: one that is predictive of the US (CS+) and another that is not predictive of the US (CS−) (LeDoux & Phelps, 2008). During fear extinction, the CS+ is presented repeatedly in the absence of US, leading to reduced fear expression (Lonsdorf et al., 2017; Phelps et al., 2004).
Functional magnetic resonance imaging (fMRI) studies of fear conditioning and extinction have characterized regions constituting the fear network. Exposure to a conditioned fear stimulus increases the activation of fear-processing regions, such as the amygdala, insula, and cingulate cortex (Hauner et al., 2012; Sevenster et al., 2018). Conversely, successful fear extinction is associated with decreased amygdala activation and reduced behavioral/physiological fear responses (Repa et al., 2001). Two approaches have been proposed for neural mechanisms underlying fear extinction; the top-down approach involves amygdala regulation by prefrontal cortex (PFC) control (Sotres-Bayon et al., 2006), and the bottom-up approach suggests that fear extinction occurs via changes in sensory processing of the CS+ (LeDoux & Phelps, 2008). In support of top-down mechanisms, PFC activity increases during extinction learning (e.g., Diekhof et al., 2011; Fullana et al., 2018; Milad et al., 2007; Phelps et al., 2004; Quirk & Mueller, 2008). Conversely, in support of bottom-up mechanisms, subcortical structures traditionally associated with fear learning (e.g., amygdala, hippocampus [HC], brainstem, and cerebellum) are recruited during extinction (e.g., Frontera et al., 2020; Herry et al., 2010).
Overlap between brain regions comprising the fear network in healthy individuals and brain regions associated with symptom severity in patients with anxiety suggests that targeting fear network regions using brain stimulation is clinically beneficial (Marin et al., 2014). Specifically, the PFC has been investigated for its role in decreasing the expression of previously acquired fear via top-down control of subcortical structures (Gilmartin et al., 2014). Accordingly, interventions that enhance PFC activity during fear extinction have received growing interest in the past (for a review, see (Fitzgerald et al., 2014)).
More recently, transcranial direct current stimulation (tDCS) targeting the dlPFC to modulate fear extinction has emerged as topical research in the field (Abend et al., 2016; Dittert et al., 2018; Nitsche & Paulus, 2000; van 't Wout et al., 2016). tDCS is a non-invasive brain stimulation method that alters cortical excitability by delivering a weak direct electric current to the brain (Nitsche & Paulus, 2000). The effects of tDCS on cognitive functions involved in fear extinction in healthy participants have been investigated using fear conditioning paradigms. For instance, Dittert et al. (Dittert et al., 2018) applied tDCS to the ventromedial prefrontal cortex (vmPFC) before and during fear extinction and observed that skin conductance responses (SCRs) decreased at the early phase of extinction for both stimuli, and lead to a generalization of the fear response to the CS− at the late phase of extinction. Similarly, van 't Wout et al. (2016) assessed the effect of anodal tDCS over the anterior PFC (anode over AF3; cathode over contralateral mastoid) and found that tDCS delivered during early extinction decreases SCR towards the CS+. The authors do not discuss what seems to be a generalization of the fear response to the CS− in late extinction. Abend et al. (2016) positioned the anode centrally over the forehead (cathode under the occipital bone) and delivering tDCS during fear extinction observed increased SCR response to the CS−, corresponding to a generalization of the fear response. The same authors, observed an impaired extinction learning when using alternating current. Ganho-Ávila et al. (2019) tested the effect of tDCS (cathode over rdlPFC, anode over left deltoid muscle) in a 3-day fear conditioning and extinction paradigm and found an impaired extinction learning, but a long-term positive tDCS effect on extinction learning with a decreased generalization effect to the CS− according to an approach-avoidance task, which, however, was not confirmed by SCRs.
Furthermore, some studies have investigated tDCS-driven modulation of cognitive and emotional processes relevant to anxiety. For instance, Ironside et al. (2019) tested whether stimulation over the PFC reduces amygdala threat reactivity during an attentional control task in healthy individuals with trait anxiety. The tDCS montage was bipolar balanced, with the anode over the ldlPFC and the cathode over the rdlPFC. Results showed that tDCS significantly reduced bilateral amygdalar reactivity to threat, with a simultaneously increased cortical activity in regions associated with attentional control. Vanderhasselt et al. (2017) examined the impact of tDCS on cognitive cost applying tDCS over the rdlPFC (anode: F4, cathode: contralateral supraorbital area) and showed that tDCS enhanced cognitive control for emotional information in participants scoring high in rumination trait. Clarke et al. (2020) studied the impact of anodal tDCS over F3 (cathode over left superior trapezius muscle) on cognitive and emotional effects of worry and showed significantly increased state anxiety after instructed worry in the tDCS group compared to the sham group. The tDCS group also showed faster recovery and reductions in worry once the cognitive goals shifted to a non-worry focus. These studies suggest the beneficial effect of tDCS over the rdlPFC in boosting fear extinction-related processes, such as stimuli discrimination, vigilance, cognitive control, and attention.
There is increasing research about the clinical applications of tDCS in clinical samples (for a review, see (Stein et al., 2020). The beneficial effects of tDCS on anxiety symptoms when the cathode is placed over the rdlPFC are of particular interest (Sadeghi Movahed et al., 2018; Shiozawa et al., 2014). Overall, these studies demonstrated the importance of electrode polarity at the targeted region, and the inconsistency across studies for methodological parameters, targeted processes, and results. These promising results inspired Ganho-Ávila et al (2019) paper where we showed that tDCS over the rDLPFC (cathode: rDLFC; anode: left deltoid muscle) before fear extinction did not improve fear learning, as measured by SCR, but it eliminated the overgeneralization of the fear response to the CS− observed in the sham group (an effect of tDCS previously reported by other authors after anodal tDCS over the vmPFC, e.g. (Abend et al., 2016; Dittert et al., 2018)). Further, in our previous publication (Ganho-Ávila et al., 2022) we showed that cathodal tDCS over the rDLPFC boosted the connectivity between regions of the prefrontal cortical–amygdalo–hippocampal–cerebellar fear pathway during subsequent extinction training. However, in Ganho-Ávila et al., 2022, our early vs. late extinction analysis might have hindered the variability across the extinction session, that a trial-by-trial approach can offer. Additionally, recent studies have employed multivariate fMRI pattern analysis to clarify the neural mechanics associated with fear conditioning and expression while accounting for inter-subject variability and complex multi-voxel patterns (Graner et al., 2020; Sjouwerman et al., 2020; Whitehead & Armony, 2019; Zhou et al., 2021).
Considering these recent findings and methodological approaches, in the current study we aim to expand our previous results and clarify the impact of cathodal tDCS applied to rDLPFC in whole-brain discrimination accuracy between CS+ and CS− on a trial-by-trial approach. We hypothesize that fear discriminability (the ability to discriminate between CS+ and CS−) will be decreased in fear-processing brain regions after cathodal tDCS to the rDLPFC, thus indicating successful extinction learning. As a secondary aim, we will conduct an exploratory resting-state connectivity analysis to test the impact of tDCS on a set of regions of interest that show significant between-group differences in classification accuracy. Informed by previous results (Ganho-Ávila et al., 2022), we expect that tDCS will boost connectivity among subcortical structures (e.g. hippocampus, insula, cerebellum), and between those and the contralateral cortical regions (e.g. left DLPFC, left VMPFC).
Materials and methodsThis study is a re-analysis of the functional data collected in (Ganho-Ávila et al., 2022), complemented with the analysis of resting-state data. The sample size calculation was originally estimated for the analysis reported on Ganho-Ávila and colleagues’ study (Ganho-Avila et al., 2022).
ParticipantsParticipants were recruited via social media posts and advertisements at the University. In total, 48 women were included, providing written informed consent. The study was approved by the ethics committee of the [Faculty of Psychology and Educational Sciences, University of Coimbra]. Participants received a voucher of €30 upon completing participation. The exclusion criteria were (1) a history of psychiatric disorders; (2) use of psychoactive medication; (3) pregnancy; (4) caffeine and/or alcohol intake 24 h before sessions; (5) physical exercise 2 h before sessions; (6) consuming a meal 2 h before sessions (Boucsein et al., 2012); (7) auditory or visual (non-corrected) deficits; and (8) standard exclusion criteria for MRI scanners. Based on previous literature (Agren et al., 2012; LaBar et al., 1998; Phelps et al., 2004) and the aposteriori sample size estimation for whole-brain searchlight classification analysis (for α = .001, power .90, an effect size of .30, and 10% dropouts), a minimum of 13 participants per group was established.
Procedure (AB design)Participants completed a partial auditory fear conditioning procedure (75% reinforcement rate) for 2 consecutive days for fear memory consolidation. Prior to commencing experiments, participants underwent brief assessment for exclusion criteria and collection of baseline demographic and clinical data (general psychopathology, anxiety state, trait, and sensitivity). On day 1, the fear conditioning procedure occurred in context A (university laboratory), and SCRs, self-report ratings of valence, arousal contingency, and expectancy were collected. On day 2, the tDCS group received an active 20-minute, 1 mA tDCS session (cathode over F4 and anode over left deltoid muscle), and then completed the fear extinction session. The control group skipped the tDCS session and started day 2 with the fear extinction task. The fear extinction procedure occurred in context B (fMRI scanner), and functional MRI data were collected. E-Prime (2.0.10.353 Standard SP1, Psychology Software Tools, Pittsburgh, PA) was used to script the experiments and collect data (See Fig. 1). Tasks were presented over a white background using a DELL P2012H monitor. US triggers and onset markers were processed using a second computer, which collected electrodermal activity across habituation and acquisition sessions. The extinction session occurred on day 2 inside the fMRI scanner, in which stimuli were presented on an Avotec projector, controlled by “A Simple Framework (Schwarzbach, 2011)” in MATLAB R2014a (The MathWorks Inc., Natick, MA, USA) using an in-house script. Stimuli were presented via a mirror attached to a head coil.
Experimental stimuli
Three stimuli were presented—US, CS+, and CS− (never paired with the US). The US was a woman's scream (item 277 of the International Affective Digitized Sound System) (Yang et al., 2018). The US volume intensity was individually set to an uncomfortable but non-painful intensity (90–96 dB) with a dummy aversive sound according to the visual analog scale for pain ratings (Huskisson, 1974). Auditory stimuli were presented via noise-cancelling headphones. Colored squares (blue and yellow) were randomly assigned and counterbalanced across participants as CS+ or CS−. The CSs and US were presented for 4 s and 2 s, respectively, with the latter overlapping the last 2 s of the CS+ presentation. The CS presentation order was pseudorandomized such that no more than two consecutive presentations of the same stimulus occurred.
Day 1: Habituation and fear acquisition (context A)The habituation phase comprised eight non-reinforced CS+ and eight CS− presentations. The acquisition phase comprised a partial reinforcement procedure at 75% (12 of 16 CS+ presentations were paired with the US). In total, 16 CS+ and 16 CS− trials were presented. In both the habituation and acquisition phases, each stimulus was presented for 4 s over a white screen, followed by a jittered inter-stimulus interval between 10 and 12 s, during which a black fixation cross was presented at the center of the screen. On day 1, only participants who acquired the fear response were invited to participate on day 2 (24 h later). Successful fear acquisition was defined as a positive SCR differential in the last five trials (CS+ > CS−). If habituation to the US occurred, the middle phase (from the 6th to 10th trial inclusive) was considered. The minimum difference of 0.01 μS between CS+ and CS− was assumed (Oyarzun et al., 2012).
Day 2: tDCS session and fear extinction (context B – MRI scanner)On day 2, participants underwent tDCS before fMRI or underwent fMRI alone. tDCS (1 mA for 20 min) was delivered via a one-channel stimulator (TCT Research Limited, Hong Kong). The cathode was placed over the rdlPFC (F4, 10/20 international system (Klem et al., 1999)). The anode was placed over the contralateral deltoid muscle (extra-cephalic montage). Sponges of 5 cm2 were saturated with 10 mL 0.9% saline solution. Participants were instructed to remain still and calm during tDCS. Offline tDCS was preferred over online tDCS to prevent MRI artifacts due to electrical current (Antal et al., 2014). After the tDCS session, adverse effects were assessed according to Thair (2017). Before entering the scanner, participants were instructed to recollect the color of the square associated with the US on the previous day. No further information was provided regarding the auditory stimuli. The session comprised 10 CS+ and 10 CS− trials. Each trial involved the presentation of a fixation cross for 16 s followed by the presentation of the CS+ or CS− for 4 s. The US had not been previously presented. Participants viewed the images passively for 7 min according to a block design.
Data acquisition and preprocessingAll MRI data were collected using a Siemens Tim Trio 3-T MRI scanner (Erlangen, Germany) with a 12-channel head coil. High-resolution T1-weighted image data were obtained using a magnetization-prepared rapid acquisition gradient echo pulse sequence with the following parameters: repetition time (TR) = 2530 ms, echo time (TE) = 3.29 ms, flip angle = 7°, field of view (FOV) = 256 × 256 mm, acquisition matrix size = 256 × 256, voxel size = 1.0 × 1.0 × 1.0 mm3, and number of slices = 192. fMRI data for resting state and fear extinction were acquired using a T2*-weighted single-shot echo-planar imaging (EPI) sequence with the following parameters: TR = 2000 ms, TE = 30 ms, flip angle = 90°, FOV = 256 × 256 mm, acquisition matrix size = 64 × 64; voxel size = 4.0 × 4.0 × 4.0 mm3, number of slices = 30 (interleaved), and number of scans = 180 for resting state and 210 for fear extinction.
All fMRI data were preprocessed using SPM12 (http://www.fil.ion.ucl.ac.uk/spm, Wellcome Trust Centre for Neuroimaging, London, UK) (Friston et al., 1995). All fMRI data underwent standard preprocessing steps, including slice timing (for scan time correction), realignment (for head motion correction), co-registration of T1-weighted image, and spatial normalization of functional data into Montreal Neurological Institute space using nonlinear transformation in SPM12. Normalized functional data were interpolated to 2.0 × 2.0 × 2.0 mm3 voxels. To avoid spillover effects between voxels, spatial smoothing was not conducted (Haxby et al., 2001; Haynes & Rees, 2006; Norman et al., 2006; Todd et al., 2013).
Whole-brain searchlight classificationTo estimate neural activity during CS+ and CS− stimulus, we used a general linear model (GLM) where observed signal Yat a voxel i is represented by a linear combination of a design matrix X and its weight vector β and noise ε. The GLM model was defined as below.
Yi=β1Xi1 + β2Xi2+εi, εi∼N(0,σ2).
Beta values (or regression coefficients, β) for CS+ and CS− were estimated by applying the GLM with regressors convolved with a canonical hemodynamic response. To evaluate the effect of tDCS on fear extinction, support vector machine (SVM) classification of fMRI data in each individual was performed using a whole-brain searchlight approach (Kriegeskorte et al., 2006). A spherical searchlight (6 mm radius) comprising 123 voxels was created. At every voxel, the β-values per condition were vectorized to create a pattern, and 20 patterns (10 trials × 2 classes) were extracted. A SVM with 5-fold cross-validation was used for the classification (Boser et al., 1992; Cortes & Vapnik, 1995). A linear SVM classifier was trained using the patterns (16 samples, 2 classes × 8 trials) with hyperparameter C = 1 (Andersson et al., 2013; Lee et al., 2019; Sitaram et al., 2011) and tested with the remaining patterns (4 samples × 2 classes). The mean classification accuracy after 5-fold cross-validation was assigned to the central voxel.
To assess the statistical significance of the mean classification accuracy, one-sample t-tests were conducted after subtracting 0.5 (chance level) from the mean accuracy at each voxel. Group differences in the classification accuracy maps were computed using two-sample t-tests. Extraction of significant voxels was performed as reported previously (Chen et al., 2016). For the group-level inference, a voxel-level threshold of p < 0.05 was set, with an extent threshold of 38 and 63 voxels per cluster for the tDCS and control groups, respectively. Further, cluster-level threshold of p < 0.05 was used to correct for multiple comparisons using 10,000 Monte Carlo simulations (Scholz et al., 2009; Xiong et al., 1995) with REST's AlphaSim (http://restfmri.net) (Ward, 2000). For group comparisons, clusters comprising a minimum of 40 voxels with a threshold of p < 0.05 corrected by the cluster size threshold as described above.
Resting-state functional connectivityConsidering signal stability, the first five images of resting-state fMRI were discarded. The remaining 205 EPI images were preprocessed using standard procedures with SPM12. All fMRI time series were estimated by regressing out six rigid motions and their derivatives, three principal components of white matter and cerebrospinal fluid masks, linear repressors, quadratic regressions, and high-pass filtering with a cutoff frequency of 0.009 Hz.
Peak coordinates of the left dorsal anterior insula (dAI), ventral anterior insula (vAI), and HC were used as seed ROIs, given the involvement of these regions to discriminate between CS+ and CS− processing (dAI: −30, 14, −18; vAI: −46, 6, −2; HC: −24, −16, −20). Whole-brain resting-state functional connectivity was calculated with correlation coefficients between the average time series of the searchlight (123 voxels) derived from the peak coordinates and those of whole-brain voxels. The correlation coefficients were transformed into Fisher's z-values. Functional connectivity maps were obtained for each participant. Group differences in functional connectivity maps were analyzed using two-sample t-tests for each voxel. Clusters comprised a minimum of 100 voxels with a false discovery rate threshold of p < 0.01. For group comparisons, clusters comprised a minimum of 85, 71, and 72 voxels for dAI, dVI, and HC, respectively, with a threshold of p < 0.05 . corrected for multiple comparisons by cluster-level threshold estimated using 10,000 Monte Carlo simulations.
Statistical analysis of classification accuracy and anxiety-related scoresAnxiety-related scores of state and trait anxiety were measured using the STAI (STAI-1 and STAI-2, respectively (Spielberger, 1983)). The associations between state and trait anxiety before fear conditioning (day 1) and classification accuracy calculated in the left dAI, dVI, and HC during fear extinction (day 2) were analyzed using Pearson correlation analysis.
ResultsThree participants withdrew due to discomfort during the experimental task, eight were excluded due to unsuccessful fear acquisition on day 1, and data from three participants were not recorded due to technical issues. Finally, data from 34 women were analyzed (all of whom successfully acquired the fear response on day 1). Participants were assigned to the tDCS (n = 16, mean age = 24.19 years, standard deviation [SD] = 5.94 years) and control (n = 18, mean age = 22.56 years, SD = 5.47 years) groups by random when no excluding criteria were present. As per informed consent, when excluding criteria were present, or participants were not willing to receive tDCS, they were allocated to the control group. Seventeen participants were randomly allocated to the control group, one was allocated due to the presence of tDCS exclusion criteria, and zero due to unwillingness to receive tDCS. No significant between-group baseline differences in anxiety state, trait, sensitivity, and general psychopathology were observed (p = .71, p = .60, p = .28, and p = .97, respectively).
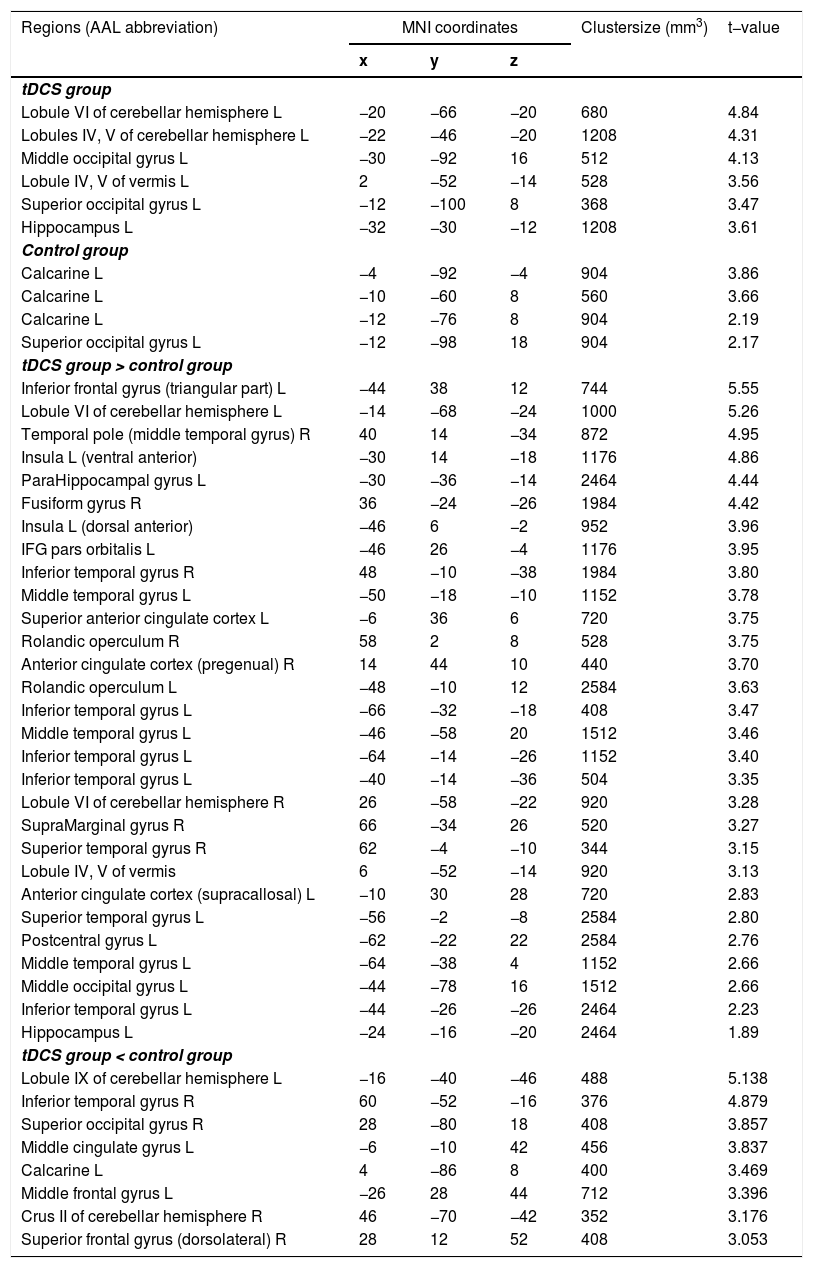
Classification accuracy differencesOne-sample t-tests comparing the mean accuracy at each voxel with zero (after subtracting the chance level) showed increased discrimination between the CS+ and CS− in the left HC, superior/middle occipital gyrus, cerebellum, and vermis regions, in the tDCS group; and in the left superior occipital gyrus and calcarine in the control group. Two-samples t-test revealed that classification accuracy in the left dAI, left vAI, and HC was significantly higher in the tDCS group than in the control group, whereas that in the left middle frontal gyrus, middle cingulum, right superior frontal gyrus, and middle temporal gyrus was significantly higher in the control group than in the tDCS group (Fig. 2; Table 1).
. Compared to the control group, the tDCS group exhibited significantly increased classification accuracy in the left dorsal anterior insula (dAI), left ventral anterior insula (vAI), and hippocampus (HC) (B).")
Brain regions showing statistically significant differences in classification accuracies during fear extinction. L: left, R: right.
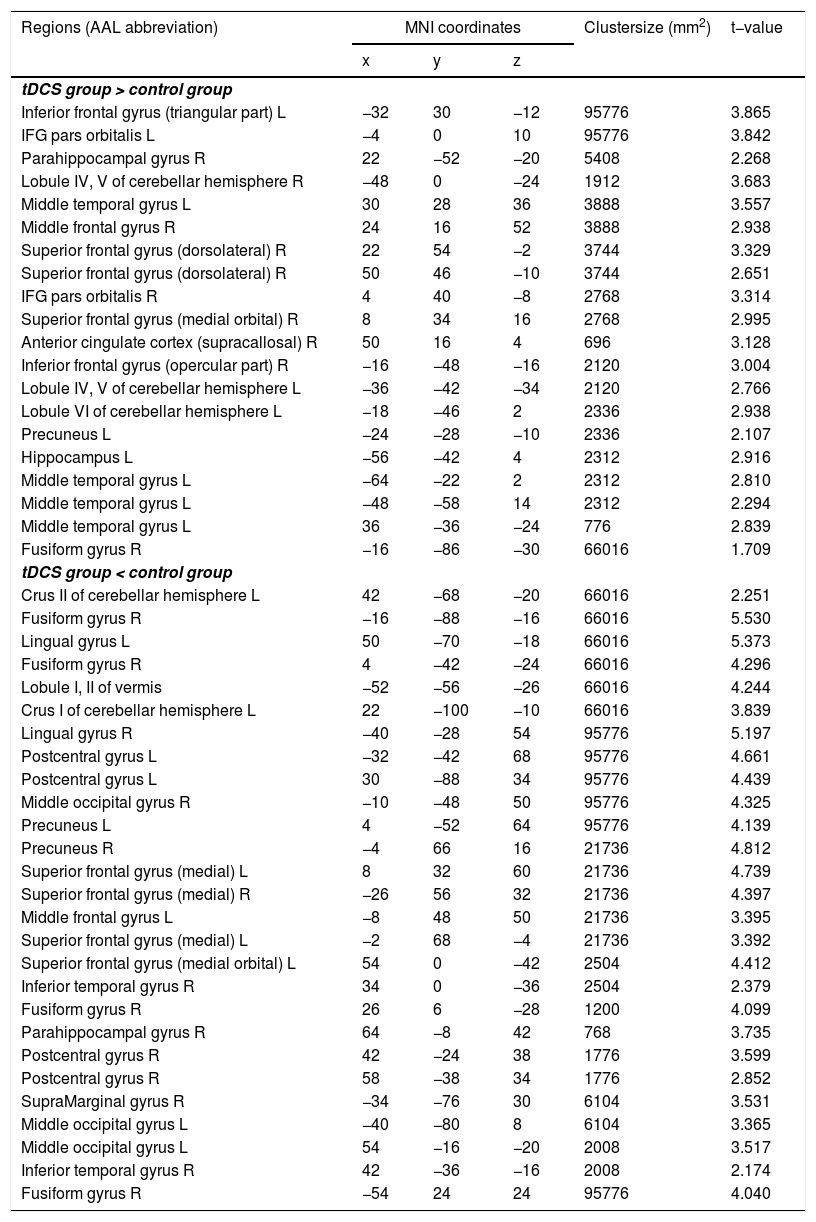
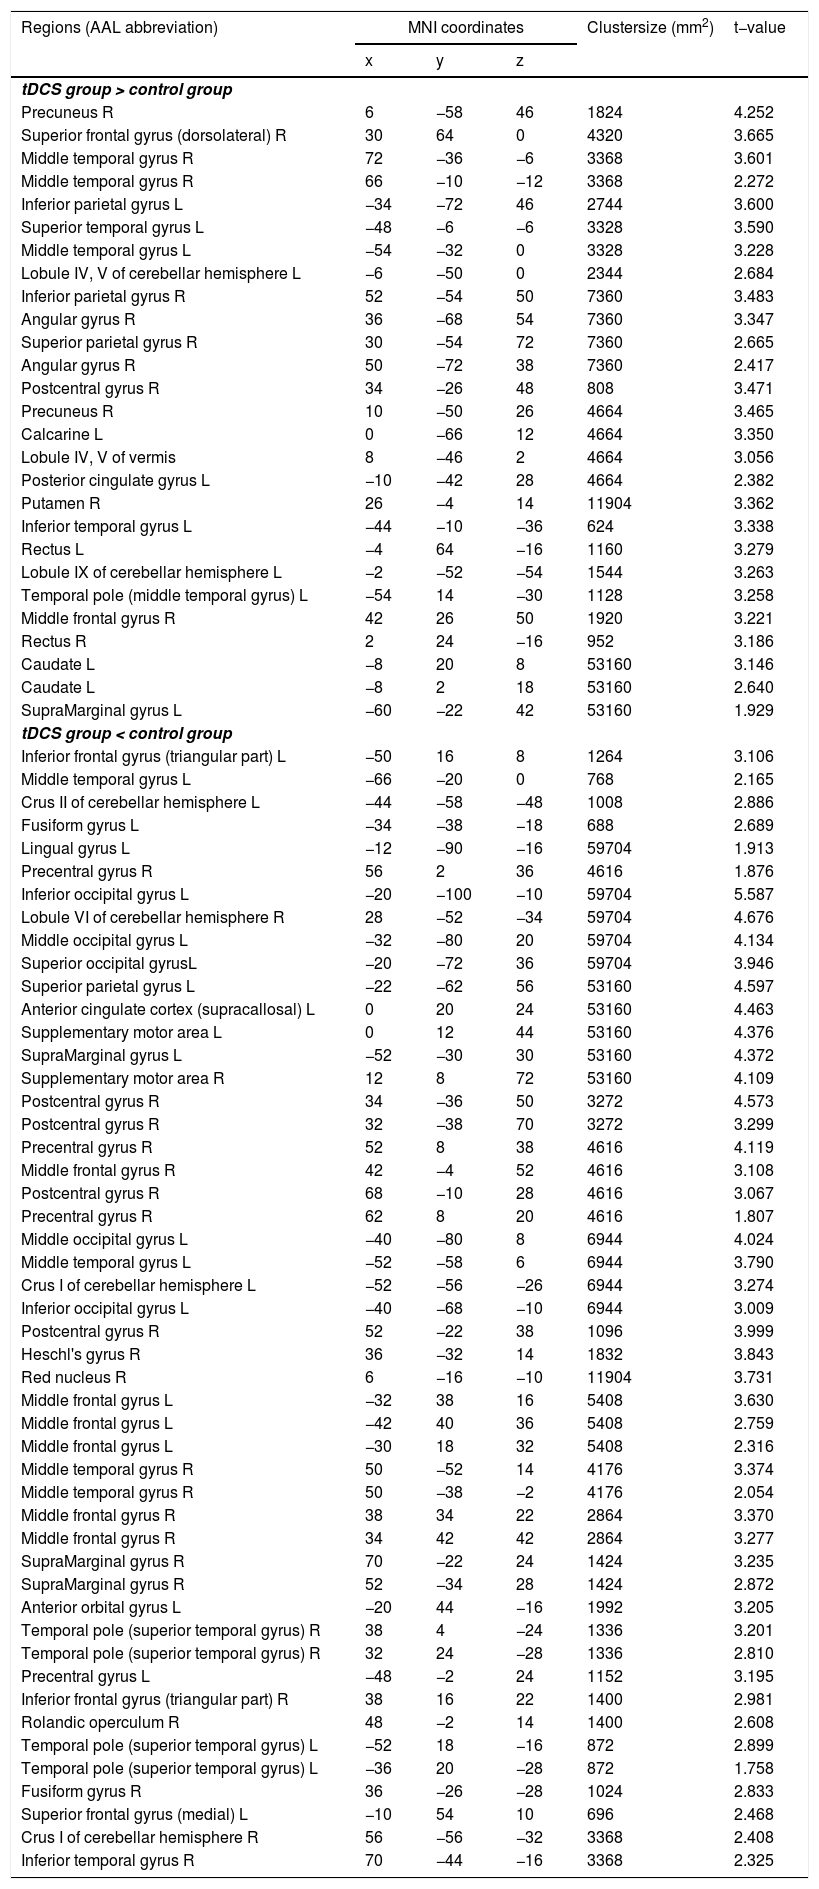
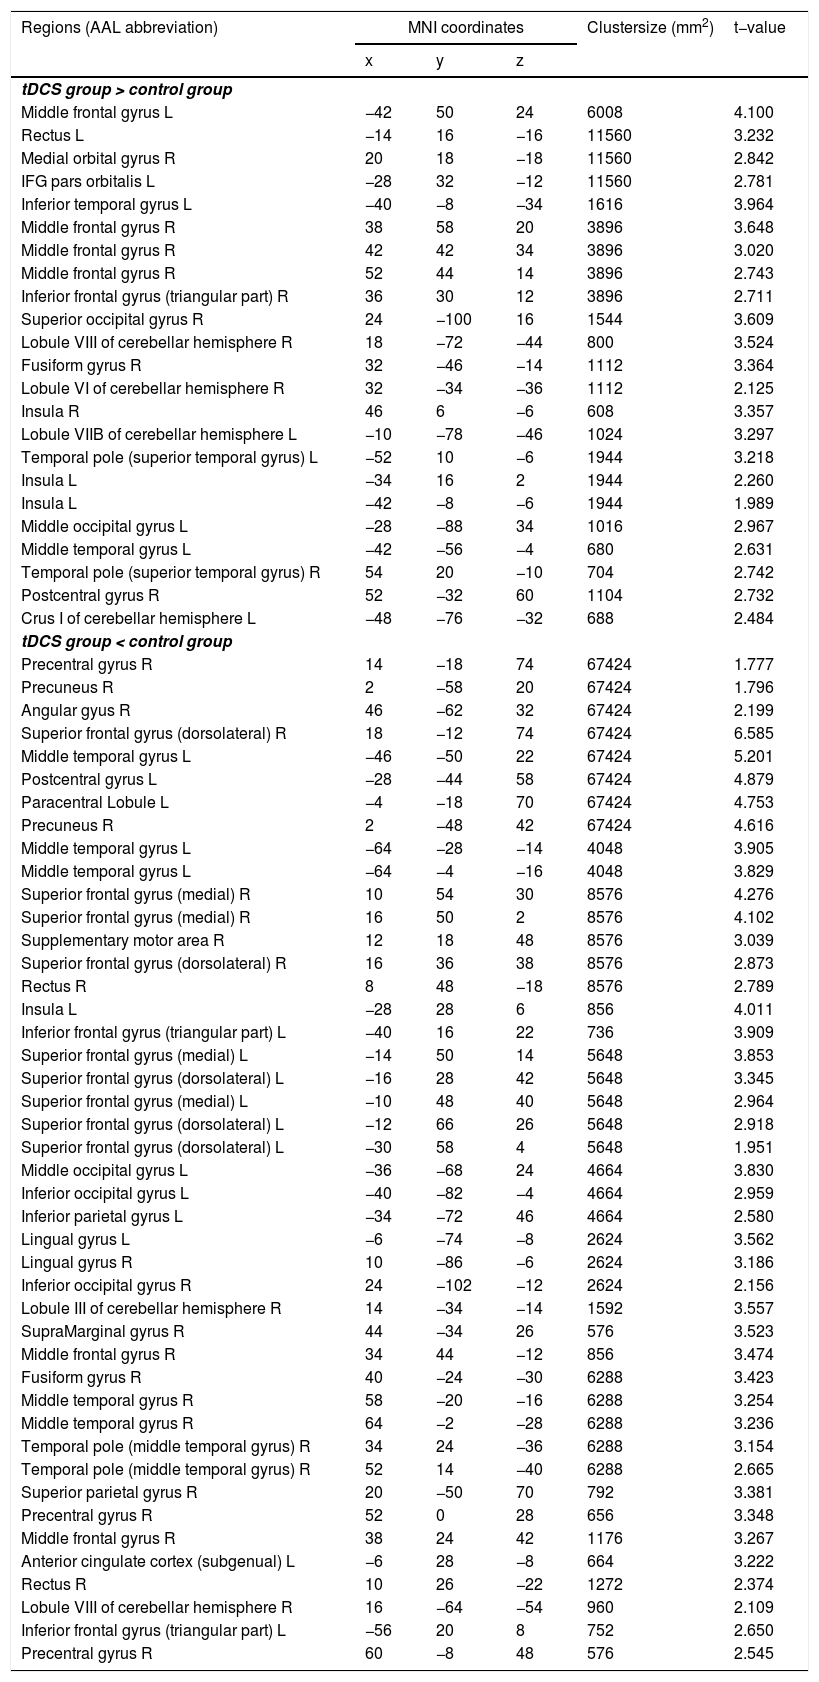
Functional connectivity of the left vAI with the left HC, right vmPFC, parahippocampus, and dlPFC was significantly greater in the tDCS group than in the control group (Fig. 3A; Table 2). Functional connectivity of the left dAI with the left HC and right dlPFC was significantly greater in the tDCS group than in the control group (Fig. 3B; Table 3). The left HC exhibited increased functional connectivity with the left vAI and bilateral vmPFC in the tDCS group compared to the control group (Fig. 3C; Table 4).
, dAI (B), and HC (C). Compared to the control group, the tDCS group exhibited increased functional connectivity among fear-related brain regions (the left vAI, dAI, HC, vmPFC, and dlPFC).")
Functional connectivity maps from the left ventral anterior insula in tDCS and control groups. L: left, R: right.
Functional connectivity maps from the left dorsal anterior insula in tDCS and control groups. L: left, R: right.
Functional connectivity maps from the left hippocampus in tDCS and control groups. L: left, R: right.
The STAI-2 scores and classification accuracy in the left vAI were positively correlated in the tDCS group (r = 0.46, p = 0.0374) but not in the control group (r = 0.11, p = 0.3325) (Fig. 4). However, after exclusion of an outlier value in the tDCS group, correlation results were not significant (r = 0.40, p = 0.0720). No correlation was observed between the STAI-2 scores and classification accuracy in the left dAI in the tDCS (r = 0.09, p = 0.3634) and control (r = −0.27, p = 0.1394) groups. Similarly, no correlation was observed between the STAI-2 scores and classification accuracy in the HC in the tDCS (r = −0.24, p = 0.1858) and control (r = 0.37, p = 0.0670) groups, and no correlations were found between STAI-1 and classification accuracy across brain areas and groups.
Discussion, dAI (B), and HC.")
We reported the effects of cathodal tDCS stimulation to the right dlPFC on neural activity during fear extinction and resting-state functional connectivity after extinction learning.
By performing MVPA (Haxby et al., 2001; Kamitani & Tong, 2005; Norman et al., 2006; Pereira et al., 2009) with searchlight methods (Kriegeskorte et al., 2006), we showed whole-brain information-mapping during fear extinction after cathodal tDCS stimulation over the rdlPFC and no stimulation. Based on our previous study (Ganho-Avila et al., 2019), it was expected that the discriminability of CS+ (threat cues) and CS− (safe cues) processing would be differed between groups. Indeed, participants in the tDCS group exhibited increased fear discriminability in the dAI, vAI, and HC, suggesting that the cathodal tDCS stimulation to the rdlPFC can modulate neural patterns in fear-related brain regions that are distally connected to the rdlPFC. For example, cathodal tDCS stimulation affected the transfer of fear-related information and indirectly modulated the extent to which fear information is spatially encoded across voxels within the left insular cortex (dorsal and ventral). These results are consistent with those of previous reports on the critical role of the insular cortex in fear extinction (Dunsmoor et al., 2019; Fullana et al., 2018; Fullana et al., 2016) and with reports of distal alterations in neural activity patterns and functional connectivity (Lee et al., 2019). Moreover, tDCS stimulation operated as a primer for information exchange regarding fear extinction between distally connected areas increasing discriminability between CSs. Particularly, group comparison results suggest that tDCS had an effect on other regions involved both in fear expression and regulation across both hemispheres such as lobule IV of the cerebellum, cerebellar vermis, left and right ACC, left and right rolandic operculum, left HC, left parahippocampal gyrus, and left postcentral gyrus. Of particular interest, tDCS was found to modulate left ventral and dorsal AI, and left HC accuracy besides cortical regions, contrary to the control group. This suggests that tDCS might have a particular effect in bottom-up regulation of the fear response.
Based on previous experimental studies (Ganho-Avila et al., 2019) and clinical case reports (Shiozawa et al., 2014) showing promising effects of placing the cathode over the rdlPFC (and anode over the left deltoid), we expected that this montage would boost fear extinction, and thus, lead to decreased classification accuracies across fear-related regions. However, contrary to our expectation, classification accuracies were increased after cathodal tDCS stimulation. Increased classification accuracies might be associated with the reflection of overgeneralization that has been previously reported across distinctive tDCS montages and electrode polarities (Abend et al., 2016; Ganho-Avila et al., 2019). Previous literature shows that overgeneralization of the fear response might be associated with both increased and decreased classification accuracies during fear extinction. For example, after extinction Abend et al. (2016), found an increased fear response to the CS+ (unsuccessful fear extinction), concomitant with an increased fear response to the CS− (overgeneralization of the fear response to the CS−) which led to a reduced classification accuracy between stimuli. However, Dittert et al. (2018) and ourselves (Ganho-Avila et al., 2022) found a decreased fear response to the CS+ (successful extinction) concomitant with an increased fear response to the CS− (also considered an overgeneralization of the fear response to the CS−). Indeed, our earlier analysis of this same dataset showed two activation clusters (one including the frontal middle and the frontal superior left cortices, and another including the left and the right paracentral region and the right postcentral area) with this exact pattern in the tDCS group compared to the control group (Ganho-Avila et al., 2022). However, these two clusters do not directly overlap with the brain regions showing increased accuracies in the current study. This might be due to the different analytic approaches. While in Ganho-Ávila et al. (2022) analysis were conducted over averaged brain activation comparing early vs late extinction, in the current study we observed brain activation on a trial-by-trial bases. Future studies should further explore the possible distinct mechanisms underlying overgeneralization of the fear response to the CS− and its translational meaning, thus clarify the results of the current paper.
The study by Graner et al. (2020) tested the neural representation across the brain with a MVPA approach during fear extinction, where higher dissimilarity between voxels activity in one same region during the processing of a stimulus across time would indicate lower stability of the stimulus representation, and consequently better fear extinction. The authors found that clusters centered at the right and left rolandic operculum, cerebellum, mid-cingulate cortex, and postcentral gyrus, showed increased dissimilarity, meaning successful extinction learning. Graner et al.’s findings are in contrast with our results, where tDCS seems to have impaired fear extinction, as the same regions showed increased accuracies between CSs.
To further test the effects of cathodal tDCS stimulation in functional connectivity after fear extinction learning, we evaluated resting-state functional connectivity maps using our principal findings that fear discriminability in the left insular cortex (dorsal and ventral anterior) and hippocampus was affected by cathodal tDCS stimulation. Functional connectivity between the left insular cortex (dorsal and ventral anterior) and bilateral dlPFC was greater in the tDCS group once more supporting tDCS−driven modulatory changes in functional connectivity patterns between distally connected regions. These results agree with previous findings indicating global integration of information via long-range connections (Bullmore & Sporns, 2009; Deco et al., 2011; Deco et al., 2015; Friston, 2011; Park & Friston, 2013). The fMRI evidence for functional connections among distributed brain regions in fear processing is growing. Our study contributes to the field by showing that tDCS with the cathode over the right dlPFC (and anode over contralateral deltoid muscle) changes the connectivity patterns between distal subcortical regions within the prefrontal cortical–amygdalo–hippocampal–cerebellar pathway. Particularly, our results indicated that the left insular cortex exhibited greater connectivity with the bilateral dlPFC and left vmPFC after cathodal tDCS. Our study is in line with previous research considering the insula as a hub for integrating visceral/sensory-related information, and communicating with regions responsible for top-down regulation, such as the dlPFC and vmPFC (Berntson et al., 2011; Gu et al., 2013). However, future studies should observe simultaneously collected self-reported measures of fear and SCR which would complement fMRI data and offer meaningful insights to classification accuracy.
Classification accuracy in the left vAI was positively correlated with trait anxiety (STAI-2) in the tDCS group but not in the control group. This suggests that for individuals who tend to be more anxious, tDCS might have contributed to difficulties in fear extinction. The preserved stimuli discrimination found in our study, in individuals with high trait anxiety is in line with previous studies involving patients with anxiety (Glotzbach-Schoon et al., 2013). Such studies showed greater differentiation between CS+ and CS− during extinction (Duits et al., 2015; Graner et al., 2020), and showed the same pattern in participants scoring high on rumination (Vanderhasselt et al., 2017). Another factor that might explain higher discrimination between CSs after fear extinction, is the development of a fear response toward the CS− due to its increased ambiguity or uncertainty, particularly in participants scoring high in anxiety questionnaires. For instance, Gazendam et al. (2013), showed that participants with high trait anxiety presented impaired in safety learning, corresponding to higher responses to the CS−. Other studies have explored the association between ambiguity and the tendency to interpret information with a negative cognitive bias. For example, Stuijfzand et al. (2018) showed that negative cognitive bias in face of ambiguity was positively associated with anxiety. It is worth noting that our sample is composed of subclinical-to-healthy participants (with mean STAI 2 [trait] = 39, close to the clinical cutoff (Dibbets & Evers, 2017)), which might explain our results regarding stimuli discrimination. Future studies should implement a fear generalization paradigm and include subjects with both high and low trait anxiety to further clarify how trait anxiety influences both fear extinction, and discrimination/generalization after tDCS.
This study had some limitations that are worth noting. As the study sample comprised solely women, the results cannot be generalized to gender-wise heterogenous populations. This was an intentional methodological choice because women and men are known to differently process (and express) fear-related cues (Day & Stevenson, 2020). Regarding the study design, two limitations should be highlighted and discussed: 1) the quasi-randomized design and 2) the absence of a sham group. On the one hand, the allocation of participants that were not eligible to receive tDCS to the control group, might have contributed to group differences. However, 94% of participants in the control group were randomized (17 out of 18). Nevertheless, results should be interpreted with caution until they are replicated in a fully randomized study. On the other hand, the inclusion of a control group (rather than a sham group), introduced two differences between groups: 1) the actual stimulation, and 2) the expectations of receiving tDCS and associated effects. Therefore, possible placebo effects were not controlled. Current findings warrant replication in a study that includes a third arm (sham group) or a study of two arms fully randomized and placebo controlled. Furthermore, as we only collected behavioral/autonomic fear-related measures on day 1 (arousal, valence, contingency, and SCRs), we could only infer the effect of tDCS modulation based on day 1. Future studies should include other fear extinction measures (such as SCRs and self-reports) pre- and post-tDCS modulation. Finally, it is worth noting that resting-state data was collected before fear extinction, thus informing only about the impact of tDCS over the fear network.
Taken together, cathodal tDCS stimulation over the rdlPFC led to increased neural connectivity during resting-state in fear-processing and emotion regulation regions. Moreover, tDCS has increased fear discrimination between CSs particularly for participants high in trait anxiety, possibly indicating an impaired fear extinction learning. Although our results contribute to a better understanding of the neural mechanisms underlying tDCS effect, its impact on fear extinction processes and clinical symptoms improvement warrants further studies to be clarified.
FundingAGA was supported by the Foundation for Science and Technology, Portugal and Programa COMPETE [grants numbers SFRH/BD/80945/2011, PTDC/MHC-PAP/5618/2014 (POCI-01-0145FEDER-016836); http://www.poci-compete2020.pt/]. DL was supported by the KBRI basic research program through Korea Brain Research Institute funded by Ministry of Science and ICT (22-BR-05-02, 22-BR-04-03) and the National Research Foundation of Korea (NRF) grant funded by the Korea government (MSIT) (NRF-2021R1F1A1062514). RG was supported by a Ph.D. Grant (SFRH/BD/5099/2020), sponsored by FCT (Portuguese Foundation for Science and Technology). JA was supported by the European Research Council (Starting Grant number 802553 “ContentMAP”).
Author contributionsDL: Formal analysis, Funding acquisition, Visualization, Writing – original draft, Writing – review & editing. RG: Data curation, Data acquisition, Investigation, Writing – original draft, review & editing. ÓFG: Writing – review & editing. JA: Writing – review & editing. AGA: Conceptualization, Formal analysis, Funding acquisition, Supervision, Writing – original draft, Writing – review & editing.
