


Neuroimaging studies have reported abnormalities in the examination of functional connectivity in late-life depression (LLD) in the default mode network (DMN). The present study aims to study resting-state functional connectivity within the DMN in people diagnosed with late-life major depressive disorder (MDD) compared to healthy controls (HCs). Moreover, we would like to differentiate these same connectivity patterns between participants with high vs. low anxiety levels.
MethodThe sample comprised 56 participants between the ages of 60 and 75; 27 of them were patients with a diagnosis of MDD. Patients were further divided into two samples according to anxiety level: the four people with the highest anxiety level and the five with the lowest anxiety level. Clinical aspects were measured using psychological questionnaires. Each participant underwent functional magnetic resonance imaging (fMRI) acquisition in different regions of interest (ROIs) of the DMN.
ResultsThere was a greater correlation between pairs of ROIs in the control group than in patients with LLD, being this effect preferentially observed in patients with higher anxiety levels.
ConclusionsThere are differences in functional connectivity within the DMN depending on the level of psychopathology. This can be reflected in these correlations and in the number of clusters and how the brain lateralizes (clustering).
According to recent estimates, major depressive disorder (MDD) may be observed in more than 7% of the population of elderly individuals (i.e., late-life depression, or LDD) (Wen et al., 2022). This disorder, therefore, should be considered as one of the major health issues of this population, not only because of the direct effect of MDD on individuals’ quality of life and functionality (Zhang, Chen & Ma, 2018) but also because it is well known that subjects with LLD have a twofold increased risk of progression to neurodegenerative disorders such as Alzheimer's disease (Habes et al., 2021). In this context, developing accurate diagnostic measures and effective prevention and treatment strategies specifically targeting this population is of paramount importance. For this purpose, in addition to an accurate clinical and neurocognitive characterization of patients with LLD, it is also important to obtain more information about the neurobiological correlates of this condition, in order to maximize the effectiveness of clinical strategies using a biologically informed perspective.
Functional magnetic resonance imaging (fMRI) provides a noninvasive means to explore brain function. Moreover, it allows not only the assessment of task-related activations but also interregional functional connectivity (i.e., synchronous patterns of neural activity fluctuations) at rest. This not only facilitates comparison across studies due to the lack of differences related to varying task performance but also allows for the description of brain activity at the network level, that is, in terms of coordinated patterns of activity across distant brain regions underpinning cognitive and emotional functioning (Geng et al., 2019; Mancho-Fora et al., 2020).
The most studied resting-state network is the default mode network (DMN), which encompasses anterior and posterior regions of the medial wall as well as inferior parietal areas (Damoiseaux et al., 2008). However, activity in other brain regions has also been correlated with DMN activity (Van den Heuvel & Pol, 2010; Wei et al., 2019). Activity in the DMN is allegedly related to inward attentional processes, and the pattern of correlations across its different components is therefore preferentially observed during resting-state (i.e., no-task) acquisitions (Harrison et al., 2008). Moreover, abnormal functional connectivity patterns across the different components of the DMN have been described in different disorders of mental health, including MDD (Wise et al., 2017) and neurodegenerative disorders (Xue et al., 2019).
Different studies have provided evidence of disturbances in DMN activity in LLD. Gandelman et al. (2019) observed differences in intrinsic functional connectivity, while Manning, Wang and Steffens (2019) presented an interesting review regarding DMN alterations and those in other important networks, such as the salience network, in LLD, which may contribute to shared behavioral syndromes. In this sense, they highlighted the importance of anxiety symptoms in LLD, which may affect 50% of LLD patients (Beekman et al., 2000), in relation to the DMN dysfunction observed in this population. Indeed, some basic alterations in psychological functioning that are observed both in depression and anxiety samples, such as rumination (Smith & Alloy, 2009), may partially account for DMN alterations (Jacob et al., 2020). Therefore, comorbid anxiety symptoms may LLD may indeed play an essential role in DMN disruption in LLD.
In this study, we aimed to assess abnormal DMN activity in this population of individuals compared to a group of healthy controls comparable in age and sex distribution. Moreover, we also aimed to assess the moderating effect of anxiety on our findings. Anxiety symptoms have also been related to DMN alterations (Andreescu, Sheu, Tudorascu, Walker & Aizenstein, 2014; Laird et al., 2019; Zugman et al., 2022), and since this is a symptom typically observed in LLD (Beekman et al., 2000), they may add or interact with MDD symptoms in accounting for DMN alterations. Finally, in this study, we used a clustering approach to assess DMN alterations. Clustering analysis in fMRI allows data stratification in a hierarchical structure, building a dendrogram of all the members (Wang et al., 2021; Zhou, Zemanová, Zamora, Hilgetag & Kurths, 2006).
MethodsParticipants and measurementsThe study sample consisted of 56 participants. Patients with LLD (n = 27, 20 women, mean age M = 68.2 and SD = 4.01) were consecutively recruited at the Department of Psychiatry of Bellvitge University Hospital. A control group of 29 subjects (19 women, mean age M = 67.7 and SD = 4.23) was recruited from the same sociodemographic environment through advertisements and word-of-mouth. Inclusion criteria for patients included a primary diagnosis of MDD and aged between 60 and 75 years. MDD diagnoses were established by two experienced psychiatrists according to DSM-IV-TR criteria (which do not substantially differ from DSM-5 criteria and are aligned with the diagnostic criteria of the interview used to identify comorbid symptoms). Disorder severity was estimated with the Hamilton Depression Rating Scale (HDRS) (Hamilton, 1960) and the Geriatric Depression Scale (GDS) (Sheikh & Yesavage, 1986; Yesavage et al., 1982), which was not used for diagnostic purposes. Higher scores in these scales denote higher severity of depression symptoms. State and trait anxiety were measured through the State-Trait Anxiety Inventory (STAI, Spielberger,1983). Similar to above, higher scores in these scales indicate more severe anxiety symptoms. To identify the current or past presence of other than depression symptoms, all participants were also interviewed using the Mini-International Neuropsychiatric Interview (MINI) (Sheehan et al., 1998), which provided a fast but accurate assessment of the major psychiatric diagnoses. Finally, the Vocabulary subtest of the Wechsler Adult Intelligence Scale, Third Edition (WAIS-III) (Wechsler, 1999), was administered to all participants to estimate the premorbid intelligence quotient (IQ; higher scores, higher premorbid IQ values). Importantly, medication was not changed in patients and was kept at stable doses for at least one month before MRI acquisition.
Exclusion criteria included: 1) ages <60 or >75 years (we set this superior age limit to minimize effects of altered neurovascular coupling), 2) past or current diagnosis of other major psychiatric disorders including substance abuse or dependence (except nicotine), 3) intellectual disability/neurodevelopmental disorders, 4) neurological disorders, 5) Hachinski Ischemic Score >5, 6) presence of dementia according to the DSM-IV-TR criteria and/or a CDR score>1, 7) severe medical conditions, 8) electroconvulsive therapy in the previous year, 9) conditions preventing neuropsychological assessment or MRI procedures (e.g., blindness, deafness, claustrophobia, pacemakers, or cochlear implants), and 10) gross abnormalities in the MRI scan. Moreover, although 59 participants were recruited initially, three participants (two patients and one control) were excluded from the study sample because of excessive movement (half of the voxel size as criteria) (the two patients) or outlier values in the psychometric assessment (the control subject).
The study was approved by The Clinical Research Ethics Committee (CEIC) of Bellvitge University Hospital (reference PR156/15, 17th February 2016) and performed following the ethical standards laid down in the 1964 Declaration of Helsinki and its later amendments (revised in 2013). All participants gave written informed consent to participate in the study.
Imaging data acquisition and preprocessingEach participant underwent an 8-minute resting-state functional MRI (fMRI) scan in a 3T Philips Ingenia scan (Philips Health care, Best, The Netherlands) using a 32-channel head coil. The functional sequence consisted of 240 echo-planar image volumes (excluding the four initial dummy volumes) comprising 40 interleaved slices acquired in the oblique axial direction perpendicular to the floor of the fourth ventricle (repetition time = 2000 ms; echo time= 25 ms; flip angle = 90°; 3 mm isotropic voxels; field of view = 24 cm, 80 × 80 pixel matrix). For anatomical reference and imaging preprocessing purposes, we also acquired for each participant a whole-brain T1-weighted anatomical three-dimensional inversion-recovery prepared spoiled gradient echo sequence (233 axial slices; repetition time = 10.46 ms; echo time = 4.79 ms; flip angle = 8°; 0.75 mm isotropic voxels; field of view = 24 cm; pixel matrix =320 × 318; total duration = 5 min, 04 s).
Functional time series were initially despiked using the BrainWavelet toolbox v2.028 (Patek et al., 2014). Next, using MATLAB version 9.3 (R2017b) (The MathWorks Inc, Natick, Massachusetts) and the MATLAB-based CONN-fMRI Functional Connectivity toolbox version 17.f29, implemented in SPM12 (Wellcome Department of Imaging Neuroscience, London, UK; www.fil.ion.ucl.ac.uk/spm), functional images were aligned to the first volume of the time series using a six-parameter rigid body spatial transformation and least-squares minimization in combination with an unwarping algorithm aimed at correcting motion and motion-related distortions. Slice-timing correction was then applied. ART-based automatic volume outlier detection (www.nitrc.org/projects/artifact_detect/) was also run for later scrubbing. Likewise, both functional and structural images were subjected to simultaneous gray matter, white matter, and cerebrospinal fluid segmentation, and a bias correction was performed to remove smoothly varying intensity differences across images. Such image segments were subsequently spatially normalized through nonlinear transformations to the Montreal Neurological Institute (MNI) stereotactic space, and images were resliced to a 2-mm isotropic resolution. Finally, images were smoothed with an 8-mm full-width at half-maximum (FWHM) isotropic Gaussian kernel.
After preprocessing, data were denoised from residual movement and physiological noise. Denoising steps included temporal despiking, regressing out confounding factors (i.e., effect of BOLD signal small ramping effects at the beginning of each scan session and the six rigid body realignment parameters, as well as their first-order derivatives), controlling for total gray matter (GM) signal, the ART scrubbing protocol, linear detrending, and bandpass filtering (0.008–0.09 Hz). Physiological noise was removed with the anatomical component-based noise correction method (aCompCor) (Behzadi, Restom, Liau & Liu, 2007). Importantly, after implementing these different steps, none of the subjects was removed from the analysis because, according to current guidelines (Van Dijk et al., 2010), all individual functional series included at least 95% of the original volumes after scrubbing (volume censoring) and spike regression.
Statistical analysesSociodemographic and clinical data were analyzed with IBM SPSS v 24.0.0.0 for Mac (SPSS Inc., Chicago, IL) and with libraries and own programming in R. Shapiro-Wills tests were used to ascertain the normality distribution of these variables. Between-group differences in quantitative variables were assessed with Student's t-test or the nonparametric U test of the Mann-Wittney test, when appropriate. In contrast, between-group differences in qualitative variables were explored with the χ2 test.
Regarding analyses of imaging data, according to our study hypotheses, we focused on the DMN, which, following previous research (Huang et al., 2015), was split into three different components: the anterior DMN (DMNa), the ventral DMN (DMNv), and the posterior DMN (DMNp). Specifically, within these components, we defined six, twelve, and six regions of interest (ROIs) using cortical parcellations from the automated anatomical atlas (AAL) (Tzourio-Mazoyer et al., 2002) anatomically corresponding to such components. All contrasts derived from the image data were corrected for significance using Family-Wise Error Rates (FWER) according to Flandin & Friston, (2019) for the reduction of nominal type I errors. More details are provided in Table 1.
Regions of Interest and Their Names.
The MATrix LABoratory program (MATLAB) was used to analyze functional connectivity. Specifically, for each subject, we extracted the time-series BOLD signal fluctuations from the above-described ROIs with the different components of the DMN. Next, we computed a region-by-region correlation matrix using Pearson correlation coefficients for each pair of ROIs. Autocorrelations (rxy for x = y) and anticorrelations (rxy < 0) were eliminated from this correlation matrix. Moreover, correlations were transformed to partial correlations by eliminating the effects of years of schooling. For this, the means and standard deviations of the observed distribution of years of schooling were estimated, and distributions adjusted to these values were simulated to obtain a plausible estimate of the effect of years of schooling. This procedure is based on the proposal of Ponsoda et al. (2017). The initial expression is the following:

Moreover, at the group level, we computed a correlogram by averaging the subject-level correlation matrices. We also conducted a clustering analysis that allowed classifying, for each group, the different ROIs based on a graph theory approach, effectively quantifying the degree of functional connectivity of each ROI (vertex) with its neighbors (Watts & Strogatz, 1998). Cluster analysis is often used to study functional connectivity (Shakil et al., 2014). We used a hierarchical clustering analysis to construct two models based on the connectivity distance, using the Euclidean distance between each pair of vectors. This distance exists between two points in a Euclidean space (full vector with internal product). To optimize the visualization of these results, dendrograms (graphs of ROI groupings) were computed for each group.
Finally, due to the objectives of the study, the group of depressed patients was split into two different groups according to their level of state anxiety prior to MRI. We estimated two cutoff points from both the mean and the standard deviation of the MDD group to discriminate individuals with very low anxiety levels from those with very high anxiety levels (low anxiety group [mean±SD]: 65.25±5.0; high anxiety group [mean±SD]: 68.80±3.30. The low anxiety group was made up of the five individuals with the lowest state anxiety scores, while the high anxiety group included the four individuals with the highest state anxiety ratings. Obviously, the sample sizes do not allow for inferential estimates, but the extreme groups have been kept small in order to maximize the differences between them, and these results should be interpreted for a more descriptive than inferential purpose. To improve the robustness of the tests, all variability estimates have been carried out using bootstrap estimates according to Turner, Paul, Miller and Barbey (2018) and are of special cliical interest.
ResultsAnalysis of sociodemographic and clinical dataTable 2 displays the descriptive statistics of the study sample. Groups did not differ in gender [χ² = 0.487; df= 1; p=.487] or age [t = 0.42; df= 54; p= .68]. Conversely, significant differences were observed in the different clinical variables (i.e., HDRS, GDSY, MMSE, vocabulary, STAI-S, and STAI-T). We also observed significant differences between groups in years of schooling [t = 5.8; df = 54; p <0.001], although, as described above, the effect of this variable was removed from data before statistical analyses.
Descriptive characteristics of the participants.
Note: x¯: Mean; SD: Standard Deviation.
We observed that the average of pairwise correlations in the control group was 0.212 (SD = 0.22), while in the MDD group, this value was 0.181 (SD = 0.24). Although these values were not significantly different between the study groups [t = 1.558; df = 550; p = 0.120], when estimating the difference between the group-level correlation means (i.e., 0.212–0.181 = 0.031), this value showed a 95% confidence interval ranging between 0.01 and 0.05. Although this is a subtle between-group difference, typical of the type of signal used in the study, this range of correlation difference values indicates that average correlation values in healthy controls are consistently higher than average pairwise correlations in MDD patients.
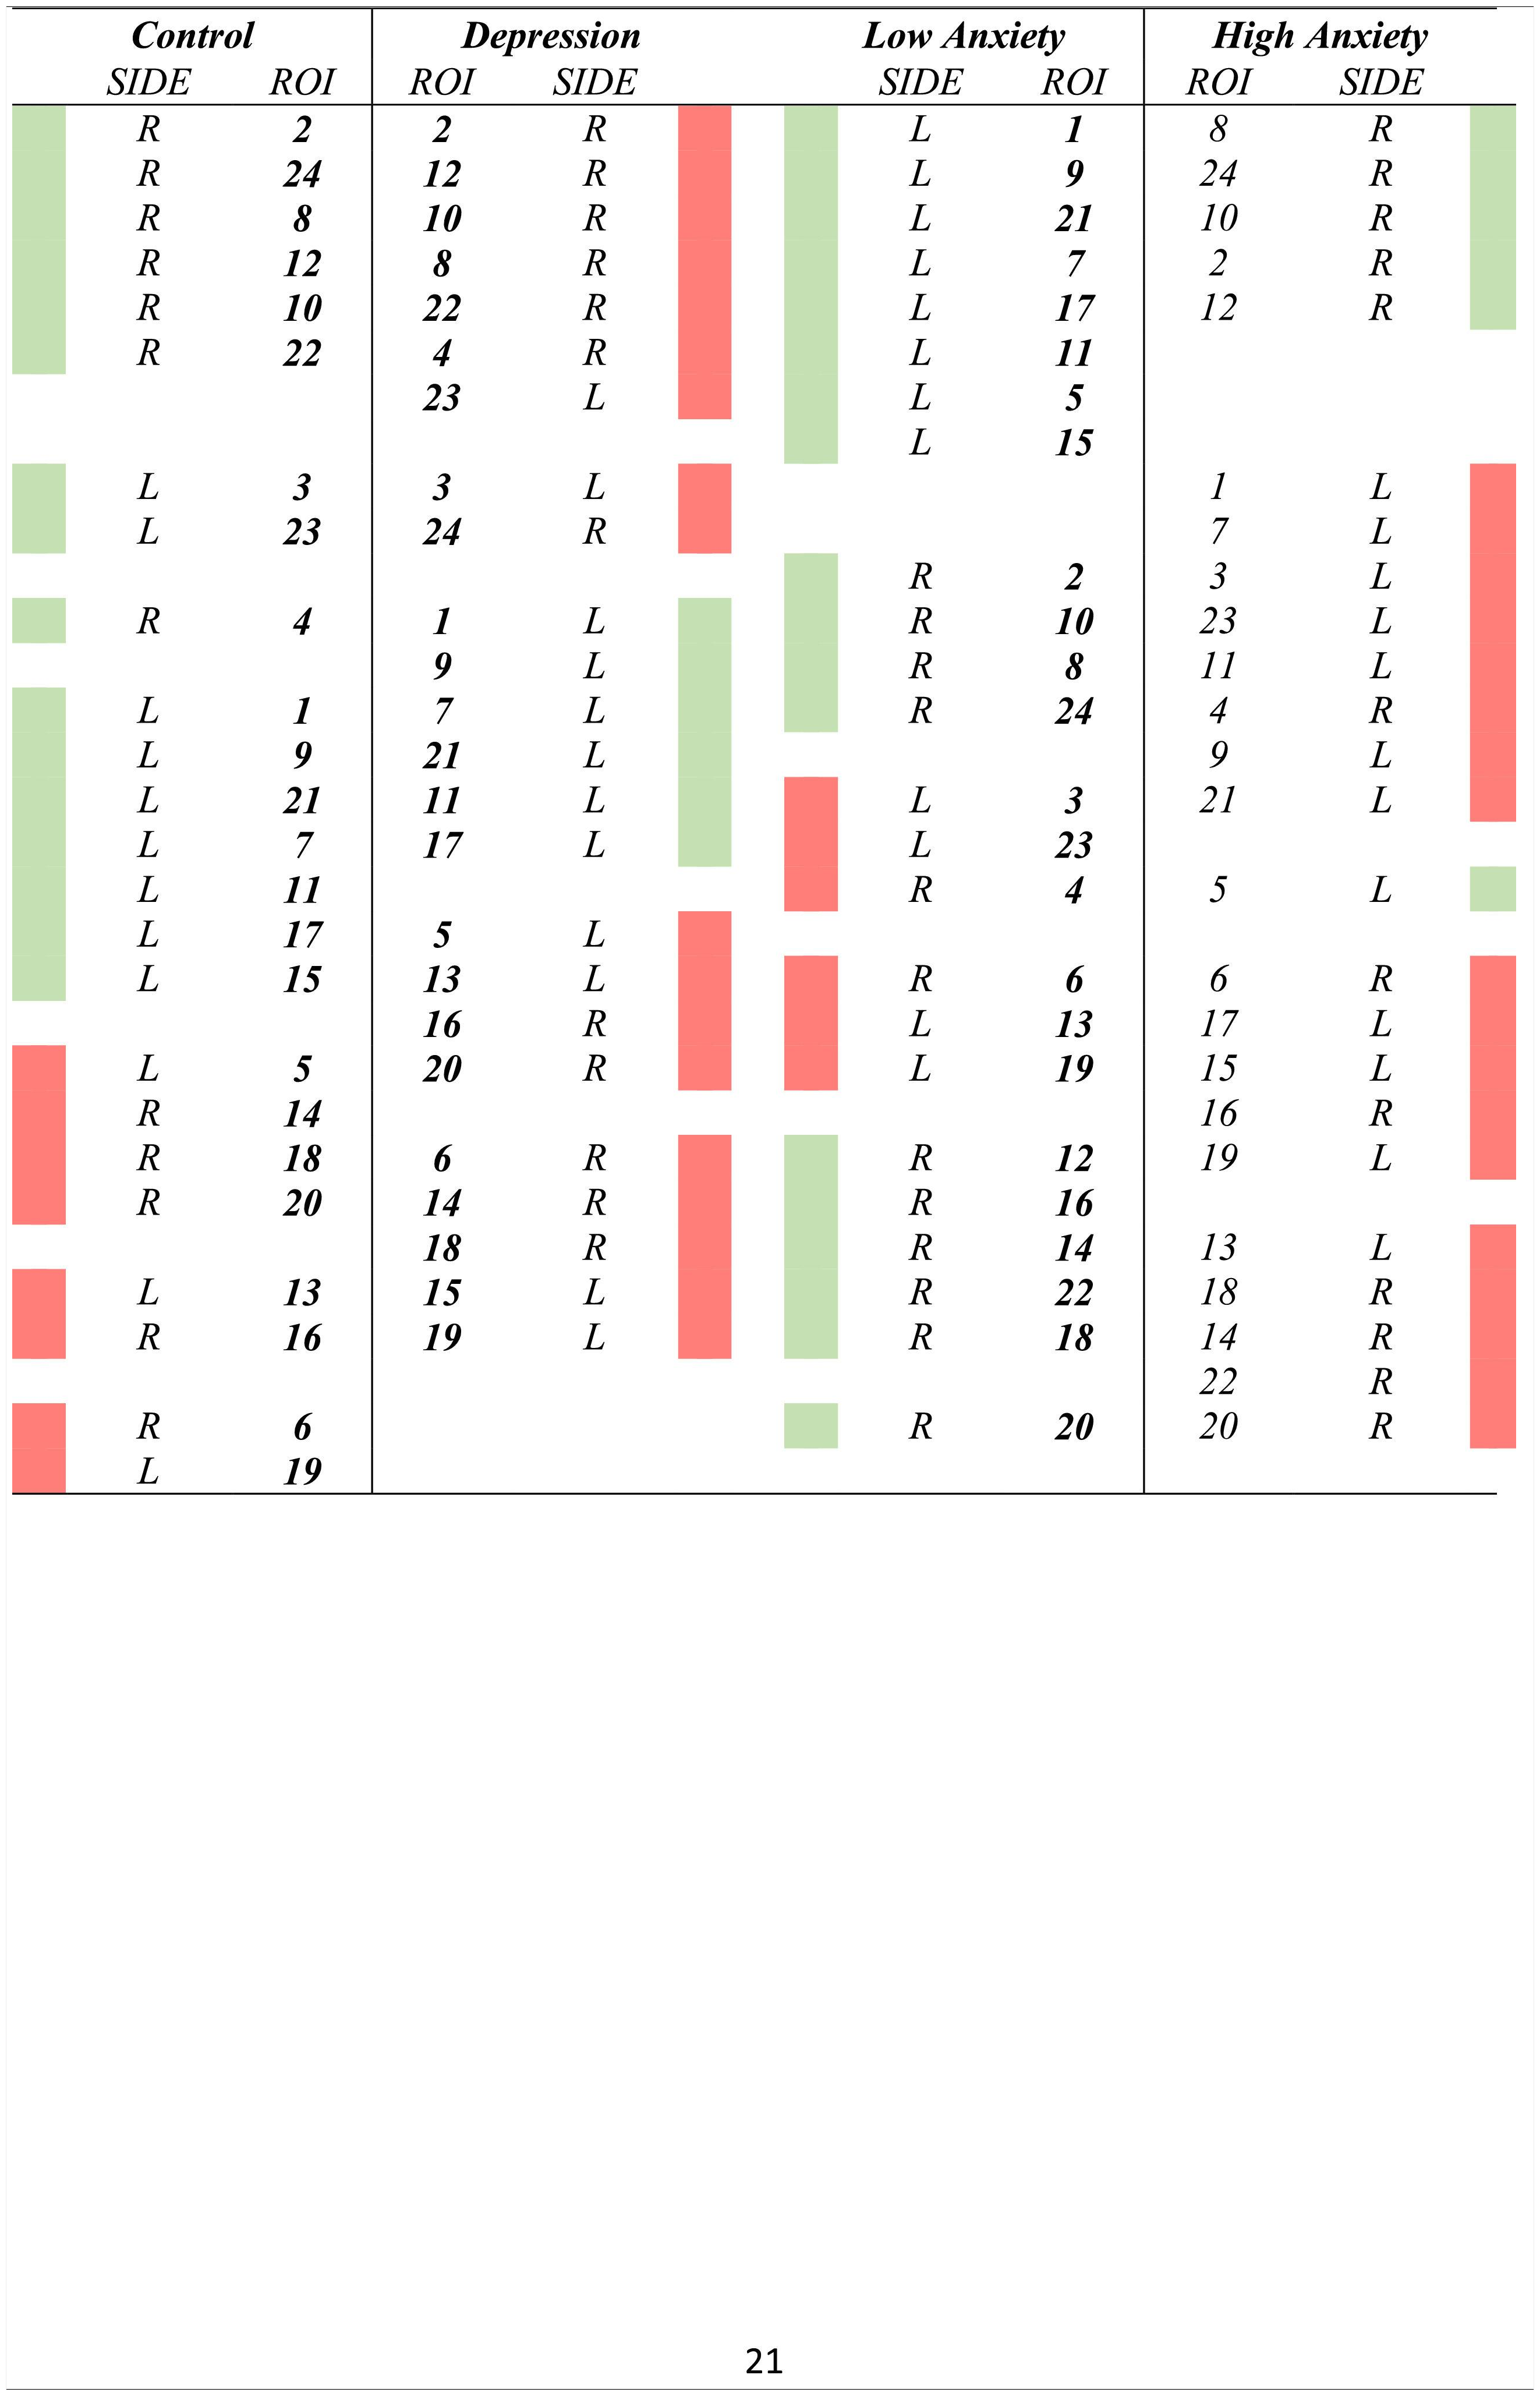
Cluster analysesTable 3 displays the results of the clusters between groups. Moreover, Fig. 1 displays the graphical representation. The clusters of ROIs within the DMN differed between the study groups. Thus, while 6 clusters in the healthy control group were extracted, with a small distance range (0.7–1.6), in patients with LLD, only 5 clusters with a greater distance range (0.8–1.8) were extracted. Additionally, as shown in Table 3, control group clusters were, in general, more lateralized than clusters observed in patients with LLD.
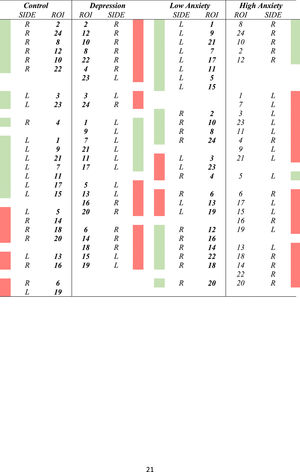

We repeated the above analyses contrasting the subgroups of subjects with low and high anxiety derived from the LLD group. In Table 3 and Fig. 1, the results of the grouping by anxiety are also shown. The average pairwise correlation in low anxiety subjects was 0.218 (SD = 0.26) and 0.179 (SD = 0.23) in high anxiety subjects. This difference was not significant [t = 1.914; df = 540.682; p = .056]. Nevertheless, similar to what we observed when comparing MDD patients to healthy controls, the 95% confidence interval of the difference between these mean values (0.218–0.179 = 0.039) ranged between 0.01 and 0.07, indicating that this difference in correlation values may reach 7 correlation units in the population of origin of the samples, with low anxiety subjects showing larger pairwise correlation values across the different ROIs.
In the cluster analysis, we observed that regions clustered differently in low- and high-anxiety subjects, as shown in Fig. 1. While anatomical ROIs were grouped into 6 clusters in low anxiety subjects, with a distance range between 0.6 and 1.8, in high anxiety subjects, we only observed 5 clusters with a distance range between 0.8 and 1.8. Finally, low-anxiety subjects showed greater lateralization than high-anxiety individuals.
DiscussionThe aim of this paper was to assess abnormal DMN activity in an LLD group compared to an age- and sex-matched group of healthy controls. Moreover, a hierarchical clustering analysis was performed, first comparing LLD patients with healthy controls and thereafter dividing the late-life depression group by anxiety symptoms. The results of our study show the value of the methods used to discriminate patients with LLD vs. age- and sex-comparable healthy controls. Specifically, patients with MDD displayed lower interregional correlations, as well as a decreased specialization of the different areas of the DMN, as reflected by a fewer number of clusters, which were also less lateralized. Finally, high anxiety levels contribute to such alterations since the pattern observed in patients with low anxiety levels resembles that of healthy controls, while patients with high anxiety levels display the pattern of alterations characterizing the whole MDD group (i.e., decreased interregional correlations and decreased regional specialization).
The combination of lower interregional pairwise correlations with an equally decreased number of clusters within the DMN suggests that this network is less efficiently organized in patients with LLD than in healthy controls. This finding concurs with previous findings indicating that patients with MDD show both increased static functional connectivity and decreased variability within the DMN (Demirtaş et al., 2016). We observed that activity within the DMN is organized in larger bilateral clusters, although, at the same time, the lack of major fluctuations in brain activity may reduce the strength of interregional correlations in pairwise analyses. This weaker intramodular functional connectivity has also been recently reported in a review of graph-theory approaches to network-level organization in MDD (Yun &Kim, 2021). Nevertheless, other studies found opposite findings (Eyre et al., 2016); therefore, although it seems clear that connectivity within the DMN is altered in MDD, further research is warranted to elucidate the clinical variables that may be significantly modulating resting-state activity and interregional connectivity within the DMN in MDD samples.
One such variable may be anxiety levels, which we observed significantly modified the pattern of DMN alteration in patients with MDD, since patients with low anxiety levels did not differ from controls in the DMN connectivity and clustering assessments. Anxiety itself is known to decrease connectivity within the DMN (Northhoff, 2020; Tumati, Paulus & Northoff, 2021) and between the DMN and other resting-state networks (Xu et al., 2019), while comorbid anxiety symptoms are indeed associated with a worse outcome of depression (Maarsingh, Heymans, Verhaak, Penninx & Comijs, 2018) and specific neurobiological alterations (Laird et al., 2019) in the elderly. Therefore, it seems that varying anxiety levels in MDD samples may significantly affect functional connectivity within the DMN and disorder severity. Likewise, these anxiety levels may also partially account for the differences between studies assessing DMN connectivity in MDD samples.
As mentioned before, alterations in the DMN have been found in several mental illnesses, such as neurodegenerative disorders or dementias. In this sense, the findings of our study are aligned with others dealing with disorders such as mild cognitive impairment, Alzheimer's disease, or autism. In all cases, a disruption in the DMN is found, always in the sense of decreased connectivity (Farras-Permanyer et al., 2019). Therefore, this network seems to be of great importance across mental health disorders. Although the DMN function was initially associated with spontaneous neural activity during resting periods (Raichle et al., 2001), recent studies suggest that DMN activation is important for different the cognitive processes involved in abstract tasks, including reading comprehension or generating mental content using information from memory (Zhang et al., 2022). Our findings suggest these domains may be preferentially altered in disorders showing DMN alterations at the neural level.
Our study is not without limitations. First, we assessed a relatively small sample of patients with LLD, although the number of subjects recruited for this research was similar to previous studies. Second, and probably related to the first point, some of our analyses did not reach statistically significant between-group differences. Nevertheless, these same analyses were significant when using alternative significance testing approaches, such as the estimation of confidence intervals. Thirdly, we did not assess the correlations of DMN regions with other brain networks. Although such comparisons are beyond the scope of this manuscript, future research studies may want to assess such potential internetwork connectivity alterations, including subcortical networks, to further characterize network-level disruptions in LLD at the whole-brain level. Likewise, we did not exclude individuals with vascular and metabolic conditions (i.e., hypertension or diabetes) which show a very high prevalence within the age range of the individuals assessed here. Although this is true both for the control and the MDD groups, it is also true that some of this health conditions may show higher prevalence in individuals with MDD (Alexopoulos, 2019), and, therefore, a potential effect on our findings cannot be ruled out. Finally, the inclusion of a group of individuals with anxiety, but no mood, disorders would have allowed to clarify the effects of anxiety on our findings. Such comparison is warranted for future research.
In sum, this is, to our knowledge, the first study of late-life depression using a clustering approach, and the results appear to be promising. In this sense, our results show that patients with LLD show a less efficiently organized DMN, with a decrease in pairwise interregional correlations and more extended intranetwork clusters. Moreover, anxiety seems to significantly contribute to such alterations. These results can help to further characterize the neurobiological correlates of MDD in the elderly and should allow the specific comparison with samples of younger patients with MDD and older patients with cognitive impairments. Such comparisons should eventually permit the identification of the brain functional alterations linking depression with neurodegenerative disorders, thus allowing the development of treatment strategies specifically targeting the brain networks where such alterations have been detected.
The authors would like to thank the study participants and the staff from Bellvitge University Hospital and Institut de Diagnòstic per la Imatge (IDI) who contributed to recruiting the study sample. This study was supported by the Agency for Management of University and Research Grants of the Catalan Government (2017SGR1247), the Carlos III Health Institute (Grants PIE14/00034, PI19/01040 and INT21/00055), the European Regional Development Fund (ERDF) "A way to build Europe", and CIBERSAM. We also thank CERCA Programme/Generalitat de Catalunya for institutional support and Ministerio de Ciencia, Innovación y Universidades, Agencia Estatal de Investigación. Grant Number: PGC2018–095829-B-I00.
