


This research informs management theory and practice concerning the efficacy of utilizing relative metrics to link consumer perceptions and attitudes and to share of wallet. The article starts with a brief discussion of the theoretical foundations for a shift from absolute to relative metrics. We then compare and contrast absolute satisfaction and relative “ranked” satisfaction data from 1714 consumers from nine countries in a banking context and report preliminary insights from a small-scale qualitative study. The results conclusively demonstrate the superiority of relative ranked satisfaction to absolute satisfaction measures in this context and, for the first time, point to statistically significant country-specific effects when linking relative satisfaction to share of wallet. We also discuss how researchers and managers might use perceptual and attitudinal metrics if the goal is linkage to customers’ buying behaviors.
Scientific researchers specialize in examining data, identifying patterns, and developing models to predict outcomes. Moreover, accessibility to data regarding consumer behaviors has grown significantly, as has the ability to identify patterns to guide management decision-making. The result has been an increased emphasis on data analytics, and a significant decline in market research in many organizations (Knowledge@Wharton, 2014).
The ability to build better predictive models is clearly a good thing. But analyzing behavioral data alone lacks a key ingredient in terms of creating and implementing great strategy: an understanding of why. To quote Wharton Marketing Professor Eric T. Bradlow, “Can you possibly predict what people are going to do? Yes, you can. However, the science of psychology – why people are doing what they are doing – in traditional marketing research provides a great complement to what can be measured” (Knowledge@Wharton, 2014).
The problem for researchers has been an inability to strongly link customers’ perceptions and attitudes to their actual buying behaviors. Models that use behavioral data frequently demonstrate much stronger linkages to customers’ future spending behaviors than models that are reliant on perceptions and attitudes alone. Consequently, many managers have taken a “watch what customers do, not what they say” approach.
Unfortunately, this approach typically lacks the competitive context necessary to make well-informed strategic decisions. This is because companies tend to have good information on customers’ buying behaviors with their firms, but almost no information about their buying behaviors with competitors, which often leads to erroneous assessments regarding customers. For example, managers often believe that their best customers (in terms of spending) do most of their category spending with their firm. However, a study by McKinsey found that a firm's high-spending customers often spend a great deal with competitors as well (Cameron, 2014). McKinsey recommended two major changes in this regard: (1) measure share of spend, and (2) discover why customers use the competition.
The problem with implementing these recommendations, from a practical perspective, is that the perceptual and attitudinal metrics that managers track to measure and manage customer loyalty do a terrible job of linking to share of wallet (Hofmeyr, Goodall, Bongers, & Holtzman, 2008; Keiningham, Gupta, Aksoy, & Buoye, 2014). Without this linkage, it is very difficult to identify correctly what managers must do to reduce customers’ perceived needs to use the competition (Keiningham, Aksoy, Williams, & Buoye, 2015).
However, recent research has found that the primary problem with linking customer perceptions and attitudes to share of wallet is not with the metrics themselves, but rather in the way these metrics are measured and analyzed. Specifically, it is not the absolute level of these metrics that is of primary importance; rather, these metrics need to be put into a competitive context so that they reflect a firm's or brand's relative position vis-à-vis competitive alternatives. For example, studies have shown that relative “ranked” satisfaction levels are much more strongly correlated to share of wallet than are absolute satisfaction levels (that is, the numerical value associated with customers’ satisfaction levels) (e.g., Hofmeyr et al., 2008; Keiningham, Cooil, Malthouse, et al., 2015). Other studies have shown that relative consumer commitment (affective, normative, and calculative) levels are much more strongly linked to share of wallet than are absolute commitment levels (Keiningham, Cooil, Aksoy, Buoye, & Kandampully, 2015).
The goal of the present study is to spur change in current management practice and academic research with regard to the measurement and management of consumers’ perceptions and attitudes. We argue that researchers need to shift from using absolute ratings to relative metrics (that is, the focal brand in comparison with competitive alternatives) when linking to customer spending behavior. We briefly discuss the theoretical foundation for a shift to relative metrics and provide empirical support by examining data from 1714 consumers from nine countries regarding their satisfaction with their banking relationships in order to compare and contrast a relative metrics approach with the traditional approach using absolute satisfaction levels. We also include insights from a preliminary, small-scale qualitative study designed to better understand consumer perceptions of relative metrics in their day-to-day purchase experience. The results of this investigation demonstrate the superiority of relative metrics to absolute metrics in linking to share of wallet.
Relative thinkingComparisons are fundamental to consumers’ decisions to use a firm or brand and to their post-purchase evaluations (Rust, Danaher, & Varki, 2000; for a review of the psychology of relative thinking in consumer decision-making, see Keiningham et al., 2014). In fact, the field of economics is often described as the study of scarcity and choice (Backhouse & Medema, 2009; Robbins, 1932). Although the question or whether individuals make rational choices has been the subject of considerable debate (e.g., Hollis & Nell, 1975), economics is nonetheless a field that examines the impact of individuals’ comparisons of alternatives and their ultimate choices. This idea has reached even greater prominence with the advent of behavioral economics (Kahneman, Slovic, & Tversky, 1982). Comparisons are a core proposition of prospect theory (Kahneman & Tversky, 1979); specifically, the evaluation of an alternative is relative to a reference point.
Moreover, the need for choice is important to our sense of identity and individualism (Markus & Kitayama, 1991). Therefore, it is not surprising that that this need carries over to our consumption experiences. In fact, the inability to choose between alternatives – referred to as “forced commitment” – tends to result in significantly lower satisfaction levels and increased customer intentions to defect, even if there are few or no alternatives (Keiningham, Frennea, Aksoy, Buoye, & Mittal, 2015).
Despite widespread agreement that relative thinking strongly influences consumer decision-making, managers and researchers overwhelmingly rely on absolute metrics, which can be misleading.
Managers tend to view particular scoring thresholds as being either “good” or “bad” scores. For example, many firms have adopted the Net Promoter Score (NPS) to gauge customers’ loyalty to their firms (Reichheld, 2003). The NPS classifies customers into one of three categories based upon their responses to a recommend likelihood question measured on a scale from 0 to 10. Customers who rate their likelihood of recommending at between 0 and 6 are classified as “Detractors,” from 7 to 8 as “Passives,” and from 9 to 10 as “Promoters.” The goal of this approach is to have customers rate their recommend likelihood as 9 or 10.
While the simplicity of such a classification system makes it easy for managers to understand and communicate within their organizations, these groupings convey a false rating level equivalence across customers. First, customers do not behave uniformly simply because they assign the same rating level. For example, in the case of NPS, being classified as a Promoter does not equate to recommending the brand. Kumar, Petersen, and Leone (2007) clearly demonstrated that most customers who indicate that they will refer a brand do not actually do so. Second, demographic and cultural characteristics impact how customers respond to survey-based rating scales (e.g., Iacobucci, Grisaffe, Duhachek, & Marcati, 2003; van Herk, Poortinga, & Verhallen, 2004). For example, research has found that Chinese and Japanese respondents are more likely to use the mid-points of a scale, whereas USA respondents are more likely to use the extremes (Chen, Lee, & Stevenson, 1995). Third, different respondents do not interpret scores or scale-labels in a uniform manner. For example, an “8” (where 10 is the maximum) may correspond to very good performance for some respondents and may only correspond to an average level of performance for others.
Relative thinking in a financial services contextBecause this investigation examines retail financial services, we conducted a small-scale qualitative study designed to elicit preliminary insights into the customer experience of relative decision-making regarding customers’ selection and usage of different financial institutions.
Using the United States banking context, we conducted telephone interviews with a convenience sample of 10 participants: five women and five men aged 22–58, all of whom do business with more than one financial institution. After the participants had shared the names of the institutions they deal with and briefly described when and why they originally chose them, participants were prompted to reflect on how and why they chose, used, and remained with more than one financial institution. Follow-up questions related to when and why participants used each of the institutions and what competing financial institutions could do to make participants choose them more often elicited rich data in the form of stories and anecdotes; these were coded following Batra, Ahuvia, and Bagozzi (2012).
Using an iterative process guided by theory (Spiggle, 1994), our analysis of verbatim interview transcripts elicited insights into how customers perceive and characterize their banking experiences. Not surprisingly, customers cited convenience, customer service, rates/fees, and significant life changes (such as marriage, having children, attending college, or moving) and recommendations from family or friends as primary reasons for choosing their banking institutions. Examination of relative choice, however, unearthed some additional reasons for engaging more than one financial institution. Table 1 presents the results of this analysis.
Customer expressions of relative choice in banking.
| Motivation | Customer expressions |
|---|---|
| Security(i.e., desire to diversify holdings in order to keep funds safe) | Gene: “I mean, I’m sure you are aware of all the fraud and things going around. What I want to avoid is having one card have access to all my money. That is why I have two accounts …That's why I split it up, for security purposes and things like that.”Rick: “I just generally like to have a couple of options. There's really no reason … It's just my nature. I’m indecisive and I don’t really trust any institution completely. So it's kind of like a not-having-all-your-eggs-in-one-basket type of thing.” |
| Function(i.e., desire to diversify holding in order to organize spending/saving) | Ann: “When I’m doing something there is paperwork all over my offices in the house. TD Bank is my business, Chase is everything that's personal, and then the money in Valley is just money … it's just there and it's safe.”Rick: “I guess that's part of the reason why I have more than one bank. It helps me differentiate what I’m doing. So I can have, for example, one online business in one bank and another in another bank. It's not the only reason, but … it's simpler.”Mark: “Some of those transaction are easier to see on one [separate] bank statement. It is just a system that I have created just to get an idea of what my expenditures are specifically for gas and food. Credit card is usually for clothing or buying things for software for your computer and things along those lines.” |
| Behavior(i.e., desire to diversify holdings in order to maintain self-control of spending/saving) | Jane: “I just like the idea of having two separate accounts. It kind of limits me, in a sense. Where I kind of have to think twice if I want to purchase something that is like a big price item. I will think about it and then use the M&T card. It's kind of more psychological in that sense, where I pause before actually using the Chase card.”Ann: “Any new saving, any new money that I have available to put away I put in Chase. [The $500,000 I have in Valley] is the money under the mattress.”Tim: “I feel like having money that you don’t see but you know is going in. So for Barclay's it's a little bit harder to take your money out because [compared to his Chase account] they have to mail it to you … I’d rather not have control of being able to take my money out until I really, really need it.” |
| Comfort(i.e., no reason and/or barriers to change) | Mary: “I don’t think I would close out my Dime accounts. I’m familiar with the process and the people … you know, it's comfort.”John: “I’ll probably move it eventually, but I’ve just been comfortable with it.”Jill: After I talk to Chase I am going to talk to TD and see if they can match it, because I would rather keep my money where it is. It is just less work.” |
The results of this qualitative investigation lend support to our overarching argument that relative thinking impacts consumers’ purchasing behaviors. Moreover, this thinking extends to customers’ selection of their financial institutions, and customers’ allocation of their money held by these institutions.
Relative metricsA number of researchers have noted that relative metrics would be preferable to absolute metrics in terms of linking to customers’ buying behaviors (Bolton, Kannan, & Bramlett, 2000; Hauser, 1991; Mägi, 2003; Olsen, 2002). For example, Dick and Basu (1994, pp. 100–101) observed: “Attitudes have been related to behaviors, although it is important to note that one may hold a favorable attitude toward a brand but not purchase it over multiple occasions because of comparable or greater attitudinal extremity toward other brands. For purposes of predictive validity, it is hence advantageous to compare brands that are viewed by consumers to be relevant in a given consumption context. The nature of relative attitudes is likely to provide a stronger indication of repeat patronage than the attitude toward a brand determined in isolation.”
Instead, the most prominent voices in the call for the use of relative metrics have come from practitioners (e.g., Hofmeyr et al., 2008; Keiningham, Cooil, Aksoy, et al., 2015; Keiningham, Cooil, Malthouse, et al., 2015; Louw & Hofmeyr, 2012). The impetus for this was the discovery by Hofmeyr et al. (2008) that the relationship between satisfaction (and other perceptual and attitudinal metrics) and customers’ share of category spending (also known as share of wallet) followed Zipf's Law (Zipf, 1935), which essentially states that the frequency of an occurrence is inversely related to its rank. Zipf's Law has been shown to apply to many different types of data studied in the physical and social sciences, including market share (Kohli & Sah, 2006), corporation size (Ramsden and Kiss-Haypál (2000), and the income distribution of companies (Okuyamaa, Takayasu, & Takayasu, 1999).
The use of Zipf's Law implies that share of wallet is a function of a brand's relative “ranked” satisfaction vis-à-vis competing brands that a customer also uses. To transform a customer's satisfaction ratings to ranks, the highest satisfaction rating a customer gives to a brand in his/her usage set is assigned a “1,” the second highest a “2,” and so on; in the case of a tie, the average is used for the ranks that would have been used if there had not been a tie. These ranks are then transformed to share of wallet estimates using the Zipf distribution.
Hofmeyr et al. (2008) and Louw and Hofmeyr (2012) proposed different methods for determining the optimal Zipf distribution. Hofmeyr et al. (2008) posited that customer i's share of wallet for brand j (with Rankij) in a usage set of size mi is:
where s(mi) is a constant that depends on the number of brands (mi).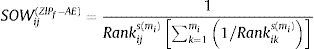
Louw and Hofmeyr (2012) posited that customer i's share of wallet for brand j (with Rankij) in a usage set of size mi is:
where j is the brand being scored and m is the number of brands. The exponent ‘s’ is set to ‘1’. Also, following Hofmeyr (2012), we define Shareij as the share of “total satisfaction” that customer i assigns to brand j:

It is important to note, however, that while the approaches of Hofmeyr et al. (2008) and Louw and Hofmeyr (2012) differ the differences in share of wallet estimates resulting from the two approaches are very small.
Keiningham et al. (2011) introduced a power law for transforming relative “ranked” satisfaction into share of wallet predictions (also based on Zipf's Law), which they called the Wallet Allocation Rule (WAR). The WAR (Keiningham et al., 2011) posits that customer i's SOW for brand j is:

The Zipf and WAR approaches have been shown to work well in linking consumer satisfaction and share of wallet. Here too, the differences between the results of these approaches tend to be small (Keiningham, Cooil, Aksoy, et al., 2015; Keiningham, Cooil, Malthouse, et al., 2015; Louw & Hofmeyr, 2012). Nonetheless, these approaches have not yet been widely adopted by researchers or managers, despite their significant improvement in linking satisfaction and share of wallet when compared to the use of absolute satisfaction levels.
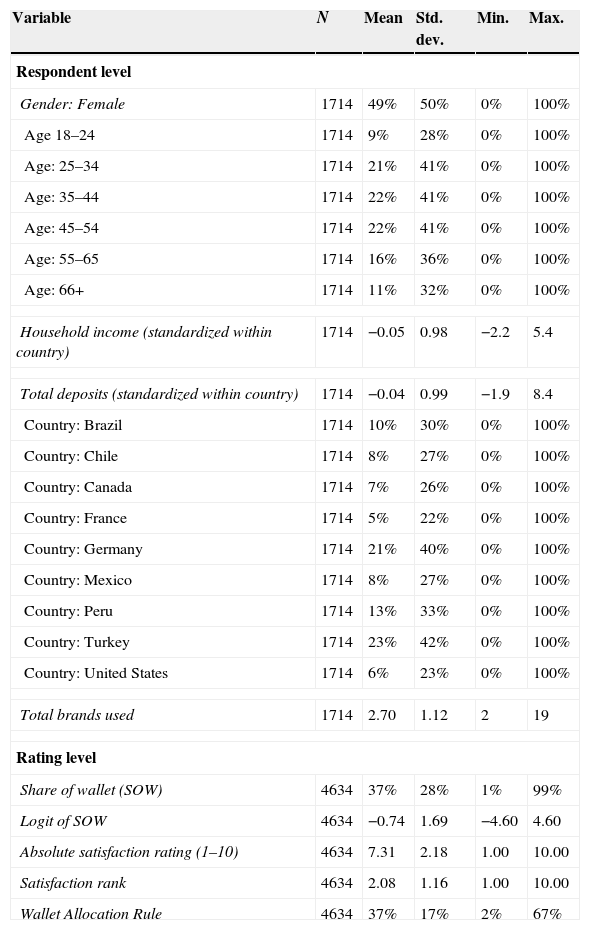
An empirical exampleAs the purpose of this investigation is to spur a shift to the use of relative metrics when linking to share of wallet, we seek to demonstrate the cross-cultural validity of a relative metrics approach in linking to share of wallet. Data for this study were gathered by a large market research firm as part of its global norms data collection. Respondents were recruited from the firm's online panels. A total of 1714 unique respondents provided 4634 ratings of over 600 retail banks across nine countries: 403 ratings by 167 respondents from Brazil, 328 ratings by 139 respondents from Canada, 285 ratings by 123 respondents from Chile, 203 ratings by 89 respondents from France, 925 ratings by 353 respondents from Germany, 332 ratings by 135 respondents from Mexico, 644 ratings by 220 respondents from Peru, 1267 ratings by 393 respondents from Turkey, and 247 ratings by 95 respondents from the USA. The sample was 49 percent female, 51 percent male, and a variety of age ranges were represented in the study: 9 percent were aged 18–24, 21 percent aged 25–34, 22 percent aged 35–44, 22 percent aged 45–54, 16 percent aged 55–65, and 11 percent aged 66 and over. On average, customers held deposits (defined here as the total value of savings and investments at all financial institutions used, including personal pension and registered retirement savings, but excluding employer-paid or government-sponsored retirement) with an average of 2.7 financial institutions.
MeasuresShare of wallet (SOW)Following Cooil, Keiningham, Aksoy, and Hsu (2007), share of wallet represents the percentage of a respondent's total deposits with a particular brand. Respondents were asked to provide this information for all of the financial institutions they used. For modeling purposes, we calculated the logit transformation of SOW – that is, Log(SOW/(1−SOW)) – which serves as the dependent variable of the analyses. This transformation removes the boundaries of the original variable and enables us to treat the dependent variable as continuous. Note that the analysis was limited to respondents who used multiple financial institutions. Fifty-six further respondents used only one financial institution, but were excluded from the analysis sample.
Customer satisfaction (absolute)Following the approach of Mittal et al. (1999), customer satisfaction is measured using a single question using an end-anchored 10-point scale (1=completely dissatisfied, 10=completely satisfied). Although multi-item constructs generally provide more reliable and predictive metrics, single-item measures of overall satisfaction have been commonly used in the scientific literature (e.g., Bolton, 1998; Bolton & Lemon, 1999; Cooil et al., 2007; Crosby & Stephens, 1987; Drolet & Morrison, 2001; Gutek, 1978; Mittal & Kamakura, 2001; Mittal et al., 1998, 1999). Furthermore, Bergkvist and Rossiter (2007) found that single-item measures perform as well as multi-item measures, as long as the focal construct is concrete and unidimensional. More importantly for the comparisons in this analysis, transformations of the ratings into ranks are often performed using a single metric. Respondents were asked for their overall satisfaction with each of the financial institutions that they use (for example, if a respondent used three brands, he or she would provide three overall satisfaction ratings).
Relative “ranked” satisfactionEach customer's satisfaction ratings for the brands that he or she used were converted into ranks. As a result, the brand with the highest rating received the lowest (that is, the best) rank and the brand with the lowest rating received the highest (worst) rank. In the event of a tie (or ties), the average of ranks for those positions was assigned to all brands sharing the same rating. For example, if a respondent rated three brands as a 10, a 9, and an 8, these ratings would be converted into ranks of 1, 2, and 3, respectively. If a respondent rated four brands as 10, 9, 9, and 7, these ratings would translate to ranks of 1, 2.5, 2.5, and 4, respectively.
Usage set sizeUsage set size corresponds to the number of brands that a respondent indicated that he or she uses. Because rank is partly a function of usage set size (for example, a respondent cannot provide a rank of 5 unless he or she uses at least five brands), any model focusing on rank must also control for usage set size.
The Wallet Allocation Rule (WAR)The Wallet Allocation Rule, defined above, has been shown to work very well compared to other more complex approaches (Keiningham, Cooil, Aksoy, et al., 2015; Keiningham, Cooil, Malthouse, et al., 2015; Louw & Hofmeyr, 2012). Moreover, the WAR is a fixed parameter model, so it requires no estimation. As the WAR is very easy for managers and researchers to use and interpret, it is used in this investigation to transform relative ranked satisfaction into predictions of share of wallet.
Potential mediating and moderating variablesTotal depositsBowman and Narayandas (2004) found that total spend has a negative moderating effect on the relationship between absolute satisfaction and share of wallet. Du, Kamakura, and Mela (2007) found that total spend also had a direct negative effect on share of wallet. Note that total spend represents 100 percent of a customer's wallet. In the present investigation, however, total “spend” is not applicable as the study focused on customers’ deposits held by various financial institutions. Respondents were asked to provide the total value of savings and investments at all of the financial institutions that they used, including personal pension and registered retirement savings, but excluding employer-paid or government-sponsored retirement. Therefore, total deposits are used as a potential mediator in this study.
Within each country, answers were provided in the local currency. For analysis, these values have been standardized within each country. Therefore, respondents with average deposits for their country would have a value of 0, and all values deviating from this mean are expressed in terms of country-specific standard deviations. Respondents who were unable or unwilling to provide this information were assigned values of 0 (that is, the mean). Seventy-three percent of respondents provided valid values for total deposits.
Household incomeHousehold income has been shown to mediate the relationship between relative “ranked” satisfaction and share of wallet (Buoye, 2015). Household income was collected from respondents in categories (under $25,000, $25,000–$49,999, etc.). Categories were unique to each country in the sample and choices were presented in local currency values. To work with the income variable across countries, the mid-point of the selected range was imputed as the income value for each respondent. Similar to the treatment of total spending in the category, these mid-point values were then standardized within country so that the average income for each respondent is expressed in terms of standard deviations from the country mean. Respondents who were unable or unwilling to provide income information were assigned values of 0 (the mean). Ninety-two percent of respondents provided valid values for income.
Other demographic variablesThe survey also collected age and gender information, which have been shown to influence consumer loyalty in prior studies (Cooil et al., 2007; Mittal & Kamakura, 2001; Seiders, Voss, Grewal, & Godfrey, 2005). Age was collected and included in the models as a series of ordinal categories. Gender was entered into the model as a binary indicator coded 1=female and 0=male.
Country indicatorsBinary indicators for Brazil, Canada, Chile, France, Germany, Mexico, Peru, and Turkey were also included as fixed effects in the model. The United States was used as the reference category. Interaction effects between these country indicators and the various absolute and relative satisfaction metrics were tested to account for international differences in response styles.
Table 2 provides descriptive statistics for the variables included in this analysis.
Descriptive statistics.
| Variable | N | Mean | Std. dev. | Min. | Max. |
|---|---|---|---|---|---|
| Respondent level | |||||
| Gender: Female | 1714 | 49% | 50% | 0% | 100% |
| Age 18–24 | 1714 | 9% | 28% | 0% | 100% |
| Age: 25–34 | 1714 | 21% | 41% | 0% | 100% |
| Age: 35–44 | 1714 | 22% | 41% | 0% | 100% |
| Age: 45–54 | 1714 | 22% | 41% | 0% | 100% |
| Age: 55–65 | 1714 | 16% | 36% | 0% | 100% |
| Age: 66+ | 1714 | 11% | 32% | 0% | 100% |
| Household income (standardized within country) | 1714 | −0.05 | 0.98 | −2.2 | 5.4 |
| Total deposits (standardized within country) | 1714 | −0.04 | 0.99 | −1.9 | 8.4 |
| Country: Brazil | 1714 | 10% | 30% | 0% | 100% |
| Country: Chile | 1714 | 8% | 27% | 0% | 100% |
| Country: Canada | 1714 | 7% | 26% | 0% | 100% |
| Country: France | 1714 | 5% | 22% | 0% | 100% |
| Country: Germany | 1714 | 21% | 40% | 0% | 100% |
| Country: Mexico | 1714 | 8% | 27% | 0% | 100% |
| Country: Peru | 1714 | 13% | 33% | 0% | 100% |
| Country: Turkey | 1714 | 23% | 42% | 0% | 100% |
| Country: United States | 1714 | 6% | 23% | 0% | 100% |
| Total brands used | 1714 | 2.70 | 1.12 | 2 | 19 |
| Rating level | |||||
| Share of wallet (SOW) | 4634 | 37% | 28% | 1% | 99% |
| Logit of SOW | 4634 | −0.74 | 1.69 | −4.60 | 4.60 |
| Absolute satisfaction rating (1–10) | 4634 | 7.31 | 2.18 | 1.00 | 10.00 |
| Satisfaction rank | 4634 | 2.08 | 1.16 | 1.00 | 10.00 |
| Wallet Allocation Rule | 4634 | 37% | 17% | 2% | 67% |
We employ hierarchical cross-classified models (HCM) estimated using PROC MIXED in SAS, which fits both fixed and random effects (Singer, 1998). In traditional multi-level modeling, data are hierarchically nested (that is, respondents within brands). Our data are not perfectly nested (respondents rate anywhere between two and 19 brands, and some respondents rated multiple brands). Hierarchical cross-classified modeling enables the level-1 units to belong to multiple non-nested level-2 units. Ratings are considered to be the first level and are cross-classified by the second levels (in this case, respondent and brand). We allow for random intercepts for respondent and brand to address the cross-classified structure of the data. (The random intercept for respondent in each of the models was estimated to be 0, so we have omitted this parameter from the model tables.)
Analysis and findingsThe primary goal of our investigation was to compare and contrast absolute satisfaction and relative “ranked” satisfaction (transformed using the WAR). Table 3 presents the results of our analysis.
Hierarchical cross-classified models of (logit of) share of wallet.
| DV=logit of share of wallet | ||
|---|---|---|
| Model 1 | Model 2 | |
| Fixed effects | ||
| Intercept | −2.2288*** | −2.3538*** |
| (0.1844) | (0.2115) | |
| Satisfaction measures | ||
| Absolute satisfaction rating (1–10) | 0.1887*** | −0.03404 |
| (0.01108) | (0.02153) | |
| Wallet Allocation Rule (WAR) | 3.4354*** | |
| (0.4688) | ||
| Respondent effects | ||
| Gender: Female | 0.1193* | 0.01022 |
| (0.04743) | (0.04209) | |
| Age 25–34 | −0.09823 | −0.02616 |
| (0.09616) | (0.08514) | |
| Age 35–44 | 0.003205 | 0.007395 |
| (0.09591) | (0.08493) | |
| Age 45–54 | 0.01237 | 0.02109 |
| (0.09727) | (0.08611) | |
| Age 55–65 | −0.02123 | 0.00929 |
| (0.1026) | (0.09084) | |
| Age 66+ | −0.1136 | −0.06631 |
| (0.1196) | (0.1059) | |
| Household income (standardized within country) | −0.08074** | −0.1349** |
| (0.02493) | (0.04888) | |
| Total deposits (standardized within country) | −0.08066** | −0.01039 |
| (0.02505) | (0.02227) | |
| Country effects | ||
| Brazil | 0.3705 | 0.06922 |
| (0.2068) | (0.1812) | |
| Chile | 0.2009 | −0.01297 |
| (0.1953) | (0.1713) | |
| Canada | 0.348 | −0.01291 |
| (0.2141) | (0.1877) | |
| France | 0.652** | 0.1062 |
| (0.2195) | (0.1927) | |
| Germany | −0.3218 | −0.302* |
| (0.1724) | (0.151) | |
| Mexico | 0.1712 | −0.04179 |
| (0.1999) | (0.1754) | |
| Peru | −0.07611 | −0.01216 |
| (0.182) | (0.1598) | |
| Turkey | −0.2493 | −0.03064 |
| (0.1755) | (0.1537) | |
| Interaction effects | ||
| WAR*absolute satisfaction rating | 0.2084*** | |
| (0.05946) | ||
| WAR*household income | 0.3273** | |
| (0.1206) | ||
| Random effects | ||
| Intercept, Brand | 0.1807*** | 0.1329*** |
| (0.04173) | (0.02999) | |
| Residual | 2.4616*** | 1.9282*** |
| (0.05185) | (0.04059) | |
| Fit statistics | ||
| −2LL | 17493.8 | 16367.8 |
| AIC (smaller is better) | 17497.8 | 16371.8 |
| BIC (smaller is better) | 17493.8 | 16367.8 |
| R-square (total) | 8.5% | 28.6% |
Model 1 includes only the absolute satisfaction rating, along with the demographic and country covariates. Consistent with previous research, absolute satisfaction has a statistically significant, positive effect on share of wallet. However, the model itself is quite weak, explaining only 8.5 percent of the total variation in the logit of SOW. Beyond this, we find significant negative effects of income and total assets, as well as positive effects for the classification variables for Female and France.
Model 2 adds the WAR calculation based on the relative “ranked” satisfaction and total number of brands used. Also included are interaction effects between WAR and absolute satisfaction, as well as WAR and estimated household income. Model 2 is clearly superior to Model 1. First, the model R-square, while modest compared to other WAR-based models in the extant research, is nonetheless more than three times greater than the R-square of the absolute satisfaction only model (28.6 percent vs. 8.5 percent). AIC and BIC (smaller is better) are also much improved over Model 1, indicating superior model fit. Second, WAR is by far the strongest predictor in this model. While there is a significant interaction effect between WAR and absolute satisfaction, the main effect of absolute satisfaction is statistically insignificant.
As reported in previous research (Buoye, 2015), income has a significant, positive interaction with WAR, indicating that the impact of a change in the WAR score on share of wallet is greater among respondents with higher levels of income. The main effect of income also remains significant (and negative). The negative effect of total deposits, however, is attenuated and not statistically significant. We also find a statistically significant effect for Germany.
Discussion of findingsAlthough the primary purpose of this research was to demonstrate the superiority of relative ranked satisfaction to absolute satisfaction in linking to share of wallet, these findings also advance the empirical research on this topic in an important way. Specifically, this is, to our knowledge, the first analysis to find a statistically significant country-specific effect when linking relative “ranked” satisfaction to share of wallet. Specifically, Germany was found to be significantly different from the control (that is, the USA). This may be a function of the German banking market itself, both in terms of its structure and competitive landscape (see Keiningham, Aksoy, 2015, pp. 73–75, for a description of the German banking market). It is important to note that Buoye's (2015) multi-country examination of relative ranked satisfaction (using WAR) and share of wallet in the grocery retail sector did not find any country-specific effect (and Germany was one of the countries examined). Therefore, our findings suggest that, in some industries, country-specific effects may occur even when using relative “ranked” satisfaction.
Our results also confirm the finding of Buoye (2015) that income has a significant negative effect on the relationship between satisfaction and share of wallet, and this effect is not eliminated when using relative ranked satisfaction. This could result from the fact that income has been shown to negatively impact customer loyalty (Crask & Reynolds, 1978; Korgaonkar, Lund, & Price, 1985; Zeithaml, 1985), a finding that is widely believed to result from the increased options available to higher income consumers (Sharir, 1974; Zeithaml, 1985).
In terms of the primary goal of this examination, the results conclusively demonstrate the overwhelming superiority of relative ranked satisfaction to absolute satisfaction in linking to share of wallet. This finding has profound implications for how researchers and managers should use perceptual and attitudinal metrics if their goal is linkage to customers’ buying behaviors. For managers, a shift from focusing on the satisfaction “score” to a focus on satisfaction “rank” would represent a major change in current practice. For researchers, a shift to relative metrics offers the opportunity to create more comprehensive and explanatory models of customers’ buying behaviors. It also offers many new avenues for future research. Given that research into customer commitment has also been shown to be relative, it appears likely that many other perceptual and attitudinal metrics will also demonstrate similar properties.
Finally, these results appear to have major implications for how firms identify and prioritize improvement opportunities (traditionally done through “key driver” analyses). Given that what drives a firm's rank would be expected to differ from what drives the rank(s) of its competitors, it appears likely that improving rank (and therefore share of wallet) is largely driven by reducing customers’ perceived needs to use the competition, as opposed to those elements that drive satisfaction with the brand. Additionally, the customer experiences described in our qualitative data suggest that a level of strategic, functional, and psychological consideration exists with respect to relative decision-making in the banking context that has implications for both theoretical decision-making constructs and marketing practice.
As with all research, the present study has certain important limitations. We examined one industry using cross-sectional, self-reported share of wallet data. As such, these findings demonstrate a statistically significant relationship, but do not demonstrate causality. Therefore, additional research is needed to further establish the robustness of this approach. Despite these limitations, this research presents compelling evidence of the improved performance of relative ranked satisfaction in linking to share of wallet.
