


Computer-aided diagnosis (CAD) is a tool with great potential to help endoscopists in the tasks of detecting and histologically classifying colorectal polyps. In recent years, different technologies have been described and their potential utility has been increasingly evidenced, which has generated great expectations among scientific societies. However, most of these works are retrospective and use images of different quality and characteristics which are analysed off line. This review aims to familiarise gastroenterologists with computational methods and the particularities of endoscopic imaging, which have an impact on image processing analysis. Finally, the publicly available image databases, needed to compare and confirm the results obtained with different methods, are presented.
El diagnóstico asistido por computador (DAC) constituye una herramienta con gran potencial para ayudar a los endoscopistas en las tareas de detección y clasificación histológica de los pólipos colorrectales. En los últimos años se han descrito diferentes tecnologías y ha aumentado la evidencia sobre su potencial utilidad, lo que ha generado grandes expectativas en las sociedades científicas. Sin embargo, la mayoría de estos trabajos son retrospectivos y utilizan imágenes de diferente calidad y características que son analizadas off-line. En esta revisión se pretende familiarizar a los gastroenterólogos con los métodos computacionales y las particularidades de la imagen endoscópica con impacto en el análisis del procesamiento de imágenes. Finalmente, se exponen las bases de datos de imágenes disponibles de forma pública que son necesarias para poder comparar y confirmar los resultados obtenidos con diferentes métodos.
Despite significant advances that have been made in endoscopy, up to 21% of polyps are not visualised during colonoscopy.1 It is well known that the rate of detection of adenomas has an inverse correlation with the incidence of interval colorectal cancer and with the mortality rate associated with colorectal cancer.2 Therefore, it is essential to perform a high-quality colonoscopy and decrease the number of polyps that go undetected.
To improve the efficacy of colonoscopy, several authors have proposed a strategy of “resecting and ruling out”3 or “leaving in situ”4 based on a histological prediction in vivo. In accordance with this, a very small polyp (≤5mm) located in the rectum or sigmoid colon, with a high-confidence optical diagnosis of a hyperplastic polyp with no associated serrated polyposis syndrome, could be left in situ given that its malignant potential is null and it does not require monitoring.5 However, application of this strategy requires a negative predictive value (NPV) for a diagnosis of adenoma ≥90% (when it is used with high confidence), according to the Preservation and Incorporation of Valuable Endoscopic Innovations (PIVI) recommendations of the American Society for Gastrointestinal Endoscopy (ASGE).6 A high-confidence optical diagnosis of an adenomatous polyp measuring less than 10mm would allow for resection, with no need to refer the case to Anatomical Pathology for histopathological diagnosis. These strategies could only be executed by endoscopists who comply with these recommendations, and therefore possess a high level of expertise.
To overcome these limitations, computer-assisted diagnosis (CAD) is an appealing alternative, since it could help to improve rates of detection and prevent errors in characterising polyps. Diagnostic decisions could then be made in vivo; this would optimise patient management (in terms of use of time and resources as well as prevention of complications associated with unnecessary polypectomies).
To develop efficient CAD systems, the contents of colonoscopy videos and images should be meticulously analysed by experts in image processing and machine learning, who will establish models to enable searches for lesions and indicators identified by physicians. Most of the existing studies in this regard have focused on the development of methods for precise characterisation of the different elements of the endoluminal scene, paying special attention to polyps. Generating and acquiring high-quality images is also crucial so that these computational methods function as anticipated, as image artefacts have a negative impact on the performance of polyp location methods.7
Special features of endoscopic images with an impact on image processing analysisThe most important challenges that a particular computational method must address in order to provide efficient support are those related to image acquisition and formation and those tied to characterisation of the anatomical structures that appear in the endoluminal scene (Fig. 1).8
 polyp; (2) luminal region; (3) folds; (4) blood vessels; (5) bowel contents; (6) specular reflections; and (7) black mask.")
With regard to image acquisition and formation, some characteristics that may affect the performance of a computer vision method are as follows:
- -
Appearance of specular reflections and lack of uniform lighting
- -
Colour artefacts
- -
Low image resolution
- -
Interlacing
- -
Superimposed information (e.g. patient details)
- -
A black frame surrounding the image
- -
Image compression
Specular reflections are very common when lighting is perpendicular to the polyp surface, and they make image processing difficult,7 as they appear as very prominent structures that furthermore hide the colour and texture information corresponding to the surfaces on which they appear. Axial lighting is not uniform, such that structures closer to the endoscope will appear brighter than structures farther from it (Fig. 2A–C).
 specular reflections; (B) over-exposed polyp; and (C) under-exposed polyp. The polyps in images (B) and (C) are delimited with a blue mask to facilitate visualisation. Variability in polyp appearance: (D) frontal view; (E) lateral view. Example of similarity of response of different structures (F and G). The number “1” represents a polyp, the number “2” represents a fold and the number “3” represents several blood vessels.")
Special features of endoscopic images with an impact on image processing analysis. Examples of effects of lighting: (A) specular reflections; (B) over-exposed polyp; and (C) under-exposed polyp. The polyps in images (B) and (C) are delimited with a blue mask to facilitate visualisation. Variability in polyp appearance: (D) frontal view; (E) lateral view. Example of similarity of response of different structures (F and G). The number “1” represents a polyp, the number “2” represents a fold and the number “3” represents several blood vessels.
With respect to characterisation of anatomical structures, description of the different elements that appear in the endoluminal scene represents several challenges for computer vision-based systems:
- -
Lack of a uniform appearance of the structure. Polyps do not have a single uniform appearance; rather, their appearance depends to a great extent on the point of view of the observer (frontal or lateral view) (Fig. 2D and E). Therefore, most image processing methods are centred on searching for intrinsic characteristics of each structure such that they may be observed in the majority of cases, regardless of how the image was taken.
- -
Impact of other elements of the scene in characterising a particular element. Continuing with the polyp example, most studies are based on identification of polyp contours, which, in terms of image processing, are not very different from blood vessels and folds, as may be seen in Fig. 2F and G. Bearing this in mind, a computational method should consider the impact of all structures present and find additional elements to distinguish them from one another.
Methods for detecting polyps are intended to determine whether or not a polyp is present in an image, and are usually designed to alert endoscopists with a sound or marker when the presence of a polyp is suspected whilst a colonoscopy is being performed.
Methods for locating polyps may be understood as an extension of methods for detecting polyps. In this case, in addition to revealing the presence of a polyp, they highlight the area of the image where it is located.
Methods for detecting and locating polyps are usually divided into 3 groups according to the methodology on which they are based: (a) hand-crafted, (b) machine learning and (c) hybrid (which combine characteristics of the other two groups).9
Hand-crafted methodsMethods in this group are usually based on a previously established model of the appearance of the anatomical structure to be modelled, and are focused on defining filters and specific mathematical operations for each problem to be solved, not ensuring their application in other domains in which they were established. The nature of this method is such that large amounts of data are not needed in order for methods belonging to this group to be developed, although their capacity for adaptation to the actual appearances of structures depends on the complexity of the model on which they are based.
In the case of colon polyps, most existing methodologies are based on the use of low-level image processing tools (such as contour extraction) to obtain those parts of the image that are candidates for forming part of a polyp contour. To this end, Iwahori et al.10 used Hessian matrix filters, Bernal et al.7,11 used valleys of intensity and Silva et al.12 used the Hough transform. This information is used to later define restrictions that are only applicable to polyp contours: Zhu et al.13 used the curvature of said contours as a key characteristic, whereas Kang and Doraiswami14 focused on distinguishing contours with an elliptical shape, typically associated with polyps.
Machine learning methodsMachine learning systems are systems that, once trained to perform a particular task based on examples, are able to replicate it in a set of new data. Typically, 3 different stages are identified in the design of these systems: a training stage, a validation stage and a test stage. The first 2 stages are performed on a single set of data that is wholly known (in terms of both input data and expected output), whereas test set data are unknown in the system development phase.
Various research groups have used machine learning methods to detect polyps, establishing the set of characteristics to be extracted from the image (shape, colour and texture) and the learning method to be used (from decision trees to support vector machines).
Regarding the type of characteristics used, Karkanis et al.15 proposed using colour wavelets, whereas Ameling et al.16 explored the use of textural characteristics through co-occurrence matrices. A study by Gross et al.17 also focused on using textural characteristics through local binary patterns. Concerning the learning method, Angermann et al.18 proposed the use of active learning techniques through which the system improves based on learning from positive and negative examples.
In light of the increased availability of high-capacity computational tools such as graphics processing units (GPUs), the use of techniques based on convolutional neural networks (deep learning) has also been explored for polyp detection tasks. The advantage of using techniques based on deep learning is that they are able to learn from large volumes of data, with no need to specify what sort of characteristic they are to seek. The main differences within this group of methods lie in the specific network architecture employed and the databases used for training and validation. Liu et al.19 used the ResNet architecture to detect polyps and obtained a system that works in real time (processes more than 25 images per second), with a rate of detection close to 80% when tested in the CVC-VideoClinicDB database. Zheng et al.20 approached the problem of polyp detection in a 2-step process. In the first step, they attempted to delimit all the structures in an image using U-Net architecture. In the second step, they used tracking techniques to determine the ultimate location of the polyp. Their method attained sensitivity values in excess of 95%, also tested in the CVC-VideoClinicDB database.21 A final interesting example may be found in a study by Qadir et al.,22 who combined a first step using Faster RCNN architecture to select candidate polyp-containing regions and a second step focused on eliminating false positives by including analysis of previous images. This system achieved precision values of more than 90% in the CVC-VideoClinicDB database.
Validation of methodologiesAs may be extrapolated, comparison of different methods is complicated due to a lack of public databases which would allow them to be validated. With the aim of solving this problem, motivated by the growing and successful use of machine learning techniques in other fields, an effort was undertaken to collect, annotate and publish databases containing images and videos of colonoscopies. From there, various international challenges have taken place in which different teams have competed by putting their various proposals for automatic polyp detection to the test. To date, 4 different editions have taken place: (1) Automatic polyp detection challenge at the IEEE International Symposium on Biomedical Imaging (ISBI), held in New York in 2015 and organised jointly by Arizona State University (ASU) and the Computer Vision Center (CVC), (2) Automatic polyp detection in colonoscopy videos, as part of the International Conference on Medical Image Computing and Computer Assisted Intervention (MICCAI), held in Munich in 2015 and organised jointly by ASU, the CVC and the ETIS laboratory at ENSEA. Since 2017, the scope of the challenge has been broadened to include additional tasks such as segmentation of polyps and detection of lesions in capsule endoscopy imaging, as part of the Gastrointestinal Image Analysis (GIANA) challenge. There have been 2 editions of GIANA as part of the MICCAI conference: one in Quebec in 2017 and one in Granada in 2018. Both generated a great deal of interest on the part of the scientific community, with more than 20 teams having participated in the latter edition.
The first polyp detection challenge held as part of the MICCAI conference in 2015 also served the purpose of conducting a comparative study among 8 automatic polyp detection methodologies using the same database, and established a common framework for validation that may be useful for comparing methodologies in the future9 (Fig. 3). The study showed better performance in those that used machine learning. This trend has been maintained in subsequent challenges, which have witnessed generalised use of deep learning techniques due to their performance and, most importantly, high-speed calculation associated with the use of high-capacity graphics cards.
 original image; (B) CUMED; (C) CVC-CLINIC; (D) PLS; (E) UNS-UCLAN; (F) ETIS-LARIB; (G) OUS; and (H) SNU. The green line in each image represents the mask for the polyp in question.")
Comparison of energy maps provided by each participant method in the polyp detection challenge at the 2015 MICCAI conference: (A) original image; (B) CUMED; (C) CVC-CLINIC; (D) PLS; (E) UNS-UCLAN; (F) ETIS-LARIB; (G) OUS; and (H) SNU. The green line in each image represents the mask for the polyp in question.
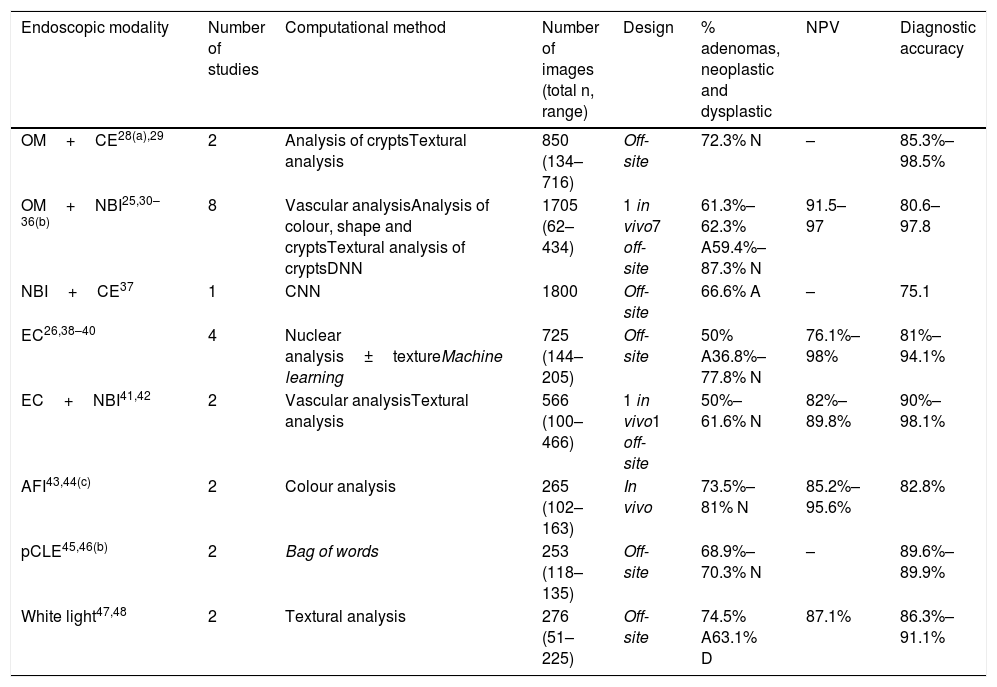
Several groups have developed CAD systems for characterising colorectal polyps.23,24 Most of these methods require advanced optical diagnostic equipment, such as narrow band imaging (NBI), endocytoscopy and others, and some of them attain the required 90% NPV threshold in very small polyps of the rectum or sigmoid colon, described in the ASGE's PIVI document.6 Image analysis also uses very different methodologies ranging from automatic analysis of some characteristics of the surface texture or colour of the polyp to deep learning methods. However, one characteristic that they all share is semi-automatic identification of the area corresponding to the polyp, since the endoscopist should indicate the region of interest by centring the polyp in the image25 or placing it in contact with the endoscope.26,27 Results of published studies are summarised in Table 1.
Computational histology prediction studies of colorectal polyps based on image analysis.
| Endoscopic modality | Number of studies | Computational method | Number of images (total n, range) | Design | % adenomas, neoplastic and dysplastic | NPV | Diagnostic accuracy |
|---|---|---|---|---|---|---|---|
| OM+CE28(a),29 | 2 | Analysis of cryptsTextural analysis | 850 (134–716) | Off-site | 72.3% N | – | 85.3%–98.5% |
| OM+NBI25,30–36(b) | 8 | Vascular analysisAnalysis of colour, shape and cryptsTextural analysis of cryptsDNN | 1705 (62–434) | 1 in vivo7 off-site | 61.3%–62.3% A59.4%–87.3% N | 91.5–97 | 80.6–97.8 |
| NBI+CE37 | 1 | CNN | 1800 | Off-site | 66.6% A | – | 75.1 |
| EC26,38–40 | 4 | Nuclear analysis±textureMachine learning | 725 (144–205) | Off-site | 50% A36.8%–77.8% N | 76.1%–98% | 81%–94.1% |
| EC+NBI41,42 | 2 | Vascular analysisTextural analysis | 566 (100–466) | 1 in vivo1 off-site | 50%–61.6% N | 82%–89.8% | 90%–98.1% |
| AFI43,44(c) | 2 | Colour analysis | 265 (102–163) | In vivo | 73.5%–81% N | 85.2%–95.6% | 82.8% |
| pCLE45,46(b) | 2 | Bag of words | 253 (118–135) | Off-site | 68.9%–70.3% N | – | 89.6%–89.9% |
| White light47,48 | 2 | Textural analysis | 276 (51–225) | Off-site | 74.5% A63.1% D | 87.1% | 86.3%–91.1% |
A: adenoma; AFI: autofluorescence imaging; CE: chromoendoscopy; CNN: convolutional neural network; D: dysplastic; DNN: deep neural network; EC: endocytoscopy; OM: optical magnification; N: neoplastic; NBI: narrow band imaging; pCLE: probe-based confocal laser endomicroscopy; NPV: negative predictive value.
Studies by Takemura et al.28 and Hafner et al.29 used chromoendoscopy and optical magnification. The former computationally analysed the pattern of crypts quantitatively in 134 images, and the latter examined various textural characteristics in 716 images (72.3% neoplastic polyps). Takemura attained extraordinary diagnostic accuracy (98.5%), but the gold standard was the Kudo classification. By contrast, Hafner's study achieved a rate of diagnostic accuracy of 85.3%; sensitivity and specificity were 88.6% and 76.6%, respectively.
Optical magnification and NBIIn 2009, Varnavas et al.30 reported an initial clinical study with 62 images (61.3% adenomas) using a CAD method based on calculation of vascular characteristics in images with NBI and magnification, with rates of diagnostic accuracy, sensitivity and specificity of 80.6%, 81.6% and 79.2%, respectively, in the differentiation of colorectal adenomas. Subsequently, in 2010, Tischendorf et al.31 published a prospective clinical study with the same endoscopic modality whose proposed computational methodology included the following steps: (1) image pre-processing, (2) segmentation of vascular structures, (3) extraction of characteristics of vascular structures (length, brightness, perimeter and others) and (4) ultimate image classification. These authors used 209 images (76.6% neoplastic polyps) and obtained rates of sensitivity, specificity and diagnostic accuracy of 90%, 70.2% and 85.3%, respectively, in differentiation between neoplastic and non-neoplastic polyps. In 2011, Gross et al.32 achieved a rate of diagnostic accuracy of 93.1%, also with a methodology based on NBI and magnification as well as analysis of vascular mapping in 434 images (59.4% neoplastic polyps); sensitivity, specificity and predictive values also exceeded 90%. In 2012, Takemura et al.33 also used a large number of images (n=371, 87.3% neoplastic polyps); they analysed the colour, shape and size of the crypts and attained still better results: a rate of diagnostic accuracy of 97.8%, with similar sensitivity and specificity. A study by Tamai et al.34 which also used the same endoscopic modality, computationally analysed polyp vascularisation characteristics (121 images, 82.6% neoplastic polyps) and obtained the following results: sensitivity 83.9%, specificity 82.6%, positive predictive value (PPV) 53.1%, NPV 95.6% and diagnostic accuracy 82.8%. A recently published study by Chen et al.35 used deep neural network computational methodology on 284 images (66.2% neoplastic polyps) and achieved a sensitivity of 96.3%, a specificity of 78.1%, a PPV of 89.6%, a NPV of 91.5% and a diagnostic accuracy of 90.1%.
In addition, Byrne et al.36 also used deep neural network computational methodology for real-time (though not in vivo) recognition of adenomatous/hyperplastic polyps, with a diagnostic efficacy of 94%, a sensitivity of 98%, a specificity of 83%, a PPV of 90% and a NPV of 97% by analysing colonoscopy videos (not isolated images) with near-focus NBI.
However, these studies were based on images analysed subsequent to rather than during the examination. By contrast, Kominami et al.25 reported a more robust and suitable algorithm for clinical use in real time that offered a classification of polyps in vivo during endoscopy. The study included 118 images (62% of neoplastic polyps), analysed textural characteristics of crypts and attained a 93.2% rate of accurate differentiation between neoplastic and non-neoplastic lesions; sensitivity, specificity and predictive values also exceeded 90%.
NBI and chromoendoscopyKomeda et al.37 used convolutional neural networks on 1800 images (66.6% adenomas) extracted from colonoscopy videos with white light, NBI and chromoendoscopy, and achieved a rate of diagnostic accuracy for differentiation of adenomas of 75.1%.
EndocytoscopyEndocytoscopy has also been used for automatic classification of polyps, since it provides focused images of a fixed size that enable easier and more robust image analysis using CAD. The first models published by Mori et al.26,38,39 were based on automatic extraction of characteristics magnified 380× of the nucleus and elements with vascularisation. These characteristics were incorporated into a machine learning classifier. This approach attained a rate of diagnostic accuracy around 90% for identification of adenomas/neoplastic lesions, with a lapse of just 0.2–0.3 seconds from image capture to presentation of the result. In this way, polyp type was predicted in real time and a probability was given. In cases in which that probability was >90%, the system indicated its “high confidence” that the polyp type was, for example, adenoma.26 Subsequently, Takeda et al.40 also used endocytoscopy with approximately 400× magnification. They trained the method with 5543 images of 238 lesions and used it on 200 images. The sensitivity, specificity, PPV, NPV and diagnostic accuracy obtained in these series were 89.4%, 98.9%, 98.8%, 90.1% and 94.1%, respectively. In 2018, Mori et al.39 published another series with 144 images (36.8% neoplastic polyps) and obtained the following results: sensitivity 98%, specificity 71%, PPV 67%, NPV 98% and diagnostic accuracy 81%.
Endocytoscopy and NBIStudies with endocytoscopy and NBI have also been published. Misawa et al.41 used 100 images magnified 380× (50% neoplastic polyps) and analysed vascularisation. They achieved a rate of diagnostic accuracy of 90%, a sensitivity of 84.5%, a specificity of 97.6%, a PPV of 98% and a NPV of 82%. Recently, Mori et al.42 improved their results using endocytoscopy with 520× magnification and NBI on 466 images (61.6% neoplastic polyps) in real time and in vivo, analysing textural characteristics, and obtained a rate of diagnostic accuracy in assessment of very small neoplastic/non-neoplastic polyps of 98.1% (457/466); sensitivity, specificity and predictive values were around 90%.
AutofluorescenceAutofluorescence imaging (AFI) is another endoscopic modality that has been used for endoscopic histological prediction of colorectal polyps using numerical computational analysis of colour. A rate of diagnostic accuracy of 82.8% has been reported with this technique.43,44 It was applied in studies in vivo using 102 and 163 Images 73.5% and 81% neoplastic polyps, respectively). A study by Aihara et al.43 achieved a sensitivity of 94.2%, a specificity of 88.9%, a PPV of 95.6% and a NPV of 85.2%; these figures were 83.9%, 82.6%, 53.1% and 95.6% in a study by Inomata et al.44
Confocal laser endomicroscopySoftware has also been developed that uses the technique of extraction of characteristics and machine learning known as the “bag of words” approach. This approach detects and characterises regions of interest in confocal laser endomicroscopy (CLE) images. It achieves a level of performance equivalent to that of expert endoscopists (with diagnostic accuracy close to 90%). Andre et al.45 used 135 images (68.9% neoplastic polyps) and obtained a sensitivity of 92.5%, a specificity of 83.3% and a diagnostic accuracy of 89.6%. Tafreshi et al.46 used 118 videos (70.3% neoplastic polyps) to attain sensitivity, specificity and diagnostic accuracy rates of 90.4%, 88.6% and 89.9%, respectively.
White lightLastly, our group (Sánchez et al.47) conducted an initial analysis using surface patterns (textons) of polyps with high-definition white-light images. Following image pre-processing which mitigated specular reflections, texton tubularity was analysed. Altogether, 38 adenomas and 13 non-adenomatous polyps were included. A ROC curve was used to obtain a cut-off point for tubularity of 13.14. This value was used to distinguish between an adenoma and a non-adenoma. Using this cut-off point, an overall diagnostic accuracy rate of 86.3% (44/51) was achieved; for adenomas it was 94.7% (36/38), but for non-adenomas it dropped to 61.5% (8/13). Subsequently, the method was improved; branching and contrast in patterns of surface texture were also analysed, and the number of images was increased (n=225, 63.1% dysplastic). This brought overall diagnostic accuracy up to 91.1%48. However, the overall NPV attained was 87.1% and therefore did not fulfil the ASGE's PIVI criteria.6 Even so, the NPV rose to 96.7% in the sub-group of very small polyps in the rectum and sigmoid colon (n=54), with a diagnostic accuracy of 90.6%.
Combined methods for detection and histological predictionAn ideal system should combine automatic detection of polyps followed by characterisation in real time and in vivo. To this end, Mori et al. reported a preliminary model (with no statistical analysis) based on a deep learning algorithm to detect polyps in white-light images and another algorithm that predicts their histology using endocytoscopy.49 To date, no other models combine the two methodologies for detection and histology prediction; however, the studies involving histological classification in vivo described above could be combined with automatic detection methods as a starting point.25,42–44
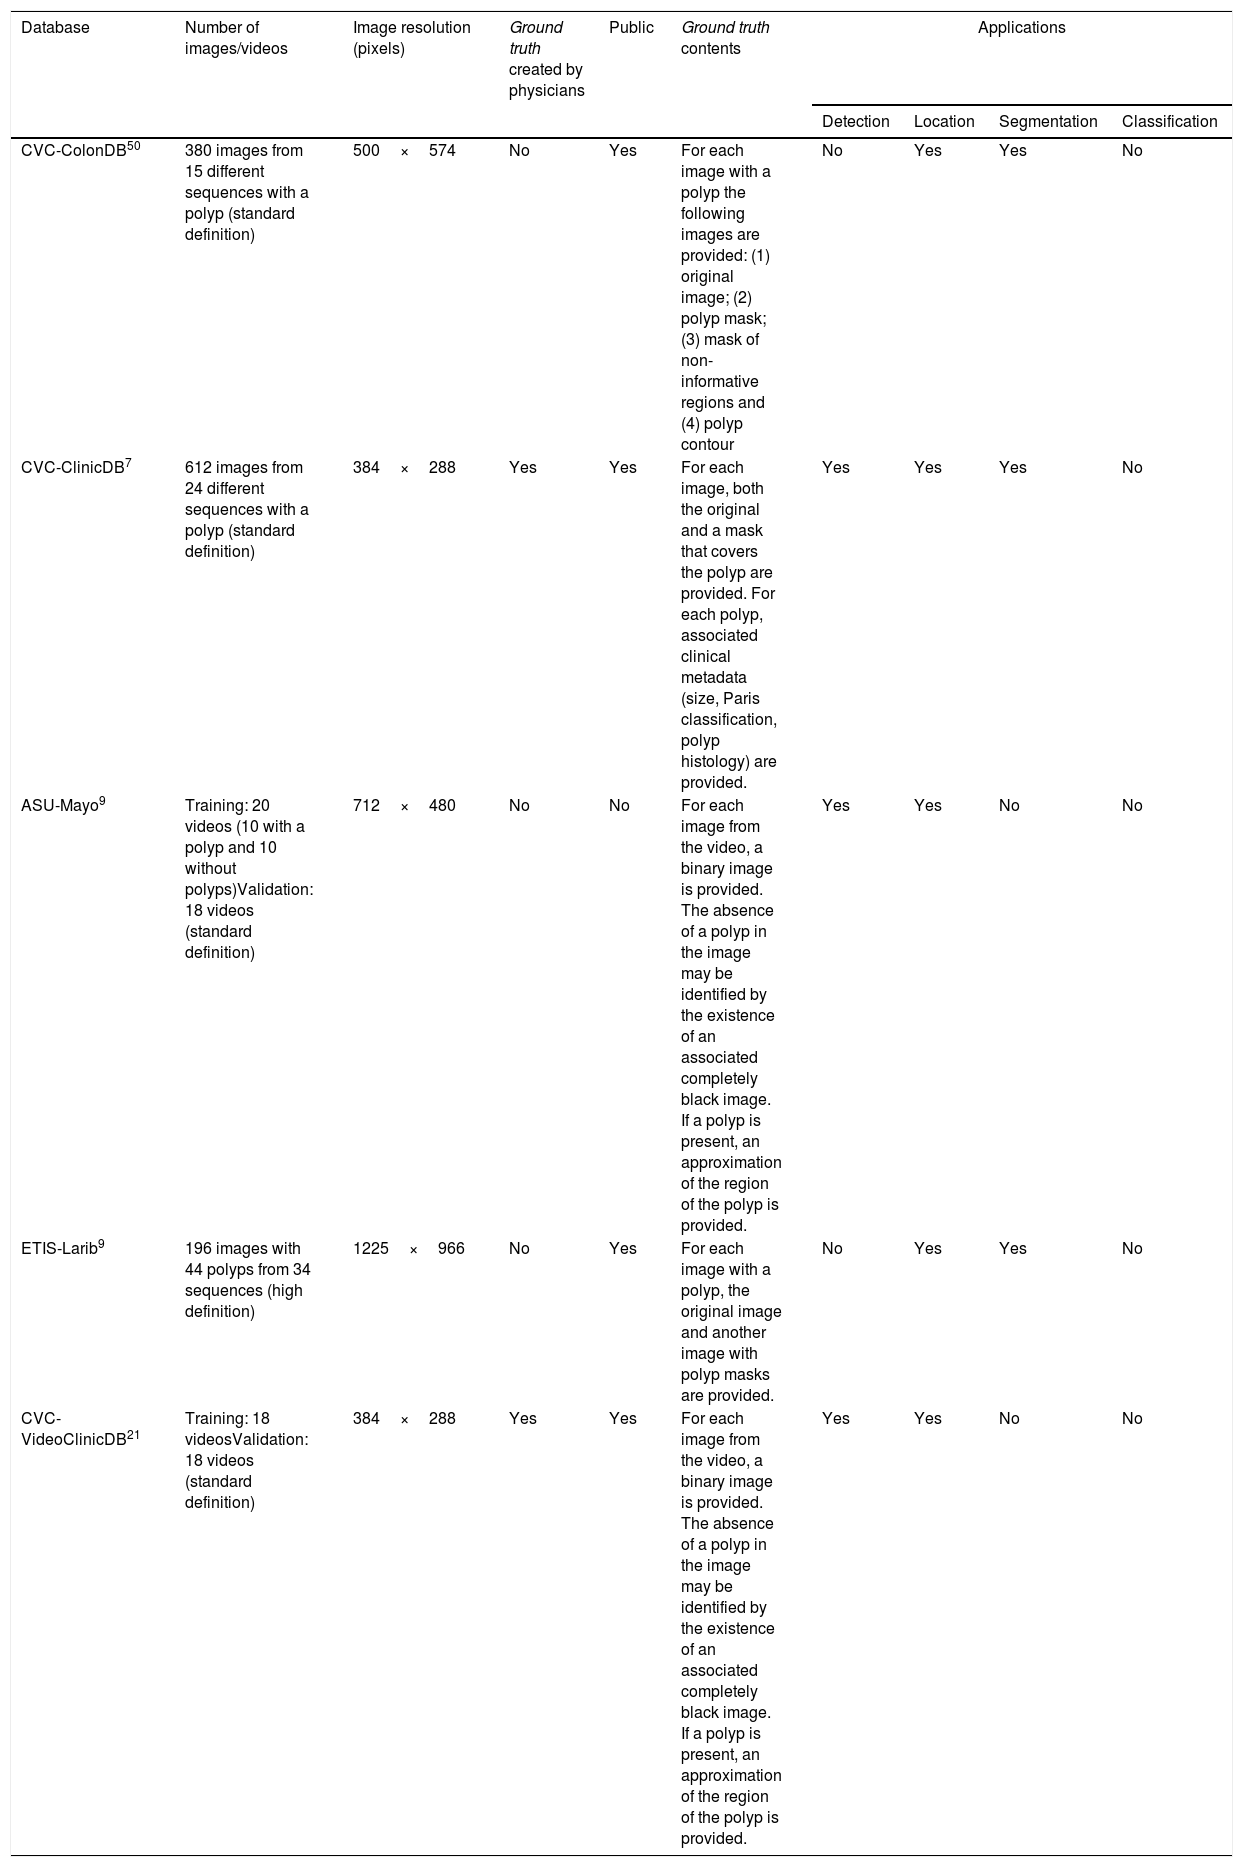
DatabasesAppropriately annotated image databases are needed to validate computational methods as well as to facilitate comparison among them and ensure that they duly represent the problem. Therefore, the cases included in a database should represent the full range of clinical variability that physicians may encounter during procedures. Furthermore, the more different the examples are, the more robust the method will be. If, in addition, a particular method manages to yield better performance in a database, it will be easily extrapolated for potential clinical application.
Once the database has been established, a ground truth should be created to evaluate/validate the performance of the method which will be wholly dependent on the application type. For example, in a polyp detection method, the ground truth will consist of an Excel file that indicates whether or not there is a polyp in each image, and all that will be required is a true/false label for the image. By contrast, a location method involves identifying the area in the image that the polyp occupies and making masks fitted to the polyp in the image, thereby obtaining a binary image that represents the structure8. Finally, polyp classification requires the assigning of a label to an image according to histological category.
Physicians must collaborate to prepare these databases for the following reasons: (a) a ground truth created by clinical personnel is always more reliable than one created by technical personnel, (b) physicians are aware of the clinical nature of the problem and can approach the question of which cases to exclude with better judgement and (c) involving specialist physicians in method validation is key to ensuring the potential clinical use of the tools, as they will already have been subjected to medical standards.
The different existing colonoscopy image databases and their applications are detailed in Table 2.7,9,21,50
Main characteristics and applications of the databases available for analysis of colonoscopy images.
| Database | Number of images/videos | Image resolution (pixels) | Ground truth created by physicians | Public | Ground truth contents | Applications | |||
|---|---|---|---|---|---|---|---|---|---|
| Detection | Location | Segmentation | Classification | ||||||
| CVC-ColonDB50 | 380 images from 15 different sequences with a polyp (standard definition) | 500×574 | No | Yes | For each image with a polyp the following images are provided: (1) original image; (2) polyp mask; (3) mask of non-informative regions and (4) polyp contour | No | Yes | Yes | No |
| CVC-ClinicDB7 | 612 images from 24 different sequences with a polyp (standard definition) | 384×288 | Yes | Yes | For each image, both the original and a mask that covers the polyp are provided. For each polyp, associated clinical metadata (size, Paris classification, polyp histology) are provided. | Yes | Yes | Yes | No |
| ASU-Mayo9 | Training: 20 videos (10 with a polyp and 10 without polyps)Validation: 18 videos (standard definition) | 712×480 | No | No | For each image from the video, a binary image is provided. The absence of a polyp in the image may be identified by the existence of an associated completely black image. If a polyp is present, an approximation of the region of the polyp is provided. | Yes | Yes | No | No |
| ETIS-Larib9 | 196 images with 44 polyps from 34 sequences (high definition) | 1225×966 | No | Yes | For each image with a polyp, the original image and another image with polyp masks are provided. | No | Yes | Yes | No |
| CVC-VideoClinicDB21 | Training: 18 videosValidation: 18 videos (standard definition) | 384×288 | Yes | Yes | For each image from the video, a binary image is provided. The absence of a polyp in the image may be identified by the existence of an associated completely black image. If a polyp is present, an approximation of the region of the polyp is provided. | Yes | Yes | No | No |
Despite the tremendous potential of CAD methods, none of the methods for detection and classification of colorectal polyps reported to date has been broadly implemented in regular clinical practice for the following reasons9: (a) there is a need for them to function speedily in real time; (b) some detection methods are built on a theoretical model of the appearance of the polyp7 which may be limited to certain morphologies; (c) they do not take into account other elements such as folds, sub-epithelial lesions, extrinsic compressions, blood vessels and light7; (d) some methods have only been tested on selected high-quality images (not videos) well suited to their technical requirements (good cleaning, centred polyp, polyp of a certain size and shape, etc.); (e) there are certain specific challenges in colonoscopy imaging, such as the image artefacts generated, due to lighting (specular reflections, over-exposed regions) or to the specific configuration of the video processor attached to the colonoscope, which could superimpose information on the scene to be visualised, and (f) frequent validation is needed in small, limited databases, with a specific device (endoscope brand, resolution and auxiliary method — NBI, AFI, endocytoscopy, white light, etc.), or even a dedication to a single specific polyp type or morphology.
ConclusionColonoscopy plays a fundamental role in the diagnosis and prevention of colorectal cancer, but it is not infallible and it depends on factors such as the quality of the examination and the experience of the endoscopist. CAD (or artificial intelligence) has emerged in recent years as a complement to colonoscopy and is a very appealing alternative for standardising the practice of this examination and its results. However, despite the tremendous potential of CAD methods, available results remain insufficient due to limited application quality, and none of the methods described to date has been widely implemented in clinical practice. Lastly, in order to corroborate the results obtained and conduct comparative studies, image databases with associated clinical data that are compatible with all methods are needed. Therefore, research must continue towards finding a CAD method that is useful in real time, compatible with different endoscope brands and not based on any complex technique, which would be of limited availability and furthermore require a high level of experience.
Conflicts of interestG. Fernández-Esparrach has received fees for organising courses for Norgine Iberia and Olympus Spain in the last two years and has been a consultant for CDx Diagnostics.
This work was supported by the Government of Spain through the funded projects iVENDIS (DPI2015-65286-R) and HISINVIA (PI17/00894), by the Fundación de la Sociedad Española de Endoscopia Digestiva (FSEED) [Foundation of the Spanish Society of Gastrointestinal Endoscopy], by the Secretaria d’Universitats i Recerca de la Generalitat de Catalunya [Catalan Autonomous Government Secretary of Universities and Research] (2014-SGR-1470, 2014-SGR-135, SGR-2017-1669 and SGR-2017-653), and by the Generalitat de Catalunya CERCA Programme.
Please cite this article as: Sánchez-Montes C, Bernal J, García-Rodríguez A, Córdova H, Fernández-Esparrach G. Revisión de métodos computacionales de detección y clasificación de pólipos en imagen de colonoscopia. Gastroenterol Hepatol. 2020;43:222–232.
