
In this study, we aimed to evaluate the computed tomography (CT) findings of Fasciola hepatica infestations on initial and follow-up imagings after treatment, and also to describe the role of CT during diagnosis.
MethodsIn this retrospective study, patients with a diagnosis of fascioliasis by clinical and laboratory examination who underwent initial and follow-up contrast-enhanced abdominal CT scans after treatment (a single oral dose of 10mg/kg Triclabendazole) were included. The CT scans were evaluated regarding liver and spleen sizes, portal and splenic vein diameters, involved hepatic segment numbers and involvement patterns, the presence of focal perihepatic hyperdensity, gallbladder wall thickening, dilatation of the intrahepatic biliary tract, periportal-right subdiaphragmatic lymphadenopathy, hepatic subcapsular and intra-abdominal bleeding, and perihepatic/intraabdominal free fluid. Initial (pre-treatment) and post-treatment CT scans (average 25 months after the treatment) were compared with for these features.
ResultsA total of 36 patients with a mean age of 39.28±14.64 [15-83] years, were included in this study. After treatment, marked improvement in liver parenchymal involvement, biliary system findings, hepatomegaly-splenomegaly, periportal-peridiaphragmatic lymphadenopathy, and hepatic subcapsular hematoma were detected and focal perihepatic hyperdensity, free intraperitoneal fluid disappeared.
ConclusionContrast-enhanced abdominal CT can be used in the diagnosis and post-treatment follow-up of fascioliasis. Awareness of intrahepatic/extrahepatic lesions and all the complications of fascioliasis can greatly aid the diagnosis and also evaluation of the response to treatment.
En este estudio, nuestro objetivo fue evaluar los hallazgos de la tomografía computarizada (TC) de las infestaciones de Fasciola hepatica en imágenes iniciales y de seguimiento después del tratamiento, y también describir el papel de la TC durante el diagnóstico.
MétodosEn este estudio retrospectivo se incluyeron pacientes con un diagnóstico de fascioliasis por examen clínico y de laboratorio que se sometieron a TC abdominal con contraste inicial y de seguimiento después del tratamiento (una dosis oral única de 10mg/kg de triclabendazol). Las TC evaluaron el tamaño del hígado y del bazo, los diámetros de la vena porta y la vena esplénica, el número de segmentos hepáticos involucrados y los patrones de afectación, la presencia de hiperdensidad perihepática focal, el engrosamiento de la pared de la vesícula biliar, la dilatación de la vía biliar intrahepática, la adenopatía subdiafragmática periportal derecha, la hemorragia subcapsular e intraabdominal, y el líquido libre perihepático e intraabdominal. Se compararon las TC iniciales (antes del tratamiento) y posteriores al tratamiento (promedio de 25meses después del tratamiento) con respecto a las características anteriores.
ResultadosEn este estudio se incluyeron un total de 36 pacientes (39,28±14,64 [15-83] años). Después del tratamiento se detectó una marcada mejoría en la afectación del parénquima hepático, hallazgos del sistema biliar, hepatomegalia-esplenomegalia, linfadenopatía periportal-peridiafragmática y hematoma subcapsular hepático, y desaparecieron la hiperdensidad perihepática focal y el líquido intraperitoneal libre.
ConclusiónLa TC abdominal con contraste se puede utilizar en el diagnóstico y el seguimiento postratamiento de la fascioliasis. El conocimiento de las lesiones intrahepáticas/extrahepáticas y todas las complicaciones de la fascioliasis puede ayudar enormemente al diagnóstico y también a la evaluación de la respuesta al tratamiento.
Fascioliasis is a zoonotic trematode infection that is caused by Fasciola hepatica and Fasciola gigantica.1 The infestation is endemic in some regions of Latin America, Eastern Europe, the Middle East, and the East Asia which affects more than 3 million people worldwide.2
Fascioliasis has two phases in humans. The hepatic phase of the disease begins one to three months after swallowed metacercariae, with penetration to the liver parenchyma and migration into the biliary tract.3–5 Signs and symptoms of the hepatic phase include abdominal pain, fever, eosinophilia, and elevated liver function tests.3,4,6–8 Patients usually present with intermittent right upper quadrant pain, which may be associated with cholangitis or cholestasis in the biliary phase.9
To diagnose fascioliasis, direct parasitological techniques, indirect immunological tests, and imaging techniques are the current methods. Detection of the eggs in the stool is rare because of the complexity of the parasite life cycle.10,11 Imaging modalities used for the diagnosis of fascioliasis include ultrasonography, magnetic resonance imaging, and computed tomography (CT). Radiological findings may differ depending on the stage of the disease and on the treatment, but they are usually suggestive of a parasitic infestation.4 For differentiation from focal liver lesions, imaging has an important role in the diagnosis and follow-up of the disease after treatment.12
In this study, we aimed to present the radiological findings of fascioliasis and also examine the response to the treatment with a single oral dose of 10mg/kg Triclabendazole by comparing pre and post-treatment CT scan findings.
Material and methodsPatientsA total of 36 patients with a mean age of 39.28±14.64 (range 15–83 years), diagnosed with fascioliasis by serological examinations who underwent intravenous contrast-enhanced abdominal CT scans at both admission and follow-up after treatment between January 2012 and April 2020 were evaluated in this retrospective, two-centered study. Among them, 30 were female with a mean age of 38.43±15.07 (range 15–83 years), and 6 were male with a mean age of 43±12.30 years (range 18–50 years). Patients were referred to CT examination from gastroenterology, infectious diseases, and emergency departments with complaints of abdominal pain, weight loss, nausea/vomiting, constipation, diarrhea, dyspepsia, and from dermatology department with complaints of itching and rash. The levels of Alanine aminotransferase (ALT), Aspartate transaminase (AST), gamma-glutamyl transferase (GGT), C-reactive protein (CRP), total-direct bilirubin, Alkaline phosphatase (ALP), white blood cell (WBC) count, eosinophil ratio (eosinophil/leukocyte) and the presenting complaints of the patients which were available, recorded from the hospital database. Eosinophilia was defined as an eosinophil ratio was >4%. A control CT was performed to evaluate the course of the disease in patients on the follow-up after the treatment of a single oral dose of 10mg/kg Triclabendazole.
Patients who had malignancy, pregnancy, cholelithiasis, choledocholithiasis, or who had no enhanced abdominal CT scans at both admission and follow-up were excluded from the study.
CT techniqueAll patients underwent contrast-enhanced abdominal CT scans at admission and follow-ups after treatment. Images were acquired using a multislice computed tomography device with 16 detectors (Somatom Emotion 16-slice; CT 2012 E Siemens AG Berlin and Munchen-Germany). A non-ionic contrast agent (Omnipaque Nycomed) was injected at a rate of 3–4ml/s with a dose of 1.4–1.6ml/kg. Image withdrawal was started at 70–80s. The scan parameters were 120kVp, 225 MAS with a slice thickness of 3mm and a slice interval of 3–5mm. The images were interpreted independently by two radiologists with 12 and 15 years of experience in abdominal radiology who were blinded to the laboratory results and previous CT scan findings. All the final decisions were reached with their consensus in cases of conflicts.
CT findingsLiver-spleen dimensions, portal vein-splenic vein diameters were measured on CT scans. The number of the liver segments involved, involvement patterns (microtubular abscess, abscess larger than 3cm, patchy hypodense area), presence of perihepatic density, gallbladder wall thickening, intrahepatic biliary ductal dilatation, presence of periportal/right subdiaphragmatic lymphadenopathy, hepatic subcapsular or intra-abdominal hematoma, and perihepatic-intraabdominal free fluid were evaluated at the first admission. These findings were also re-evaluated on follow-up scans.
Hepatomegaly–splenomegalyHepatomegaly was defined when the craniocaudal length of the liver was >170mm, and splenomegaly when the craniocaudal length of the spleen was >130mm on the coronal reformatted images.
Portal–splenic vein diameterPortal vein diameter was measured at portal hilus, and splenic vein diameter was measured at splenic hilus levels on axial images.
Segmental involvementHepatic segments were identified according to Couinaud classification (I–VIII). The numbers of segments involved in admission and follow-up scans were reported and compared.
Hepatic involvement patternsThe small abscess was defined as a hypodense area (<20 Hounsfield unit (HU)) smaller than 3cm with peripheral contrast enhancement and a tendency to coalesce.
Abscess larger than 3cm was defined as a cystic lesions (<20HU) which have a marked enhancing thickened wall.
Patchy hypodense area was described as non-enhancing hypoattenuating (but not cystic) regions.
Perihepatic densityPerihepatic density was described as focal mesenteric fat heterogeneity near the liver capsule where the larvae penetrated to the liver parenchyma.
Subcapsular hematomaThe subcapsular hematoma was defined as high attenuating (>20HU) fluid collection in subcapsular space, which was not enhancing after contrast administration.
Gallbladder wall thickeningAn edematous gall-bladder wall with a thickness >4mm was accepted as thickened bladder wall.
CholecystitisA distended (transverse size >4cm or sagittal size >10cm) gallbladder with an edematous wall with a thickness >4mm or with neighboring free fluid was accepted as cholecystitis.
Intrahepatic ductal dilatation and wall thickeningIntrahepatic biliary duct walls are not seen when they have normal thickness. Intrahepatic biliary duct dilatation was identified when the duct walls were invisible on CT images.
Periportal – right peridiaphragmatic lymphadenopathyPeriportal lymphadenopathy was defined when lymph nodes were present in periportal region. Right peridiaphragmatic lymphadenopathy was described as the presence of lymph nodes in right subdiaphragmatic region.
Intraabdominal free fluidIntraabdominal free fluid was identified as free fluid in peritoneal cavity especially in perihepatic and pelvic region.
Ethical approvalThis retrospective observational study was approved by the institutional review board of a university ethics committee on 11.12.2020 with the number 2020/10-04.
Statistical analysisDescriptive statistics for studied variables were presented as the mean±standard deviation. Categorical variables were expressed as n and percentage. Continuous variables were compared with a paired sample t-test. A two proportion z-test was used to compare the proportions of continuous variables. Statistical significance was chosen as 5%. A Cohen's kappa coefficient (κ) was calculated to measure the agreement among the two radiologists interpreted the images. A SPSS (VER:21) program was used for statistical analysis.
ResultsAbdominal pain (52.8%, n:19) was the most common complaint of the patients at first admission. The other symptoms were; weight loss (11.1%. n:4), nausea/vomiting (11.1%, n:4), constipation (5.6%, n:2), diarrhea (5.6%, n:2), dyspepsia (13.9%, n:5), itching (11.1%, n:4), and rash (8.3%, n:3). The mean time from initial to follow-up CT scans was 25.31±19.46 (range 2–72) months. The interobserver agreement among radiologists were substantial (κ: 0.749, 88.7% agreement).
The mean dimensions of liver and spleen were statistically significantly higher on the pre-treatment than post-treatment images of the patients (p<.05). A significant decrease of the mean splenic vein diameter was detected on post-treatment when compared with pre-treatment images (p<.05). But the decrease of the mean portal vein diameter was not significant (Table 1).
Pre- and post-treatment radiologic measurements and laboratory examinations results of the patients are compared with paired sample t-test. A p<.05 was accepted as statistically significant.
| Measurements | Before treatment | After treatment | Decrease | Patient number | p | |
|---|---|---|---|---|---|---|
| Mean±SD | Mean±SD | Value | % | N | ||
| Liver dimensions (mm) | 182.11±30.89 | 173.50±24.45 | 8.61 | 4.7 | 36 | .005 |
| Spleen dimensions (mm) | 124.5±25.43 | 112.72±20.59 | 11.78 | 9.5 | 36 | .001 |
| Portal vein diameter (mm) | 13.0±1.33 | 12.52±1.43 | 0.48 | 3.7 | 36 | .55 |
| Splenic vein diameter (mm) | 9.60±1.55 | 8.38±0.96 | 1.22 | 12.7 | 36 | .001 |
| Affected segments number | 3.50±1.96 | 1.22±0.52 | 2.28 | 65.1 | 36 | .001 |
| WBC (/mm3) | 9436.36±3697.82 | 8222.73±2539.02 | 1212.63 | 12.9 | 22 | .178 |
| CRP (mg/L) | 49.0±62.35 | 4.00±1.93 | 45.0 | 91.8 | 15 | .004 |
| Eosinophil rate | 17.66±16.30 | 1.91±1.30 | 15.75 | 89.2 | 32 | .001 |
| ALT (IU/L) | 31.05±17.38 | 14.27±7.13 | 16.78 | 54.0 | 22 | .001 |
| AST (IU/L) | 23.59±9.20 | 15.73±3.22 | 7.86 | 33.3 | 22 | .001 |
| Total bilirubin (mg/dL) | 0.59±0.36 | 0.59±0.34 | 0 | 0.0 | 22 | .924 |
| Direct bilirubin (mg/dL) | 0.22±0.08 | 0.19±0.07 | 0.03 | 13.6 | 22 | .124 |
| ALP (IU/L) | 131.62±130.09 | 71.48±18.15 | 60.14 | 45.7 | 21 | .033 |
| GGT (IU/L) | 55.60±67.21 | 21.14±16.79 | 34.46 | 62.0 | 22 | .001 |
| Ig E (kU/L) | 167.67±251.14 | 80.5±104.27 | 87.17 | 52.0 | 6 | .027 |
The CRP, ALT, AST, ALP, GGT, and IgE levels of the patients at first admission were significantly higher than ones at post-treatment admission (p<.05). But the changes in WBC counts and the levels of total and direct bilirubin were not significant (p>.05) (Table 1). Eosinophilia was detected in 26 patients (81.3%) at first admission. For all 32 patients, the eosinophil ratio was less than 4% after treatment. The difference between pre- and post-treatment eosinophil ratios was statistically significant (Table 1).
The number of patients with hepatomegaly at the first admission was significantly higher than after treatment (p<.05). But the difference of the number of patients with splenomegaly was not significant (Table 2) (Fig. 1).
Imaging findings of hepatobiliary fascioliasis on first and follow-up CT scans. The proportions of the patients with the radiological features at first and after treatment CT scans were compared with a z-test. A p value less than .05 was accepted as statistically significant.
| Findings | Before treatment | After treatment | p | ||
| Patients (N:36) | Patients (N:36) | ||||
| n | % | n | % | ||
| Liver lesions | |||||
| Complete recovery | 18 | 50.0 | |||
| Microtubular abscess | 30 | 83.3 | 6 | 16.7 | .001 |
| Abscess larger than 3cm | 9 | 25.0 | 1 | 2.8 | .003 |
| Patchy hypodense areas | 5 | 13.9 | 7 | 19.4 | .266 |
| Sequele parenchymal calcification | 4 | 11.1 | |||
| 1–4 segment involvement | 28 | 77.8 | 5 | 13.9 | .001 |
| 5–8 segment involvement | 8 | 22.2 | 2 | 5.6 | .021 |
| Perihepatic density | 29 | 80.6 | 0 | 0.0 | .001 |
| Subcapsular hematoma | 1 | 2.8 | 1 (Regressed) | 2.8 | .5 |
| Biliary system changes | |||||
| Edema or dilatation of intrahepatic biliary tract | 10 | 27.8 | 2 | 5.6 | .006 |
| Gallbladder wall thickening | 9 | 25.0 | 0 | 0.0 | .001 |
| Cholecystectomy | 3 | 8.3 | |||
| Hepatomegaly | 18 | 50.0 | 10 | 27.8 | .027 |
| Splenomegaly | 8 | 22.2 | 7 | 19.4 | .385 |
| Periportal lymphadenopathy | 25 | 69.4 | 13 | 36.1 | .002 |
| Complete recovery | 12 | 48.0 | |||
| Regression | 12 | 48.0 | |||
| Same size | 1 | 4.0 | |||
| Right peridiaphragmatic lymphadenopathy | 5 | 13.9 | 3 | 8.3 | .225 |
| Complete recovery | 2 | 40.0 | |||
| Regression | 3 | 60.0 | |||
| Intraabdominal free fluid | 8 | 22.2 | 0 | 0.0 | .001 |
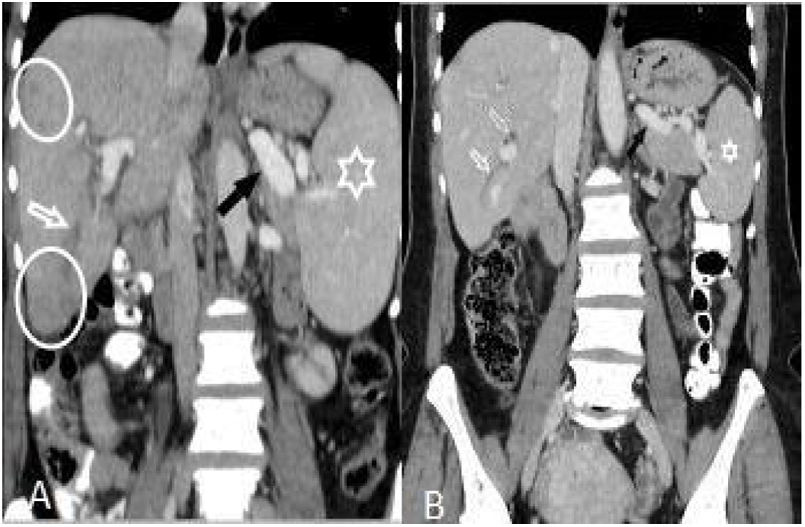
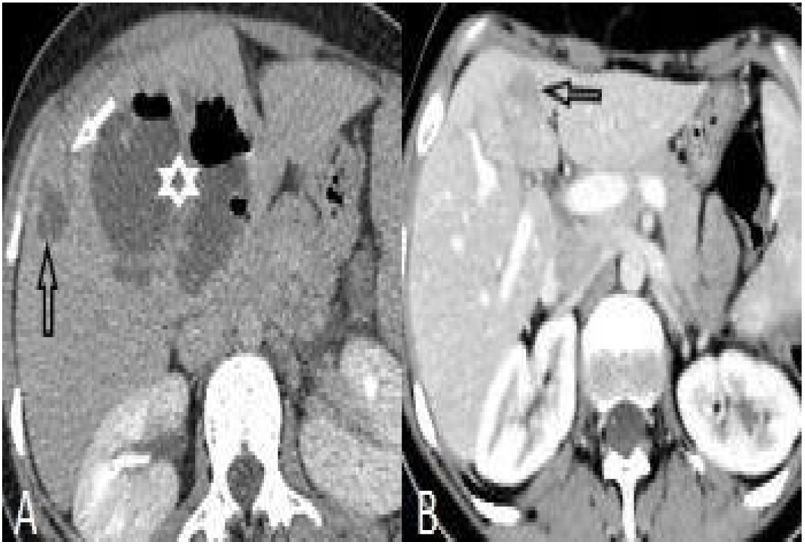
: Hepatomegaly, splenomegaly (asterisk), enlarged portal and splenic veins (black arrow), subcapsular hypodense area (circles), and intrahepatic biliary dilatation/thickening in segment VI (white arrow) in a 46-year-old woman (A). Changes of the findings on post-treatment scan are seen in (B).")
(A and B): Hepatomegaly, splenomegaly (asterisk), enlarged portal and splenic veins (black arrow), subcapsular hypodense area (circles), and intrahepatic biliary dilatation/thickening in segment VI (white arrow) in a 46-year-old woman (A). Changes of the findings on post-treatment scan are seen in (B).
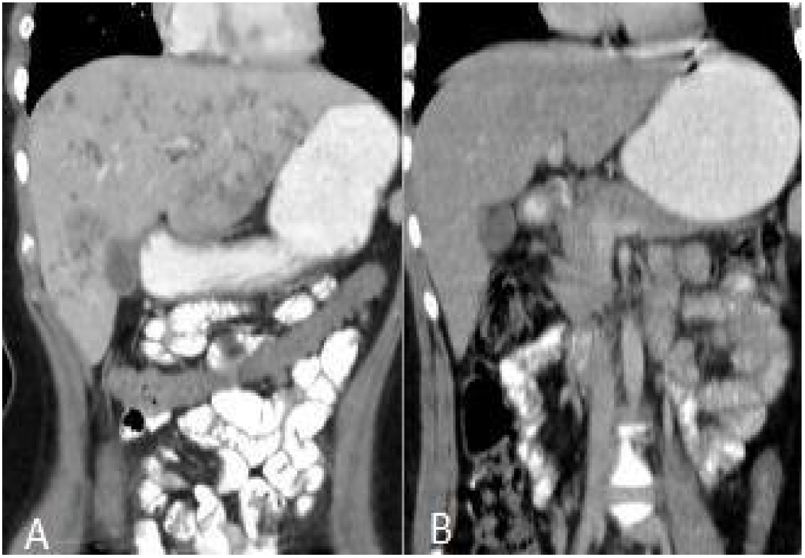
After treatment, the complete recovery of liver lesions was detected in 18 patients. Patchy hypodense areas were seen in 7 patients, microtubular abscess in 6 (Fig. 2), sequele calcification in 4, and abscess larger than 3cm in remained one patient (Fig. 3). The incidence of microtubular abscess and abscess >3cm was significantly lower in post-treatment images (p<.05). But, a non-significant increase in patchy hypodense area incidence was found on post-treatment images (Table 2).
: Diffuse microtubular abscesses with 8 segment involvement in the initial scan (A) and complete resolution after treatment (B).")
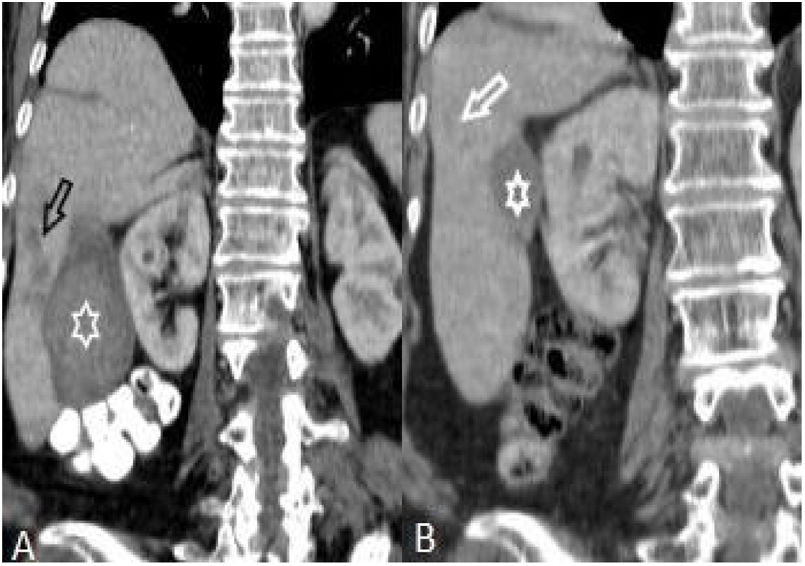
: Liver abscess larger than 3cm (asterisk) and subcapsular microtubule abscess (black arrow) in a 20-year-old woman (A). After treatment, regression in the abscess and in the other lesions is seen (B).")
Perihepatic hiperdensity was observed in 29 patients before treatment while all these lesions disappeared after treatment. At first admission, subcapsular hematoma was seen in one patient, after the treatment it regressed (Fig. 4).
: Hypoattenuating areas extending from capsule into the parenchyma (black arrow) and subcapsular hematoma (asterisk) (A). After treatment, regression of hypodense areas (white arrows) and marked regression of subcapsular hematoma (B).")
Before treatment, gallbladder thickening was observed in 9 patients. At the follow-up, this finding was seen in none of the patients. All of the patients with cholecystitis (n:3) underwent a cholecystectomy with no complication in their follow-ups.
Edema or thickening of the wall of intrahepatic tree was observed significantly higher in initial admission than after treatment (p<.05).
Among 25 patients with periportal lymphadenopathy at first diagnosis, lymph nodes disappeared in 12, while the sizes of them regressed in 12 others and did not change in the remained one patient with treatment. Of the 5 patients with right subdiaphragmatic lymph nodes, lesions disappeared in 2 and a regression in sizes was noted in 3 after treatment. There was a significant decrease in the insidence of periportal lymphadenopathy while the difference in right subdiapragmatic lymphadenopathy was not significant (Table 2).
In all 8 patients with intraperitoneal free fluid before treatment, free fluid disappeared with treatment. Features of the patients are summarized in Table 2.
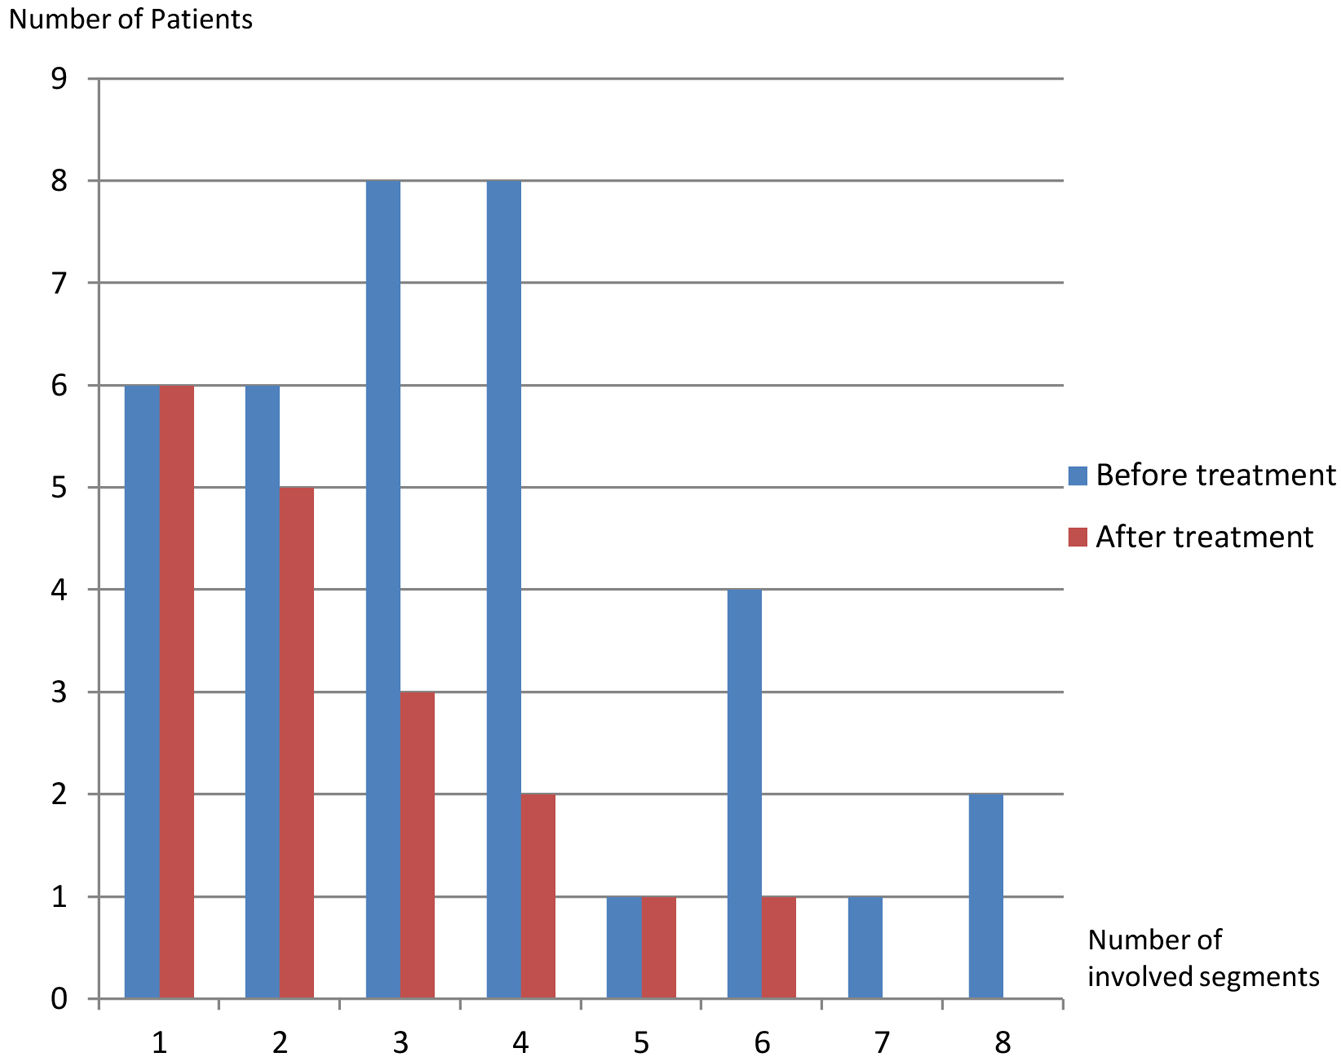
On the first scans, frequency of four or fewer segments involvement (n:28, 77.8%) was markedly higher than of five or more (n:8, 22.2%) (p: .001) (Table 1, Fig. 5). Most commonly three (n:8, 22.2%) and four (n:8, 22.8%) segments involvement were observed while five (n:1, 2.8%) and seven (n:1, 2.8%) segments involvement were rarest. After treatment, hepatic involvement was not seen in 18 of 36 patients. Among those 18 patients, 11 (61.1%) had one (n:6) or two (n:5) involved segments. The average involved segment number of the 36 patients was 3.50±1.96 before treatment, which was significantly higher than after treatment (1.22±0.52) (p: .001). Segmental involvement features are detailed in Fig. 5.
Discussion
Fasciola hepatica is known to be infected through consuming contaminated plants (watercress, water lettuce, mint, or parsley) in endemic areas. However, the frequency has increased gradually in recent years due to the increase in travel and transportation of plants from endemic regions to non-endemic regions for trade. Although there are only limited data about the incidence of fascioliasis in Middle East, it was showed that the disease is not uncommon.9 In a study conducted in Turkey Kaya et al., found that among 30 patients with fascioliasis, 24 (80%) were female.9 They concluded that the disease is more common in females because they have more contact with contaminated water plants than males. Our results regarding this subject are consistent with the study above as in our study 83.3% (n:30) of the patients were female.
CT is the best imaging modality to detect the intrahepatic and extrahepatic findings and the complications of the lesions in the early and late stages of the disease with high sensitivity.4 In literature, hepatomegaly and splenomegaly are documented findings in patients with fascioliasis.13 In our study, we observed hepatomegaly in 18 (50%) and splenomegaly in 8 (22.2%) patients before treatment. We found a significant decrease in the number of patients with hepatomegaly (n:10, 27.7%) (p: .027) and also a mild decrease in the number of patients with splenomegaly (n:7, 19.7%) (p: .385) after treatment. Also, the average craniocaudal length of the liver and spleen of the patients diminished markedly after the treatment. As there was no study in literature on the portal and splenic vein diameter changes in the patients with fascioliasis after treatment, we measured the diameters before and after treatment. We observed a mild decrease in the diameter of portal vein and a significant decrease in splenic vein after the treatment.
A study that included 87 patients with fascioliasis reported that a solitary lesion was detected in 9 patients (10%) and multiple lesions in 69 patients (79%) among 78 patients with liver involvement.12 In our study, 4 or fewer segments involvement was observed in 28 (77.8%) patients, and 5 or more in 8 (22.2%) before treatment. The most common involved segments in the patients were segment VI (16 patients) and V (10 patients). The solitary lesion was most commonly detected in segment VI (3 patients). This finding can be attributed to the most common penetration site of the larvae.
During the migration of parasites, multiple millimeter confluent abscesses are formed.14 Abscesses are best seen in portal venous phase CT scans because they do not show internal contrast enhancement and can be easily identified in normal contrasting liver parenchyma.5,15 In a study that included 22 patients, six months after the treatment, they found complete clinical and laboratory improvement in all patients, complete recovery in 16 (73%) patients, and residual hypodense lesions in 6 (27%) patients on CT examinations.9 In a different study, during a long-term follow-up, sequele calcification in liver parenchyma was seen in 6 (9%) of the patients.12 In our study, 30 (83.3%) patients had microtubular abscess, 9 (25%) abscess larger than 3cm and 5 (13.8%) patchy hypodense areas. In 10 (29.7%) patients, there was edema or thickening in the intrahepatic biliary tract, and in 29 (80.6%), perihepatic minimal density was observed in the pretreatment CT scans. Clinical and laboratory improvement was observed in all patients. We detected complete improvement in liver parenchyma lesions in 18 (50%) patients after treatment and sequele calcification in 4 (11.1%) patients.
Periportal lymph node enlargement or lymphadenopathy was previously shown in surgical samples 16and on radiological imagings4,5,9,12,13 of the patients with fascioliasis. In our study, we detected periportal lymphadenopathy in 25 (69.4%) patients before the treatment. After treatment, the periportal lymph nodes totally disappeared in 12 (48%), the sizes of the lymph nodes regressed in 12 (48%), and the lymph node persisted with no change in size for one (4%) patient. In a study including 5 patients with fascioliasis, peridiaphragmatic lymphadenopathy was detected in 1 patient (20%).4 In this study, we detected right peridiaphragmatic lymphadenopathy in 5 (13.8%) patients while lymph nodes disappeared in 2 (40%) and regressed in 3 (60%) after treatment.
A minimal amount of perihepatic or subcapsular fluid was reported in 4 patients (5%) among 87 patients with fascioliasis in literature.12 In another study, perihepatic fluid accumulation was detected in 9% of the patients with fascioliasis.9 We detected perihepatic or free intra-abdominal fluid in 22.2% of our patients in the initial CT scan, and after the treatment all these fluids disappeared. Although subcapsular bleeding is not a common finding in fascioliasis, it is suggested that F. hepatica parasites may rarely cause a focal hematoma when crossing the liver capsule in different studies in the literature.10,17,18 We detected subcapsular hematoma in segment VI in only one patient, which markedly regressed during the follow-up at 24 months after the treatment. Also in two patients, we observed perihepatic or intraperitoneal high-density (30HU) free fluid compatible with hemorrhages, totally disappeared after the treatment.
Acute cholecystitis associated with fascioliasis was previously described in the literature.18 In our study, thickening of the gallbladder walls and/or minimal pericholecystic fluid were observed in 9 (25%) of the patients. Six (67%) of those patients had complete recovery after conservative treatments. However, 3 (33%) of those patients underwent cholecytectomia because of a diagnosis of acute cholecystitis.
Finally, all the CT features of the patients with fascioliasis studied in this study showed a significant improvement by the treatment, except for mean portal vein diameter, the incidence of splenomegaly, and patchy hypodense areas within liver parenchyma and right subdiaphragmatic lymph node. We think that these non-significant changes in portal vein diameter and the incidence of splenomegaly are because that there was no fasciola-related liver cirrhosis or fibrosis19 and also no portal vein thrombosis20 which could lead to portal hypertension in this study. When compared with significant periportal lymphadenopathy changes with treatment, relatively mild change on right subdiaphragmatic lymph nodes is may be due to contrast to periportal region, subdiaphragmatic space may be affected by not only hepatic lesions but by also various intraabdominal structures such as appendix, ovary, etc. The only radiological feature that exhibited a non-significant progression after treatment was patchy hypodense areas. This finding is probably because although most of the primary patchy hypodense areas disappeared with treatment, some abscesses transformed and regressed into them. For this reason it must be kept in mind that patchy hypodense areas may be still seen for a long time in liver parenchyma after treatment despite abscesses which tend to disappear rapidly with treatment.
The major limitations of this study are retrospective design and the lack of some biochemical parameter results of some patients. We did not measure choledochus diameter in the patients. Also the follow-up CT scan time from the diagnosis was very variable (2–72 months).
ConclusionVarious intrahepatic and extrahepatic findings in the patients with fascioliasis can be detected on CT scans. CT is also a sensitive modality to show the changes in lesions after treatment. Awareness of the findings of fascioliasis can help with an initial diagnosis and can also help to evaluate the response to treatment.
FundingAuthor declares no funding.
Conflict of interestsThere is no conflict of interest in this study.