


In a previous study we demonstrated that a simple training programme improved quality indicators of Oesophagogastroduodenoscopy (OGD) achieving the recommended benchmarks. However, the long-term effect of this intervention is unknown. The aim of this study was to assess the quality of OGDs performed 3 years after of having completed a training programme.
Material and methodsA comparative study of 2 cohorts was designed as follows: Group A included OGDs performed in 2016 promptly after a training programme and Group B with OGDs performed from January to March 2019, this group was also divided into 2 subgroups: subgroup B1 of Endoscopists who had participated in the previous training programme and subgroup B2 of Endoscopists who had not. The intra-procedure quality indicators proposed by ASGE-ACG were used.
ResultsA total of 1236 OGDs were analysed, 600 from Group A and 636 from Group B (439 subgroup B1 and 197 subgroup B2). The number of complete examinations was lower in Group B (566 [94.3%] vs. 551 [86.6%]; P < .001). A significant decrease was observed in nearly all quality indicators and they did not reach the recommended benchmarks: retroflexion in the stomach (96% vs. 81%; P < .001); Seattle biopsy protocol (86% vs. 50%; P = .03), description of the upper GI bleeding lesion (100% vs. 62%; P < .01), sufficient intestinal biopsy specimens (at least 4) in suspected coeliac disease (92.5% vs. 18%; P < .001), photo documentation of the lesion (94% vs. 90%; P < .05). Regarding the overall assessment of the procedure (including correct performance and adequate photo documentation), a significant decrease was also observed (90.5% vs. 62%; P < .001). There were no differences between subgroups B1 and B2.
ConclusionsThe improvement observed in 2016 after a training programme did not prevail after 3 years. In order to keep the quality of OGDs above the recommended benchmarks, it is necessary to implement continuous training programmes.
En un estudio previo demostramos que un pequeño programa de formación mejoraba los indicadores de calidad de la esofagogastroduodenoscopia (EGD) que llegaban a los estándares recomendados. Sin embargo, desconocemos el efecto de esta formación a largo plazo. El objetivo de este estudio fue valorar la calidad de las EGD después de 3 años de haber realizado un programa de mejora.
Material y métodosEstudio comparativo de dos cohortes: EGD posteriores a un programa de formación realizado en 2016 (Grupo A) y EGD en Enero-Marzo de 2019 (Grupo B). El Grupo B se dividió en 2 subgrupos: endoscopistas que habían participado en el programa de formación previo (B1) y los que no (B2). Se utilizaron los indicadores de calidad intra-procedimiento recomendados por la ASGE-ACG.
ResultadosSe analizaron un total de 1236 EGD, 600 en el Grupo A y 636 en el B (439 subgrupo B1 y 197 subgrupo B2). El número de exploraciones completas fue inferior en el Grupo B (566 [94,3%] vs. 551 [86,6%]; P < ,001). Se observó una disminución significativa en prácticamente todos los indicadores de calidad que, además, no alcanzaron los estándares recomendados: retroversión gástrica (96% vs. 81%; P < ,001); protocolo de biopsias de Seattle (86% vs. 50%; P = ,03), descripción de la lesión en la hemorragia (100% vs. 62%; P < ,01), toma de >4 biopsias en sospecha de celiaquía (92,5% vs. 18%; P < ,001), fotodocumentación de lesión (94% vs. 90%; P < ,05). Cuando consideramos el global de la prueba (incluyendo la actuación correcta y la fotodocumentación adecuada), también se observó una disminución significativa (90,5% vs. 62%; P < ,001). No hubo diferencias entre los subgrupos B1 y B2.
ConclusionesLa mejora observada en 2016 tras un programa de formación no perdura a los 3 años. Es necesario hacer programas de formación continuados para mantener la calidad de la EGD por encima de los estándares recomendados.
Oesophagogastroduodenoscopy (OGD) is a relevant procedure in the diagnosis, treatment, follow-up and prevention of gastrointestinal disorders, since it allows a correct visualisation of the lumen and mucosal surface of the oesophagus, stomach and proximal duodenum, in addition to allowing photographs, videos and biopsies to be taken. Similarly, numerous therapeutic procedures can be performed: treatments for upper gastrointestinal bleeding, band ligation, sclerotherapy, polypectomies and ablation of precancerous lesions, among others.1
Among endoscopists, there is a great variety in the OGD technique and in the use of standardised terminology and protocols, prompting a lack of uniformity in the diagnosis, interpretation and treatment of pathologies.
The most important goal of medical practice is to be able to provide patients with the best quality of care. Therefore, it is crucial to establish parameters that allow us to measure quality and compare it with reference parameters.2
According to the American Society for Gastrointestinal Endoscopy (ASGE) and the American College of Gastroenterology (ACG), healthcare quality can be measured by comparing the performance of an individual or a group of individuals with an ideal or benchmark.3 The particular parameter that is used for comparison is called a quality indicator. Quality indicators must be objective, measurable and be associated with an improvement in patient management. They can be reported as a relationship between the incidence of correct performance and the opportunity for it or as the proportion of interventions that achieve a predefined goal.3
It should be noted that there are many studies on colonoscopy quality4 but not on OGD quality.5 The ASGE-ACG published a first proposal for quality indicators in OGD in 2006, which was updated in 2015. Moreover, the European Society of Gastrointestinal Endoscopy (ESGE) and the United European Gastroenterology (UEG) presented their guide to OGD quality indicators in 2016.6 Using the quality indicators proposed by the ASGE-ACG, our group carried out a study to evaluate the quality of OGDs performed in the Endoscopy Unit of the Hospital Clínic de Barcelona before and after a training programme that helped to improve the quality indicators which, as a result, reached the recommended standards for the most part.7 However, the long-term impact of this training programme is unknown.
The objective of this study was to assess compliance with the intraprocedure quality indicators of the OGDs performed in our centre three years after a training programme and to compare it with those achieved in 2016 immediately after the completion of the programme.
Materials and methodsDesignComparative study of 2 cohorts: one prospective (group A) and the other retrospective (group B), immediately after (in 2016) and 3 years after (in 2019) a training programme, respectively. The study was approved by the Ethics and Research Committee of the Hospital Clínic de Barcelona.
Study subjectsAll the OGDs performed in these two periods in the Endoscopy Unit of the Hospital Clínic de Barcelona (a highly specialised tertiary hospital).
MethodThe OGDs performed between 1 January and 31 March 2019 were retrospectively reviewed through a careful review of the reports prepared with the ENDOBASE® software and with information from the hospital's general IT system (SAP). Information regarding 60 intraprocedure variables of each OGD was collected through data collection sheets and subsequently dumped into a data template. The OGDs for this period were in turn divided into 2 subgroups according to whether they were performed by endoscopists who had participated in the previous training programme or not (subgroup B1 and subgroup B2, respectively). Meanwhile, the information referring to the OGD corresponding to 2016 was extracted from the database of the previous study.
The quality indicators were measured by calculating the proportion of the interventions that achieved a predefined objective and were expressed as percentages.
Definitions- -
Complete and documented exploration: it mentions arrival to the second duodenal portion and performance of retroflexion in the gastric fundus, which are also photographically documented.
- -
Correct action in the performance of procedures: the biopsy protocol or the corresponding treatment has been carried out according to the pathology.
- -
Correct photo documentation of lesions: photographs of abnormalities and/or lesions have been taken and also been correctly documented.
- -
Correct global assessment: complete examination, correct action and photo documentation of the lesion if applicable.
Qualitative variables are expressed in absolute values and their percentages, and quantitative variables as mean ± standard deviation. For comparisons, the chi-square test was used for qualitative variables and Student's t-test for quantitative variables. The database was recoded for the IBMs SPSS v.22 statistical software, with which the data analysis was performed.
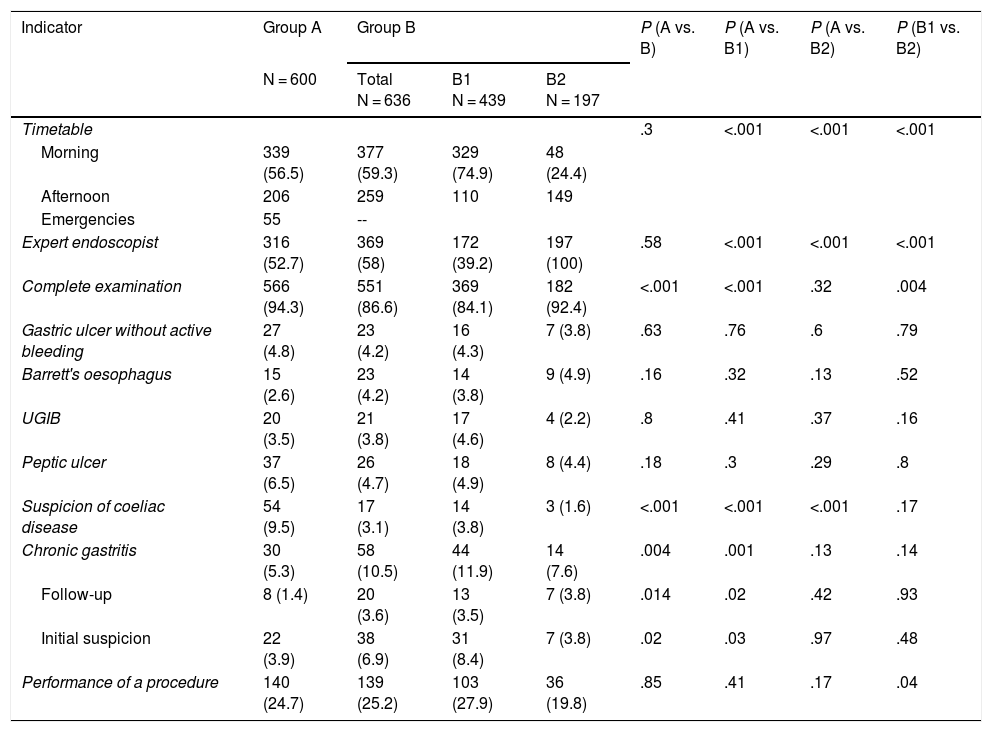
ResultsA total of 1236 OGDs were included, 600 in group A and 636 in group B (439 in subgroup B1 and 197 in B2). The number of participating endoscopists was 31 in group A and 33 in group B (22 in subgroup B1 and 11 in B2). In both groups, a greater number of procedures were performed in the morning (group A, 339 [56.5%] vs. group B, 377 [59.3%]; P = .3) and there were no differences regarding the number of OGDs performed by expert endoscopists (group A, 316 [52.7%] vs. group B, 369 [58%]; P = .58) (Table 1). In group B, OGDs performed urgently were not differentiated. Regarding the number of complete examinations, in the 2019 period the number was lower (group A, 566 [94.3%] vs. group B, 551 [86.6%]; P < .001) (Table 1). When the causes of incomplete examinations were analysed, more therapeutic OGDs were performed in the second period (group A, 25 [4.2%] vs. group B, 62 [9.75%]; P < .001) and the patients presented food residues (group A, 5 [0.83%] vs. group B, 20 [3.14%]; P < .001).
Characteristics of the groups.
| Indicator | Group A | Group B | P (A vs. B) | P (A vs. B1) | P (A vs. B2) | P (B1 vs. B2) | ||
|---|---|---|---|---|---|---|---|---|
| N = 600 | Total N = 636 | B1 N = 439 | B2 N = 197 | |||||
| Timetable | .3 | <.001 | <.001 | <.001 | ||||
| Morning | 339 (56.5) | 377 (59.3) | 329 (74.9) | 48 (24.4) | ||||
| Afternoon | 206 | 259 | 110 | 149 | ||||
| Emergencies | 55 | -- | ||||||
| Expert endoscopist | 316 (52.7) | 369 (58) | 172 (39.2) | 197 (100) | .58 | <.001 | <.001 | <.001 |
| Complete examination | 566 (94.3) | 551 (86.6) | 369 (84.1) | 182 (92.4) | <.001 | <.001 | .32 | .004 |
| Gastric ulcer without active bleeding | 27 (4.8) | 23 (4.2) | 16 (4.3) | 7 (3.8) | .63 | .76 | .6 | .79 |
| Barrett's oesophagus | 15 (2.6) | 23 (4.2) | 14 (3.8) | 9 (4.9) | .16 | .32 | .13 | .52 |
| UGIB | 20 (3.5) | 21 (3.8) | 17 (4.6) | 4 (2.2) | .8 | .41 | .37 | .16 |
| Peptic ulcer | 37 (6.5) | 26 (4.7) | 18 (4.9) | 8 (4.4) | .18 | .3 | .29 | .8 |
| Suspicion of coeliac disease | 54 (9.5) | 17 (3.1) | 14 (3.8) | 3 (1.6) | <.001 | <.001 | <.001 | .17 |
| Chronic gastritis | 30 (5.3) | 58 (10.5) | 44 (11.9) | 14 (7.6) | .004 | .001 | .13 | .14 |
| Follow-up | 8 (1.4) | 20 (3.6) | 13 (3.5) | 7 (3.8) | .014 | .02 | .42 | .93 |
| Initial suspicion | 22 (3.9) | 38 (6.9) | 31 (8.4) | 7 (3.8) | .02 | .03 | .97 | .48 |
| Performance of a procedure | 140 (24.7) | 139 (25.2) | 103 (27.9) | 36 (19.8) | .85 | .41 | .17 | .04 |
Data expressed as n (%).
Within the complete examinations, there was a decrease in cases with suspected coeliac disease (group A, 54 [9.5%] vs. group B, 17 [3.1%]; P < .01) and an increase in patients with chronic gastritis (including follow-up and initial suspicion) (group A, 30 [5.3%] vs. group B, 58 [10.5%]; P < .01). There were no significant differences between groups in other situations that require specific management or in terms of the number of examinations that required the performance of some procedure (group A, 140 [24.7%] vs. group B, 139 [25.2% ]; P = .85) (Table 1).
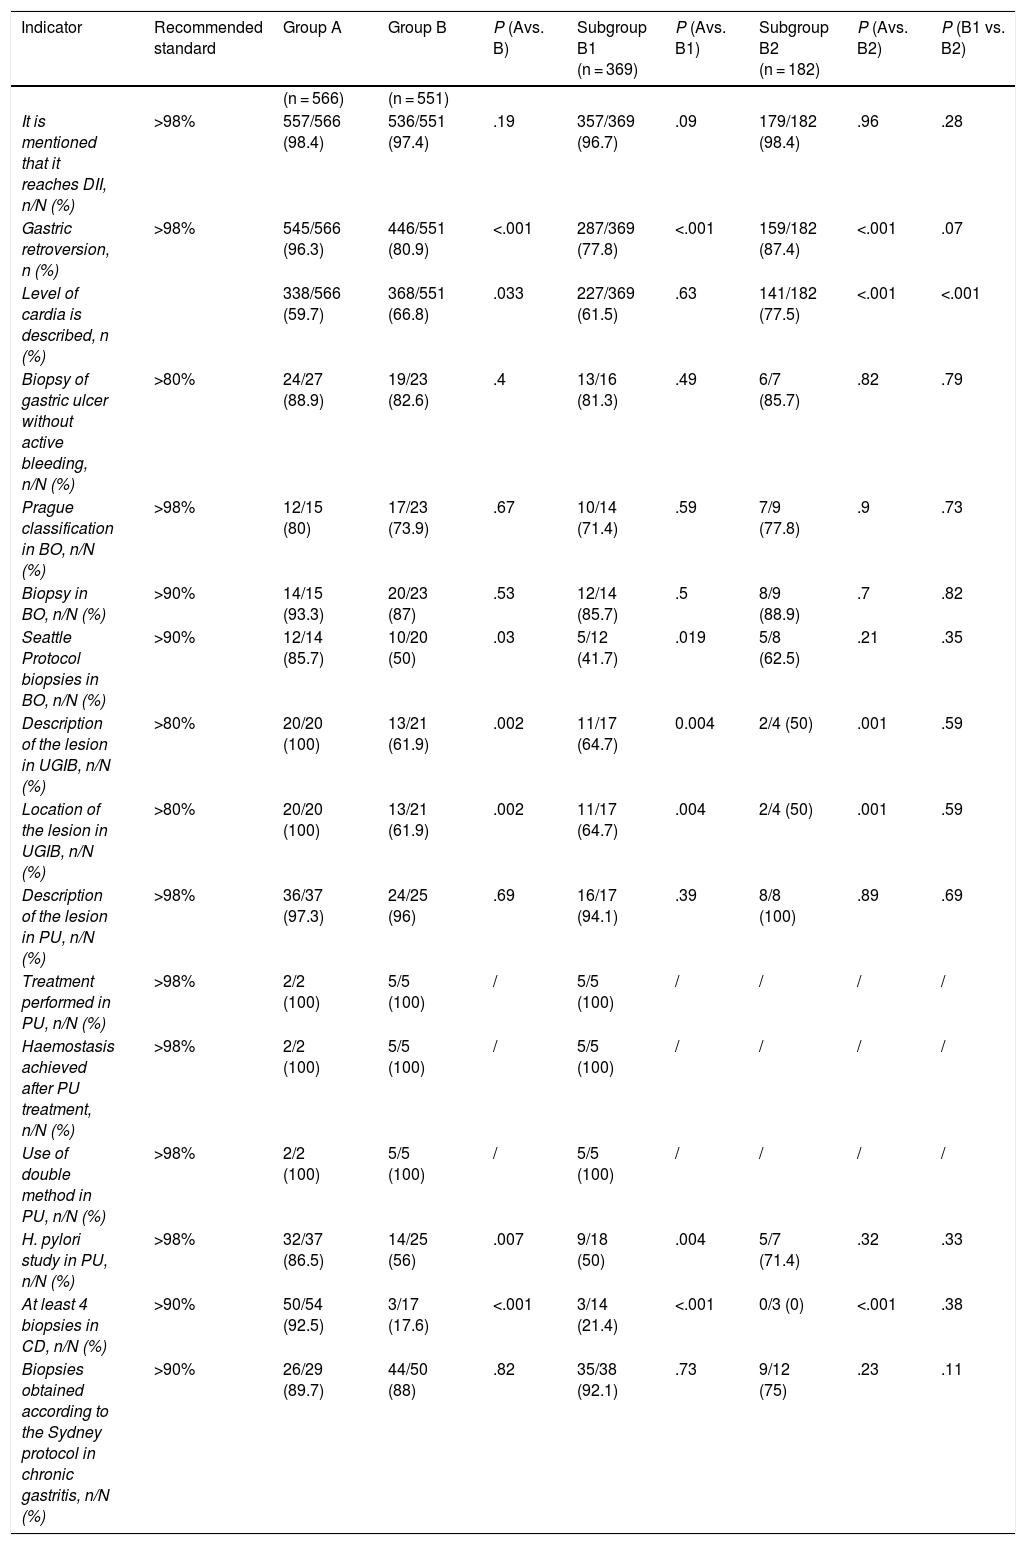
The intraprocedure quality indicators were measured in the complete examinations and in several of them a decrease was observed at 3 years after the training that did not reach the standards recommended by ASGE-ACG, such as mentioning that the DII is reached, fundus by retroversion and the description and location of the lesion in UGIB. This worsening was observed in both subgroups except in the case of mentioning that DII was reached, which only fell below the standard in subgroup B1. The only indicator in which there was an improvement was in the description of the level of the cardia (group A, 338 [59.7%] vs. group B, 368 [66.8%]; P = .003), this improvement being from the subgroup of new endoscopists.
In the specific case of Barrett's oesophagus, there was no improvement in the use of the Prague classification and the indicator continued to be below the recommended 98%. Regarding compliance with the Seattle protocol, not only did we continue to be below the standard, but there was also a significant decrease that was greater in the subgroup of endoscopists who had participated in the previous training (Table 2).
Intraprocedure quality indicators in OGD.
| Indicator | Recommended standard | Group A | Group B | P (Avs. B) | Subgroup B1 (n = 369) | P (Avs. B1) | Subgroup B2 (n = 182) | P (Avs. B2) | P (B1 vs. B2) |
|---|---|---|---|---|---|---|---|---|---|
| (n = 566) | (n = 551) | ||||||||
| It is mentioned that it reaches DII, n/N (%) | >98% | 557/566 (98.4) | 536/551 (97.4) | .19 | 357/369 (96.7) | .09 | 179/182 (98.4) | .96 | .28 |
| Gastric retroversion, n (%) | >98% | 545/566 (96.3) | 446/551 (80.9) | <.001 | 287/369 (77.8) | <.001 | 159/182 (87.4) | <.001 | .07 |
| Level of cardia is described, n (%) | 338/566 (59.7) | 368/551 (66.8) | .033 | 227/369 (61.5) | .63 | 141/182 (77.5) | <.001 | <.001 | |
| Biopsy of gastric ulcer without active bleeding, n/N (%) | >80% | 24/27 (88.9) | 19/23 (82.6) | .4 | 13/16 (81.3) | .49 | 6/7 (85.7) | .82 | .79 |
| Prague classification in BO, n/N (%) | >98% | 12/15 (80) | 17/23 (73.9) | .67 | 10/14 (71.4) | .59 | 7/9 (77.8) | .9 | .73 |
| Biopsy in BO, n/N (%) | >90% | 14/15 (93.3) | 20/23 (87) | .53 | 12/14 (85.7) | .5 | 8/9 (88.9) | .7 | .82 |
| Seattle Protocol biopsies in BO, n/N (%) | >90% | 12/14 (85.7) | 10/20 (50) | .03 | 5/12 (41.7) | .019 | 5/8 (62.5) | .21 | .35 |
| Description of the lesion in UGIB, n/N (%) | >80% | 20/20 (100) | 13/21 (61.9) | .002 | 11/17 (64.7) | 0.004 | 2/4 (50) | .001 | .59 |
| Location of the lesion in UGIB, n/N (%) | >80% | 20/20 (100) | 13/21 (61.9) | .002 | 11/17 (64.7) | .004 | 2/4 (50) | .001 | .59 |
| Description of the lesion in PU, n/N (%) | >98% | 36/37 (97.3) | 24/25 (96) | .69 | 16/17 (94.1) | .39 | 8/8 (100) | .89 | .69 |
| Treatment performed in PU, n/N (%) | >98% | 2/2 (100) | 5/5 (100) | / | 5/5 (100) | / | / | / | / |
| Haemostasis achieved after PU treatment, n/N (%) | >98% | 2/2 (100) | 5/5 (100) | / | 5/5 (100) | / | / | / | / |
| Use of double method in PU, n/N (%) | >98% | 2/2 (100) | 5/5 (100) | / | 5/5 (100) | / | / | / | / |
| H. pylori study in PU, n/N (%) | >98% | 32/37 (86.5) | 14/25 (56) | .007 | 9/18 (50) | .004 | 5/7 (71.4) | .32 | .33 |
| At least 4 biopsies in CD, n/N (%) | >90% | 50/54 (92.5) | 3/17 (17.6) | <.001 | 3/14 (21.4) | <.001 | 0/3 (0) | <.001 | .38 |
| Biopsies obtained according to the Sydney protocol in chronic gastritis, n/N (%) | >90% | 26/29 (89.7) | 44/50 (88) | .82 | 35/38 (92.1) | .73 | 9/12 (75) | .23 | .11 |
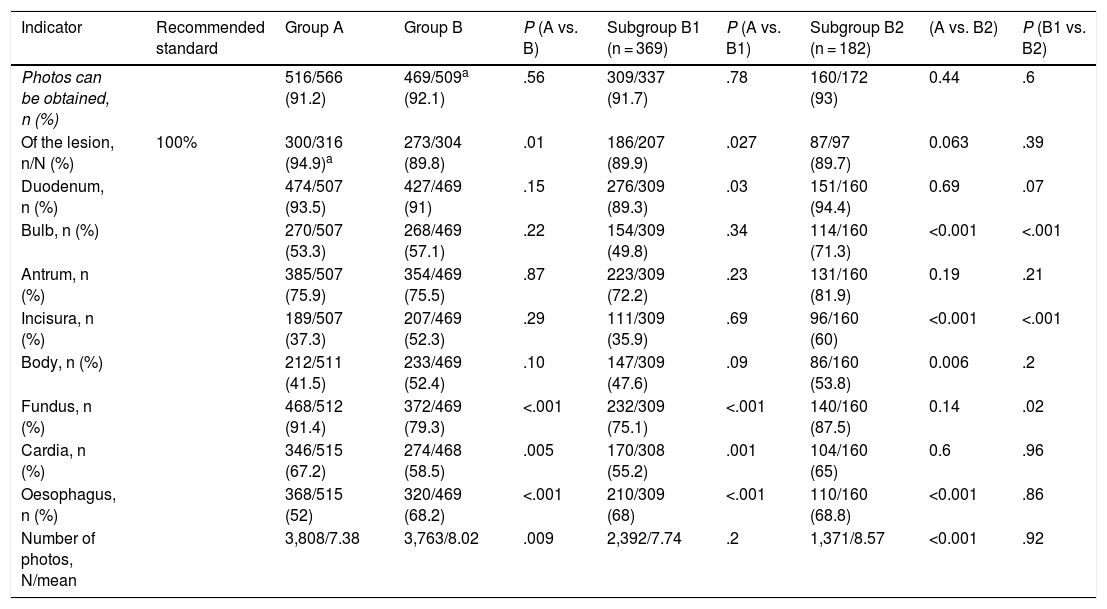
The photo documentation (Table 3) could not be assessed in some cases of group B. Although no differences were observed regarding the number of tests with photographs (group A, 516/566 [91.2%] vs. group B, 469/509 [92.1%]; P = .56), the mean number of photographs was higher in group B (group A, 7.38 ± 3.75 vs. group B, 8.02 ± 3.94; P < .05). However, the photo documentation of the lesion/s shows a significant drop in group B (300/316 [94.4%] vs. 273/304 [89.8%]; P = .01), the recommended standard by ASGE-ACG being 100%. Regarding anatomical points, the cardia and fundus were photographed more in group A and the oesophagus in group B.
Photo documentation.
| Indicator | Recommended standard | Group A | Group B | P (A vs. B) | Subgroup B1 (n = 369) | P (A vs. B1) | Subgroup B2 (n = 182) | (A vs. B2) | P (B1 vs. B2) |
|---|---|---|---|---|---|---|---|---|---|
| Photos can be obtained, n (%) | 516/566 (91.2) | 469/509a (92.1) | .56 | 309/337 (91.7) | .78 | 160/172 (93) | 0.44 | .6 | |
| Of the lesion, n/N (%) | 100% | 300/316 (94.9)a | 273/304 (89.8) | .01 | 186/207 (89.9) | .027 | 87/97 (89.7) | 0.063 | .39 |
| Duodenum, n (%) | 474/507 (93.5) | 427/469 (91) | .15 | 276/309 (89.3) | .03 | 151/160 (94.4) | 0.69 | .07 | |
| Bulb, n (%) | 270/507 (53.3) | 268/469 (57.1) | .22 | 154/309 (49.8) | .34 | 114/160 (71.3) | <0.001 | <.001 | |
| Antrum, n (%) | 385/507 (75.9) | 354/469 (75.5) | .87 | 223/309 (72.2) | .23 | 131/160 (81.9) | 0.19 | .21 | |
| Incisura, n (%) | 189/507 (37.3) | 207/469 (52.3) | .29 | 111/309 (35.9) | .69 | 96/160 (60) | <0.001 | <.001 | |
| Body, n (%) | 212/511 (41.5) | 233/469 (52.4) | .10 | 147/309 (47.6) | .09 | 86/160 (53.8) | 0.006 | .2 | |
| Fundus, n (%) | 468/512 (91.4) | 372/469 (79.3) | <.001 | 232/309 (75.1) | <.001 | 140/160 (87.5) | 0.14 | .02 | |
| Cardia, n (%) | 346/515 (67.2) | 274/468 (58.5) | .005 | 170/308 (55.2) | .001 | 104/160 (65) | 0.6 | .96 | |
| Oesophagus, n (%) | 368/515 (52) | 320/469 (68.2) | <.001 | 210/309 (68) | <.001 | 110/160 (68.8) | <0.001 | .86 | |
| Number of photos, N/mean | 3,808/7.38 | 3,763/8.02 | .009 | 2,392/7.74 | .2 | 1,371/8.57 | <0.001 | .92 |
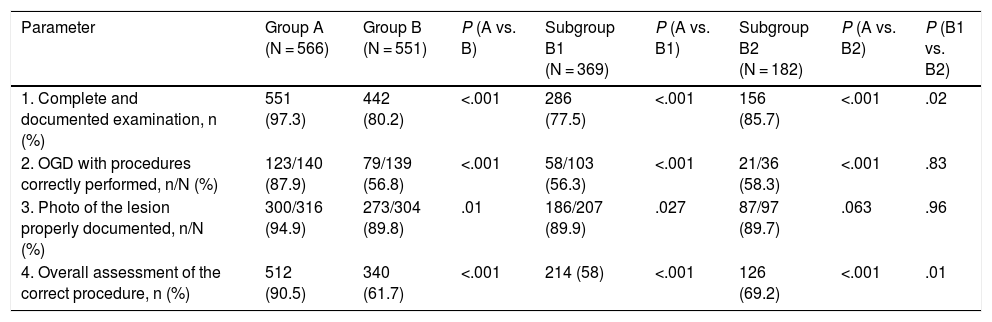
Regarding the general assessment 3 years after the improvement programme, there was a worsening in the complete and documented examination parameters, correct action in the performance of procedures and correct photo documentation of the lesion, hence the percentage of procedures globally assessed as correct was significantly lower in group B (group A, 512 [90.5%] vs. group B, 340 [61.7%]; P < .001) (Table 4, Fig. 1). This worsening was observed in the 2 subgroups, the overall results being worse in the subgroup of endoscopists who had participated in the previous study.
General assessment of the quality of OGDs in the different groups.
| Parameter | Group A (N = 566) | Group B (N = 551) | P (A vs. B) | Subgroup B1 (N = 369) | P (A vs. B1) | Subgroup B2 (N = 182) | P (A vs. B2) | P (B1 vs. B2) |
|---|---|---|---|---|---|---|---|---|
| 1. Complete and documented examination, n (%) | 551 (97.3) | 442 (80.2) | <.001 | 286 (77.5) | <.001 | 156 (85.7) | <.001 | .02 |
| 2. OGD with procedures correctly performed, n/N (%) | 123/140 (87.9) | 79/139 (56.8) | <.001 | 58/103 (56.3) | <.001 | 21/36 (58.3) | <.001 | .83 |
| 3. Photo of the lesion properly documented, n/N (%) | 300/316 (94.9) | 273/304 (89.8) | .01 | 186/207 (89.9) | .027 | 87/97 (89.7) | .063 | .96 |
| 4. Overall assessment of the correct procedure, n (%) | 512 (90.5) | 340 (61.7) | <.001 | 214 (58) | <.001 | 126 (69.2) | <.001 | .01 |

OGD is a very common test in all endoscopy units but there is very little information about how to perform a quality OGD. Furthermore, and if we compare it with screening colonoscopy, there is the added difficulty that the indications for the OGD are very varied, as are the type of lesions detected, whereby it entails a wide variety of possible actions. All of this is compounded by the variability among endoscopists themselves, which is not only determined by experience but also by motivation and knowledge of the specific management of certain pathologies. To our knowledge, this is the first study to evaluate the quality of OGDs in the long term after a training programme, and it demonstrates a significant reduction in overall quality that practically reaches pre-training values.
In a first study, we demonstrated that, with a simple training programme that consisted of introducing improvements to the Endobase programme and holding an information session for the members of the unit, OGD quality indicators could be improved.7 However, this improvement could be due in part to a factor already known, namely that the endoscopists knew that the impact of the training received was being evaluated. Thus, the current figures would reflect a stability of the indicators (in many cases below the recommended standards) rather than a worsening of them.
When dealing with OGD quality, the first point is to establish the definition of a complete OGD. Unlike the colonoscopy, there are very little data and it appears that reaching the duodenum is too easy to be associated with a better detection of lesions. In a recent ESGE guide, the experts agreed that a complete examination should include the inspection of the oesophagus, stomach and duodenum.6 In our study, a reduction in the mention of arrival at the duodenum was observed 3 years after training, which did not reach the standards recommended by ASGE-ACG. Due to the increase in the incidence of gastric cancer at the level of the cardia,8 fundus by retroversion is also mandatory to consider that the entire stomach has been explored, although we also observed a decrease in compliance.
Barrett's oesophagus is a condition with a risk of progression to neoplasm that can be prevented with adequate monitoring. In recent years, an effort has been made to standardise the terminology used to describe it and the Prague classification has been proposed.9 Although the number of cases with Barrett's oesophagus was small in our study, the use of the Prague classification continued to be below the recommended 98%. Regarding compliance with the Seattle protocol,10 not only were we still below the standard, but there was also a significant decrease compared to the improvement observed immediately after the training. These results support the recommendation to centralise the follow-up of these patients in specialised units with specially trained and dedicated endoscopists. This same recommendation would be applicable to the follow-up of patients with preneoplastic gastric lesions, such as chronic atrophic gastritis and intestinal metaplasia.11
For the description and documented location of the lesion in UGIB, the recommended standard is >80%. In our case, the 100% that was achieved after the training programme has not been maintained over time. However, one possible explanation would be that OGDs performed urgently by the on-call team were not included in the recent cohort and this could have led to poorer quality documentation.
In all patients with peptic ulcer disease, a Helicobacter pylori study should be performed, either through biopsies for histological study, breath test or rapid urease tests (CLO).12–14 That is why the recommended standard of the quality indicator is very demanding and >98%. In our setting, the indication of eradication without verification of infection in specific cases, such as the existence of a duodenal ulcer, continues to be common practice, which could explain the low percentages reflected in our study in the two periods.
Regarding photo documentation, there are no data to suggest that taking photos of all anatomical sites and lesions improves the diagnostic capacity of the OGD.15 However, and since adequate IT support is currently available to take and store photographs, photo documentation should be considered a quality parameter.6 In this sense, the ASGE-ACG is very demanding and proposes a recommended standard of 100%, which in our case was significantly below that, reaching only 89.8%. Regarding the number of photos, the ESGE recommends a minimum of 10 photos that include the following anatomical landmarks: duodenum, major papilla, antrum, incisura, body, fundus retroflexion, diaphragm indentation, upper edge of gastric folds, squamo-columnar junction, proximal oesophagus and distal oesophagus.6,16 It should be emphasised that in our case an increase in the average number of photographs was observed.
One striking fact regarding the number of complete OGDs is that, when the endoscopists who participated in the last period were divided into 2 groups according to whether or not they had participated in the previous training programme, a significant difference was observed in favour of those that had not. These, in general, were younger endoscopists that had joined the Endoscopy Unit more recently and who, for the most part, worked in the afternoon. It cannot be ruled out that some of these endoscopists had received training in endoscopy and report writing prior to their incorporation.
The main limitation of our study is the retrospective design of the new cohort, so only the intra-procedure indicators proposed by the ASGE-ACG were analysed and the time of the examinations could not be assessed. Time taken has been shown to increase the diagnostic performance of the test, so that when 7 min or more are taken, twice as many premalignant and malignant gastric lesions are detected17 and, in the case of Barrett's oesophagus, more dysplasia is detected with an inspection time of one minute per centimetre.18 However, retrospective collection prevented endoscopists from being positively influenced by the fact that they were participating in a study. Another limitation is the small number of separate cases of each type of special situation, which makes it impossible to draw robust conclusions from the results. Moreover, being a tertiary centre endoscopy unit, the explorations of some specific pathologies are carried out by specialised endoscopists, which could mean that the results obtained cannot be extrapolated to other centres.
Based on the results presented, we believe that it is necessary to implement other mechanisms to identify vulnerabilities and create opportunities for improvement with the ultimate aim of guaranteeing a good quality of service to patients. Such mechanisms could be periodic audits that would allow the improvement to be monitored following the identification of weak points.10 This effect, added to training programmes and simulations in different techniques, could result in a significant increase in the quality of OGD.19
ConclusionsThe improvement observed in the intraprocedure quality indicators of OGD after a simple training programme is not maintained over time and they therefore do not surpass the quality standards established by the ASGE-AGA. It is therefore necessary to implement continuous training programmes.
Conflicts of interestNone.
Please cite this article as: Alcaraz Serrat JA, Córdova H, Moreira L, Pocurull A, Ureña R, Delgado-Guillena PG, et al. Evaluación del cumplimiento a largo plazo de los indicadores de calidad en la esofagogastroduodenoscopia. Gastroenterol Hepatol. 2020. https://doi.org/10.1016/j.gastrohep.2020.01.017
