


To analyse the relationship between health-related quality of life (HRQoL) and sociodemographic and clinical factors in patients with diabetes mellitus, also comparing with Spanish population-based reference values.
MethodCross-sectional descriptive-analytical observational study through nonprobability sampling on diabetic patients from San Roque Primary Health Centre (Badajoz, Spain), using a questionnaire regarding sociodemographic and diabetes care data, SF-36 and Duke-UNC questionnaires, and clinical history data.
ResultsSixty patients (55% women) fundamentally with type 2 diabetes and a mean age of 68.67 ± 11.09 years were studied. Women older than 75 presented poorer HRQoL than their reference group. Women showed worse HRQoL than men. Age, evolution of diabetes, presence of acute and chronic complications, and comorbidities, pharmacological treatment, and glycaemic control affect HRQoL in these patients. Living alone, having a low socioeconomic status, and needing help with diabetes-related self-care can negatively affect quality of life.
ConclusionsHRQoL assessment allows us to detect alterations in the different domains and perform an early intervention. This way, we can incorporate these aspects into the nursing evaluation and interventions in the nursing care plan; allowing us to develop individualized care strategies and diabetes education programmes that contribute to improving HRQoL in patients with diabetes.
Analizar la relación entre la calidad de vida relacionada con la salud (CVRS) y variables sociodemográficas y clínicas de pacientes diagnosticados de diabetes mellitus, comparando además con los valores de referencia para la población española.
MétodoEstudio descriptivo-analítico observacional trasversal por muestreo no probabilístico intencional en pacientes con diabetes mellitus del Centro de Salud San Roque (Badajoz, España), usando cuestionarios de datos sociodemográficos y de cuidado de la diabetes, los cuestionarios SF-36 y Duke-UNC, y datos de la historia clínica.
ResultadosSe estudiaron 60 pacientes (55% mujeres) fundamentalmente con diabetes tipo 2 (90%) y una edad media de 68,67 ± 11,09 años. Las mujeres mayores de 75 años presentaron valores de CVRS significativamente inferiores a los de su grupo poblacional de referencia. Las mujeres mostraron una peor CVRS que los hombres. La edad, los años de evolución de la diabetes, la presencia de complicaciones agudas y crónicas, así como de comorbilidades, el régimen farmacológico, y el control glucémico afectan a la CVRS. Vivir solo, tener un nivel socioeconómico bajo, un apoyo social percibido bajo y necesitar ayuda para el cuidado de la diabetes están relacionados con una deficiente CVRS.
ConclusionesLa evaluación de la CVRS permite detectar alteraciones en sus diferentes dominios e intervenir precozmente, pudiendo incorporar estos aspectos a la valoración e intervención enfermera en el plan de cuidados; lo que permite establecer estrategias individualizadas de atención y programas de educación diabetológica que contribuyan a la mejora de la calidad de vida en pacientes con diabetes.
Interventions aimed at improving health-related quality of life are tremendously useful in the management of the burden of disease, with the nursing professional as a key player.
What does does this paper contribute?Factors such as age, years of disease evolution, the presence of complications, comorbidities, drug regimen, and glycaemic control impact the quality of life in patients with diabetes, which must be contemplated within the framework of integral patient management.
Diabetes mellitus (DM) has undergone an alarming increase in prevalence, morbidity, and mortality and associated healthcare costs in recent decades, making it one of the diseases having the greatest social and healthcare repercussions around the world. The presence of acute and chronic complications, comorbidity, the need to readapt one’s lifestyle, and the difficulties in complying with treatment and self-care of the disease are some of the factors that can influence the diabetic patient’s functionality and well-being.1
In 2019, it has been estimated that 463 million people (9.3% prevalence rate) have diabetes and this number is expected to reach 700 million by 2045. In Spain, its prevalence is estimated to be 10.5%. DM and the complications associated with diabetes accounted for 11.3% of all-cause mortality worldwide in 2019.2 The latest data available in Spain point to DM as the cause of 2.30% of all-cause mortality and the 11th cause of death in 2017,3 as well as being responsible for 8.2% of the national healthcare expenditure in 2012.4
Health-related quality of life (HRQoL) can be defined as the subjective perception of the influence of health status, health care, and health promotion on the individual’s ability to achieve and maintain an overall level of functioning that enables them to carry out those activities that affect their general state of well-being.5 Disease-associated symptoms, complications, physical, and psychosocial burden, functionality, and associated diseases affect HRQoL. Changes in HRQoL, together with changes in morbidity and mortality, have been shown to constitute the main indicators of benefits in the health status of patients with DM.6 For this reason, assessing HRQoL, as well as implementing HRQoL interventions, are highly beneficial in managing the burden of the disease, with the nursing professional a fundamental agent to carry out this action.
Faced with a chronic disease such as DM, the treatment of which is based on eliminating or attenuating symptoms, preventing complications, and improving well-being, traditional measures of morbidity and mortality and life expectancy no longer suffice, making it necessary to resort to HRQoL as a tool to evaluate the impact of the disease,7 to identify the factors affecting it, and finally minimizing this impact by acting on HRQoL through care, educational, and management interventions.
The aim of the present study was to analyse the relationship between HRQoL and sociodemographic and clinical variables in a sample of patients diagnosed with DM type 1 and 2, and to compare the scores obtained against the reference values for the Spanish population.
MethodStudy design and populationThis is a cross-sectional, descriptive, observational study that included 60 patients over 18 years of age and diagnosed with type 1 or type 2 DM, with 5 or more years of disease evolution, willing to participate in the study, from the San Roque Health Centre (population: 1500; 1120 with type 2 DM and 280 with type 1 DM), that belongs to the Badajoz catchment area (Badajoz, Spain). Patients with severe psychiatric disease, dementia or cognitive disability, severe visual or hearing impairment, or functional illiteracy (26 patients) were excluded. Participants were recruited by non-probabilistic purposive or convenience sampling, by attending the nursing consultations of all the professionals of the Health Centre. A sample of 60 participants allows us to detect a minimum effect size of d = .425 (intermediate level) according to a Student’s t test for one sample, with a significance level of 5% and a power of 90% (calculation according to jamovi 1.2). Data collection, interviews, medical history review, and supervision of the self-report questionnaires was carried out by a single investigator.
InstrumentsA sociodemographic and diabetes care questionnaire was elaborated to obtain data regarding marital status, socioeconomic and educational level, employment status, persons living with the patient, need for help with self-care, years of evolution, frequency of acute DM complications, frequency of nursing check-ups, diabetes education received, and smoking. In addition, patients’ medical records were reviewed to collect data on age, sex, type of DM, pharmacological treatment, chronic complications of DM, concomitant chronic diseases, the presence of hypertension, dyslipidaemia, and depression, as well as the most recent blood pressure, body mass index, glycosylated haemoglobin (HbA1c), and total cholesterol values.
The Duke-UNC questionnaire, which reflects perceived social support, was used. The scores range from 11 to 55 points: the lower the score, the less perceived support.8 In the Spanish validation, a score of 32 or higher indicates normal perceived social support, whereas a score of less than 32 denotes low perceived social support.9 The SF-36 Health Survey was also used, which provides a health status profile that is convenient for assessing HRQoL in the general population and in specific subgroups. It consists of 8 domains (physical function [PF], physical role [RP], bodily pain [BP], general health [GH], social function [SF], emotional role [RE], mental health [MH] and vitality [VT]), plus an additional transition item on change in general health status from the previous year. The analysis of the responses is based on the calculation for each domain, with a scale ranging from 0 (worst health status) to 100 (best health status).10 It has been validated in Spanish11 and is reliable and sensitive for the measurement of HRQoL in diabetic patients.12
Data analysisStatistical analysis was performed with the IBM® SPSS® Statistics version 22 software. The values obtained are expressed as percentages or as mean ± standard deviation. The normal distribution of the variables was tested with the Kolmogorov–Smirnov test. Student’s t test (comparison between 2 groups), ANOVA (more than 2 groups), and Pearson’s correlation coefficient (correlation analysis) were used. The significance level was set at 0.05.
Ethical considerationsThe study was approved by the Clinical Research Ethics Committee of the Badajoz Catchment Area. Current legislation on clinical research and data protection was complied with. All patients signed the informed consent form.
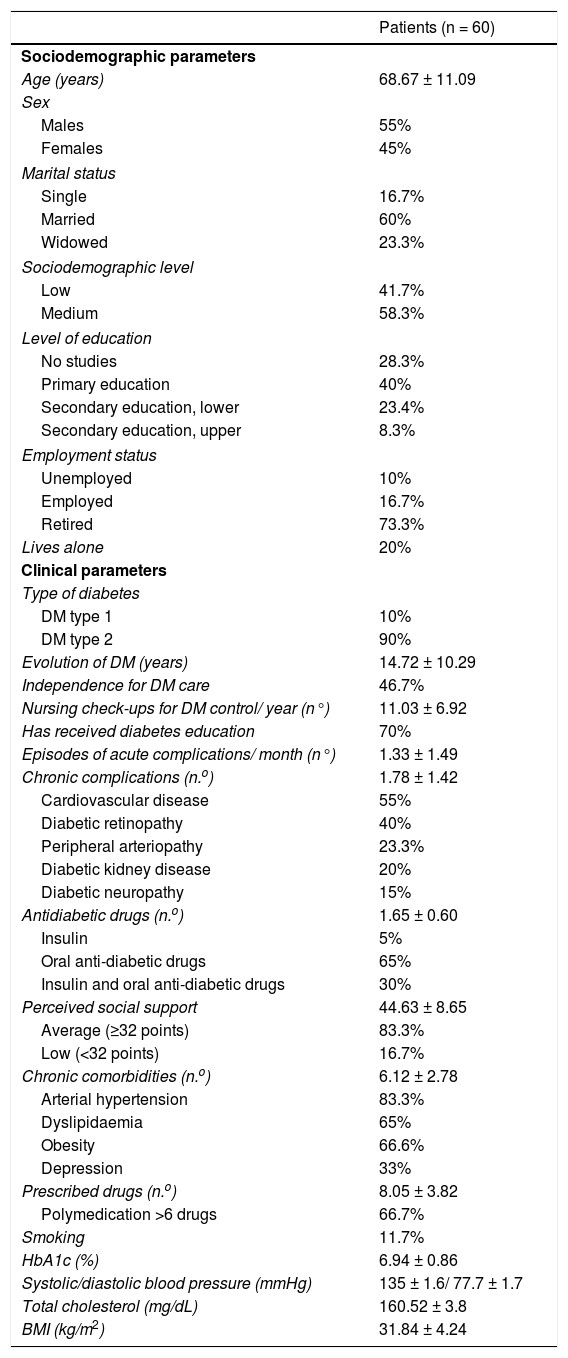
ResultsSixty patients (55% female) with a mean age of 68.67 ± 11.09 years were included, with the most prevalent type of diabetes being type 2 (90%). The descriptive study of the participants’ most relevant sociodemographic and clinical variables is displayed in Table 1.
Socio-demographic and clinical parameters of patients with diabetes mellitus.
| Patients (n = 60) | |
|---|---|
| Sociodemographic parameters | |
| Age (years) | 68.67 ± 11.09 |
| Sex | |
| Males | 55% |
| Females | 45% |
| Marital status | |
| Single | 16.7% |
| Married | 60% |
| Widowed | 23.3% |
| Sociodemographic level | |
| Low | 41.7% |
| Medium | 58.3% |
| Level of education | |
| No studies | 28.3% |
| Primary education | 40% |
| Secondary education, lower | 23.4% |
| Secondary education, upper | 8.3% |
| Employment status | |
| Unemployed | 10% |
| Employed | 16.7% |
| Retired | 73.3% |
| Lives alone | 20% |
| Clinical parameters | |
| Type of diabetes | |
| DM type 1 | 10% |
| DM type 2 | 90% |
| Evolution of DM (years) | 14.72 ± 10.29 |
| Independence for DM care | 46.7% |
| Nursing check-ups for DM control/ year (n°) | 11.03 ± 6.92 |
| Has received diabetes education | 70% |
| Episodes of acute complications/ month (n°) | 1.33 ± 1.49 |
| Chronic complications (n.o) | 1.78 ± 1.42 |
| Cardiovascular disease | 55% |
| Diabetic retinopathy | 40% |
| Peripheral arteriopathy | 23.3% |
| Diabetic kidney disease | 20% |
| Diabetic neuropathy | 15% |
| Antidiabetic drugs (n.o) | 1.65 ± 0.60 |
| Insulin | 5% |
| Oral anti-diabetic drugs | 65% |
| Insulin and oral anti-diabetic drugs | 30% |
| Perceived social support | 44.63 ± 8.65 |
| Average (≥32 points) | 83.3% |
| Low (<32 points) | 16.7% |
| Chronic comorbidities (n.o) | 6.12 ± 2.78 |
| Arterial hypertension | 83.3% |
| Dyslipidaemia | 65% |
| Obesity | 66.6% |
| Depression | 33% |
| Prescribed drugs (n.o) | 8.05 ± 3.82 |
| Polymedication >6 drugs | 66.7% |
| Smoking | 11.7% |
| HbA1c (%) | 6.94 ± 0.86 |
| Systolic/diastolic blood pressure (mmHg) | 135 ± 1.6/ 77.7 ± 1.7 |
| Total cholesterol (mg/dL) | 160.52 ± 3.8 |
| BMI (kg/m2) | 31.84 ± 4.24 |
BMI: body mass index; DM: diabetes mellitus; HbA1c: glycosylated haemoglobin; SD: standard deviation.
Data are expressed as a percentage of the total (%) or as the mean ± SD.
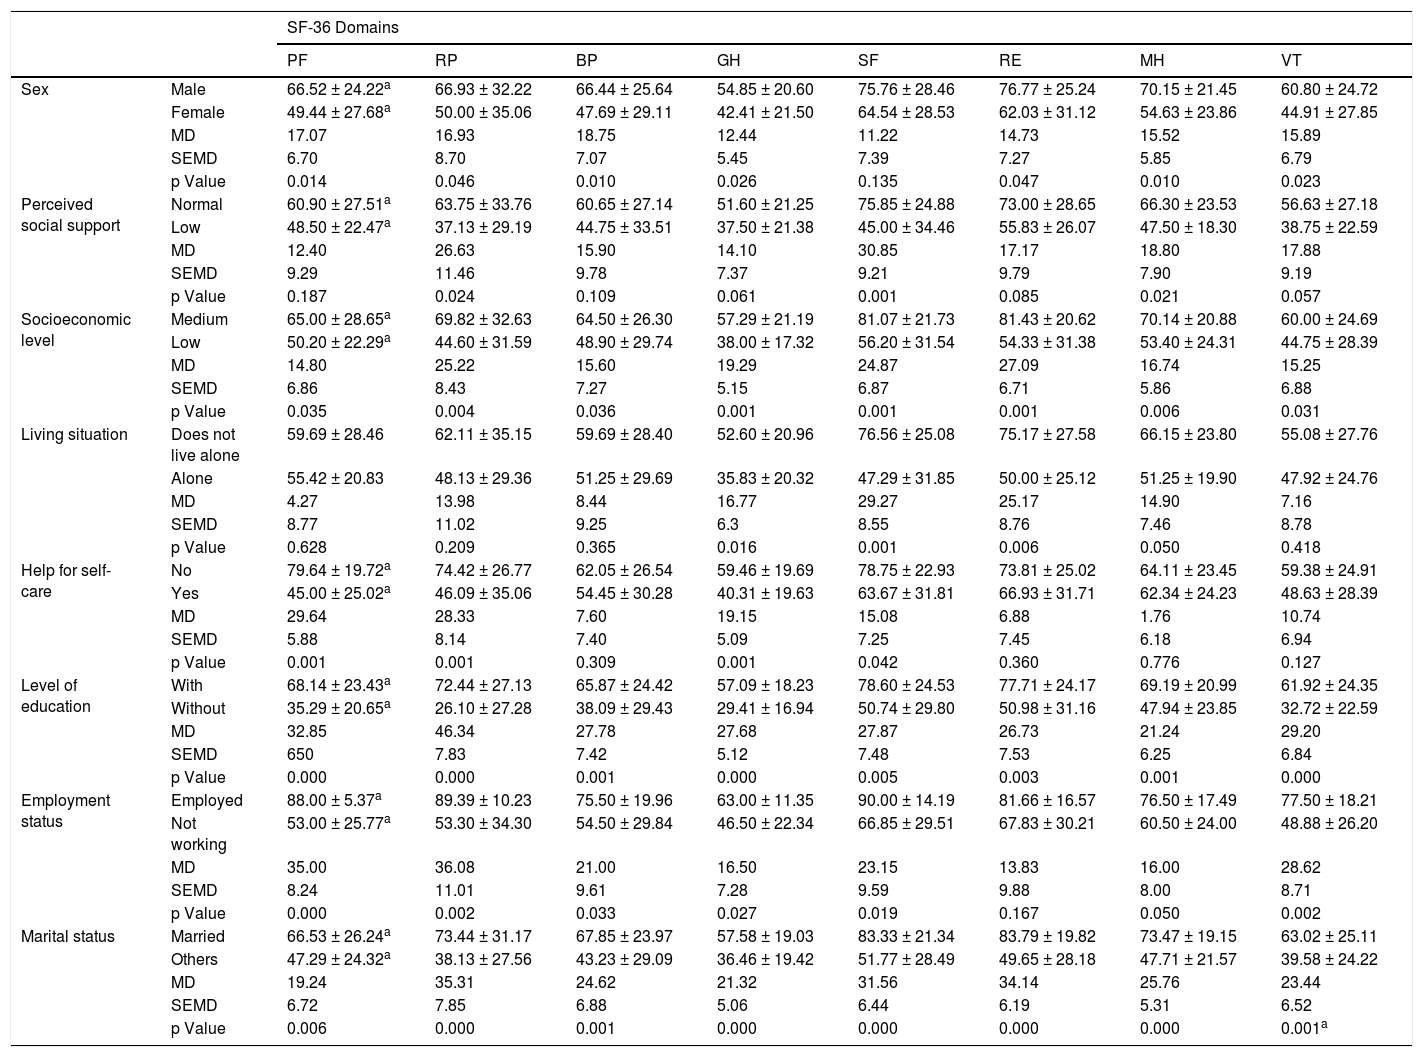
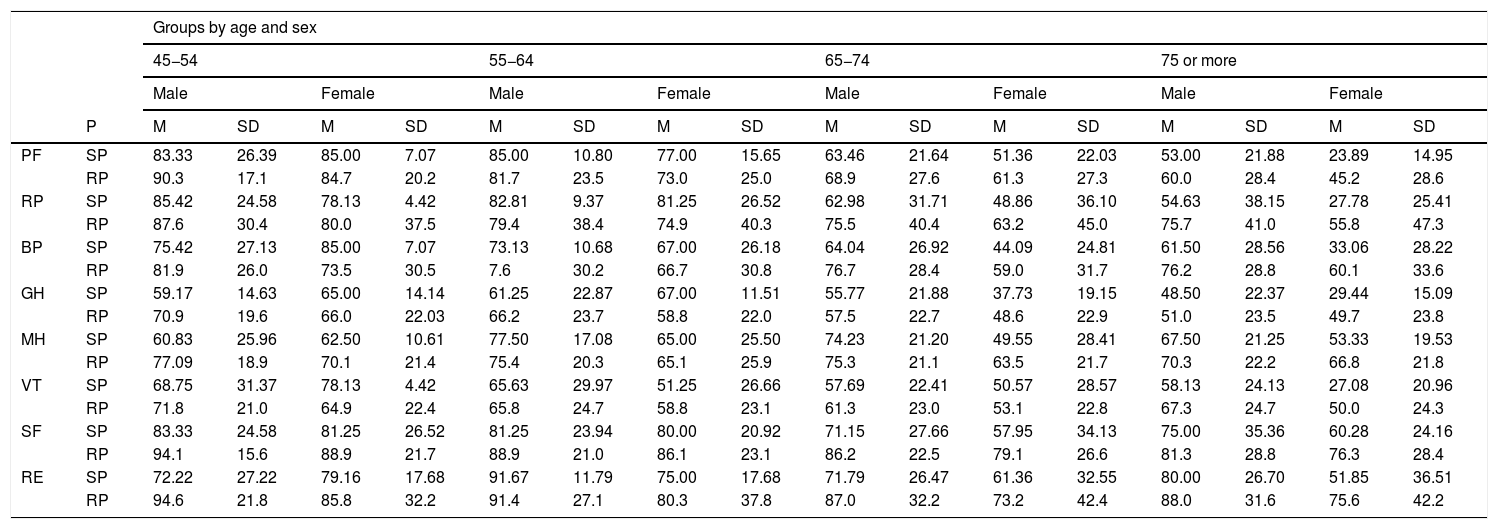
HRQoL of women was significantly lower than that of men in all domains, PF (p = .014), RP (p = .046), BP (p = .010), GH (p = .026), RE (p = .047), MH (p = .010), and VT (p = .023), except for SF (Fig. 1 and Table 2). When comparing the SF-36 questionnaire scores obtained in diabetic patients with the reference scores of the Spanish population13 by age and sex, we did not detect significant differences with respect to the males. In women, we observed significant differences in the >75 years age group with respect to PF (p = .001), RP (p = .006), BP (p = .032), GH (p = .016), and VT (p = .046) domains (Fig. 2 and Table 3).
, physical role (RP), bodily pain (BP), general health (GH), social function (SF), emotional role (RE), mental health (MH), and vitality (VT) domains. The columns show the mean values obtained. *p < .05 vs. the corresponding group.")
SF-36 questionnaire scores in men and women with diabetes mellitus, in the physical function (PF), physical role (RP), bodily pain (BP), general health (GH), social function (SF), emotional role (RE), mental health (MH), and vitality (VT) domains. The columns show the mean values obtained. *p < .05 vs. the corresponding group.
Correlation between socio-demographic variables and the physical function (PF), physical role (RP), bodily pain (BP), general health (GS), social function (SF), emotional role (RE), mental health (MH), and vitality (VT) domains.
| SF-36 Domains | |||||||||
|---|---|---|---|---|---|---|---|---|---|
| PF | RP | BP | GH | SF | RE | MH | VT | ||
| Sex | Male | 66.52 ± 24.22a | 66.93 ± 32.22 | 66.44 ± 25.64 | 54.85 ± 20.60 | 75.76 ± 28.46 | 76.77 ± 25.24 | 70.15 ± 21.45 | 60.80 ± 24.72 |
| Female | 49.44 ± 27.68a | 50.00 ± 35.06 | 47.69 ± 29.11 | 42.41 ± 21.50 | 64.54 ± 28.53 | 62.03 ± 31.12 | 54.63 ± 23.86 | 44.91 ± 27.85 | |
| MD | 17.07 | 16.93 | 18.75 | 12.44 | 11.22 | 14.73 | 15.52 | 15.89 | |
| SEMD | 6.70 | 8.70 | 7.07 | 5.45 | 7.39 | 7.27 | 5.85 | 6.79 | |
| p Value | 0.014 | 0.046 | 0.010 | 0.026 | 0.135 | 0.047 | 0.010 | 0.023 | |
| Perceived social support | Normal | 60.90 ± 27.51a | 63.75 ± 33.76 | 60.65 ± 27.14 | 51.60 ± 21.25 | 75.85 ± 24.88 | 73.00 ± 28.65 | 66.30 ± 23.53 | 56.63 ± 27.18 |
| Low | 48.50 ± 22.47a | 37.13 ± 29.19 | 44.75 ± 33.51 | 37.50 ± 21.38 | 45.00 ± 34.46 | 55.83 ± 26.07 | 47.50 ± 18.30 | 38.75 ± 22.59 | |
| MD | 12.40 | 26.63 | 15.90 | 14.10 | 30.85 | 17.17 | 18.80 | 17.88 | |
| SEMD | 9.29 | 11.46 | 9.78 | 7.37 | 9.21 | 9.79 | 7.90 | 9.19 | |
| p Value | 0.187 | 0.024 | 0.109 | 0.061 | 0.001 | 0.085 | 0.021 | 0.057 | |
| Socioeconomic level | Medium | 65.00 ± 28.65a | 69.82 ± 32.63 | 64.50 ± 26.30 | 57.29 ± 21.19 | 81.07 ± 21.73 | 81.43 ± 20.62 | 70.14 ± 20.88 | 60.00 ± 24.69 |
| Low | 50.20 ± 22.29a | 44.60 ± 31.59 | 48.90 ± 29.74 | 38.00 ± 17.32 | 56.20 ± 31.54 | 54.33 ± 31.38 | 53.40 ± 24.31 | 44.75 ± 28.39 | |
| MD | 14.80 | 25.22 | 15.60 | 19.29 | 24.87 | 27.09 | 16.74 | 15.25 | |
| SEMD | 6.86 | 8.43 | 7.27 | 5.15 | 6.87 | 6.71 | 5.86 | 6.88 | |
| p Value | 0.035 | 0.004 | 0.036 | 0.001 | 0.001 | 0.001 | 0.006 | 0.031 | |
| Living situation | Does not live alone | 59.69 ± 28.46 | 62.11 ± 35.15 | 59.69 ± 28.40 | 52.60 ± 20.96 | 76.56 ± 25.08 | 75.17 ± 27.58 | 66.15 ± 23.80 | 55.08 ± 27.76 |
| Alone | 55.42 ± 20.83 | 48.13 ± 29.36 | 51.25 ± 29.69 | 35.83 ± 20.32 | 47.29 ± 31.85 | 50.00 ± 25.12 | 51.25 ± 19.90 | 47.92 ± 24.76 | |
| MD | 4.27 | 13.98 | 8.44 | 16.77 | 29.27 | 25.17 | 14.90 | 7.16 | |
| SEMD | 8.77 | 11.02 | 9.25 | 6.3 | 8.55 | 8.76 | 7.46 | 8.78 | |
| p Value | 0.628 | 0.209 | 0.365 | 0.016 | 0.001 | 0.006 | 0.050 | 0.418 | |
| Help for self-care | No | 79.64 ± 19.72a | 74.42 ± 26.77 | 62.05 ± 26.54 | 59.46 ± 19.69 | 78.75 ± 22.93 | 73.81 ± 25.02 | 64.11 ± 23.45 | 59.38 ± 24.91 |
| Yes | 45.00 ± 25.02a | 46.09 ± 35.06 | 54.45 ± 30.28 | 40.31 ± 19.63 | 63.67 ± 31.81 | 66.93 ± 31.71 | 62.34 ± 24.23 | 48.63 ± 28.39 | |
| MD | 29.64 | 28.33 | 7.60 | 19.15 | 15.08 | 6.88 | 1.76 | 10.74 | |
| SEMD | 5.88 | 8.14 | 7.40 | 5.09 | 7.25 | 7.45 | 6.18 | 6.94 | |
| p Value | 0.001 | 0.001 | 0.309 | 0.001 | 0.042 | 0.360 | 0.776 | 0.127 | |
| Level of education | With | 68.14 ± 23.43a | 72.44 ± 27.13 | 65.87 ± 24.42 | 57.09 ± 18.23 | 78.60 ± 24.53 | 77.71 ± 24.17 | 69.19 ± 20.99 | 61.92 ± 24.35 |
| Without | 35.29 ± 20.65a | 26.10 ± 27.28 | 38.09 ± 29.43 | 29.41 ± 16.94 | 50.74 ± 29.80 | 50.98 ± 31.16 | 47.94 ± 23.85 | 32.72 ± 22.59 | |
| MD | 32.85 | 46.34 | 27.78 | 27.68 | 27.87 | 26.73 | 21.24 | 29.20 | |
| SEMD | 650 | 7.83 | 7.42 | 5.12 | 7.48 | 7.53 | 6.25 | 6.84 | |
| p Value | 0.000 | 0.000 | 0.001 | 0.000 | 0.005 | 0.003 | 0.001 | 0.000 | |
| Employment status | Employed | 88.00 ± 5.37a | 89.39 ± 10.23 | 75.50 ± 19.96 | 63.00 ± 11.35 | 90.00 ± 14.19 | 81.66 ± 16.57 | 76.50 ± 17.49 | 77.50 ± 18.21 |
| Not working | 53.00 ± 25.77a | 53.30 ± 34.30 | 54.50 ± 29.84 | 46.50 ± 22.34 | 66.85 ± 29.51 | 67.83 ± 30.21 | 60.50 ± 24.00 | 48.88 ± 26.20 | |
| MD | 35.00 | 36.08 | 21.00 | 16.50 | 23.15 | 13.83 | 16.00 | 28.62 | |
| SEMD | 8.24 | 11.01 | 9.61 | 7.28 | 9.59 | 9.88 | 8.00 | 8.71 | |
| p Value | 0.000 | 0.002 | 0.033 | 0.027 | 0.019 | 0.167 | 0.050 | 0.002 | |
| Marital status | Married | 66.53 ± 26.24a | 73.44 ± 31.17 | 67.85 ± 23.97 | 57.58 ± 19.03 | 83.33 ± 21.34 | 83.79 ± 19.82 | 73.47 ± 19.15 | 63.02 ± 25.11 |
| Others | 47.29 ± 24.32a | 38.13 ± 27.56 | 43.23 ± 29.09 | 36.46 ± 19.42 | 51.77 ± 28.49 | 49.65 ± 28.18 | 47.71 ± 21.57 | 39.58 ± 24.22 | |
| MD | 19.24 | 35.31 | 24.62 | 21.32 | 31.56 | 34.14 | 25.76 | 23.44 | |
| SEMD | 6.72 | 7.85 | 6.88 | 5.06 | 6.44 | 6.19 | 5.31 | 6.52 | |
| p Value | 0.006 | 0.000 | 0.001 | 0.000 | 0.000 | 0.000 | 0.000 | 0.001a | |
MD: mean difference; SEMD: standard error of the mean difference.
 and scores in women over 75 years of age with diabetes mellitus (DM), in the physical function (PF), physical role (RP), bodily pain (BP), general health (GH), social function (SF), emotional role (RE), mental health (MH), and vitality (VT) domains. The columns illustrate the mean values obtained. *p < .05; **p < .01 vs. the corresponding group.")
Reference population SF-36 questionnaire scores in women over the age of 75 years (taken from Alonso13) and scores in women over 75 years of age with diabetes mellitus (DM), in the physical function (PF), physical role (RP), bodily pain (BP), general health (GH), social function (SF), emotional role (RE), mental health (MH), and vitality (VT) domains. The columns illustrate the mean values obtained. *p < .05; **p < .01 vs. the corresponding group.
Reference population score on the SF-36 questionnaire by age and sex (taken from Alonso et al., 1998) and scores of the study population with diabetes mellitus (DM), in the physical function (PF), physical role (RP), bodily pain (BP), general health (GH), social function (SF), emotional role (RE), mental health (MH), and vitality (VT) domains.
| Groups by age and sex | |||||||||||||||||
|---|---|---|---|---|---|---|---|---|---|---|---|---|---|---|---|---|---|
| 45−54 | 55−64 | 65−74 | 75 or more | ||||||||||||||
| Male | Female | Male | Female | Male | Female | Male | Female | ||||||||||
| P | M | SD | M | SD | M | SD | M | SD | M | SD | M | SD | M | SD | M | SD | |
| PF | SP | 83.33 | 26.39 | 85.00 | 7.07 | 85.00 | 10.80 | 77.00 | 15.65 | 63.46 | 21.64 | 51.36 | 22.03 | 53.00 | 21.88 | 23.89 | 14.95 |
| RP | 90.3 | 17.1 | 84.7 | 20.2 | 81.7 | 23.5 | 73.0 | 25.0 | 68.9 | 27.6 | 61.3 | 27.3 | 60.0 | 28.4 | 45.2 | 28.6 | |
| RP | SP | 85.42 | 24.58 | 78.13 | 4.42 | 82.81 | 9.37 | 81.25 | 26.52 | 62.98 | 31.71 | 48.86 | 36.10 | 54.63 | 38.15 | 27.78 | 25.41 |
| RP | 87.6 | 30.4 | 80.0 | 37.5 | 79.4 | 38.4 | 74.9 | 40.3 | 75.5 | 40.4 | 63.2 | 45.0 | 75.7 | 41.0 | 55.8 | 47.3 | |
| BP | SP | 75.42 | 27.13 | 85.00 | 7.07 | 73.13 | 10.68 | 67.00 | 26.18 | 64.04 | 26.92 | 44.09 | 24.81 | 61.50 | 28.56 | 33.06 | 28.22 |
| RP | 81.9 | 26.0 | 73.5 | 30.5 | 7.6 | 30.2 | 66.7 | 30.8 | 76.7 | 28.4 | 59.0 | 31.7 | 76.2 | 28.8 | 60.1 | 33.6 | |
| GH | SP | 59.17 | 14.63 | 65.00 | 14.14 | 61.25 | 22.87 | 67.00 | 11.51 | 55.77 | 21.88 | 37.73 | 19.15 | 48.50 | 22.37 | 29.44 | 15.09 |
| RP | 70.9 | 19.6 | 66.0 | 22.03 | 66.2 | 23.7 | 58.8 | 22.0 | 57.5 | 22.7 | 48.6 | 22.9 | 51.0 | 23.5 | 49.7 | 23.8 | |
| MH | SP | 60.83 | 25.96 | 62.50 | 10.61 | 77.50 | 17.08 | 65.00 | 25.50 | 74.23 | 21.20 | 49.55 | 28.41 | 67.50 | 21.25 | 53.33 | 19.53 |
| RP | 77.09 | 18.9 | 70.1 | 21.4 | 75.4 | 20.3 | 65.1 | 25.9 | 75.3 | 21.1 | 63.5 | 21.7 | 70.3 | 22.2 | 66.8 | 21.8 | |
| VT | SP | 68.75 | 31.37 | 78.13 | 4.42 | 65.63 | 29.97 | 51.25 | 26.66 | 57.69 | 22.41 | 50.57 | 28.57 | 58.13 | 24.13 | 27.08 | 20.96 |
| RP | 71.8 | 21.0 | 64.9 | 22.4 | 65.8 | 24.7 | 58.8 | 23.1 | 61.3 | 23.0 | 53.1 | 22.8 | 67.3 | 24.7 | 50.0 | 24.3 | |
| SF | SP | 83.33 | 24.58 | 81.25 | 26.52 | 81.25 | 23.94 | 80.00 | 20.92 | 71.15 | 27.66 | 57.95 | 34.13 | 75.00 | 35.36 | 60.28 | 24.16 |
| RP | 94.1 | 15.6 | 88.9 | 21.7 | 88.9 | 21.0 | 86.1 | 23.1 | 86.2 | 22.5 | 79.1 | 26.6 | 81.3 | 28.8 | 76.3 | 28.4 | |
| RE | SP | 72.22 | 27.22 | 79.16 | 17.68 | 91.67 | 11.79 | 75.00 | 17.68 | 71.79 | 26.47 | 61.36 | 32.55 | 80.00 | 26.70 | 51.85 | 36.51 |
| RP | 94.6 | 21.8 | 85.8 | 32.2 | 91.4 | 27.1 | 80.3 | 37.8 | 87.0 | 32.2 | 73.2 | 42.4 | 88.0 | 31.6 | 75.6 | 42.2 | |
P: population; RP: reference population (reference population values in the Spanish population by age and sex); SD: standard deviation; SP: study population. Source: Alonso.13
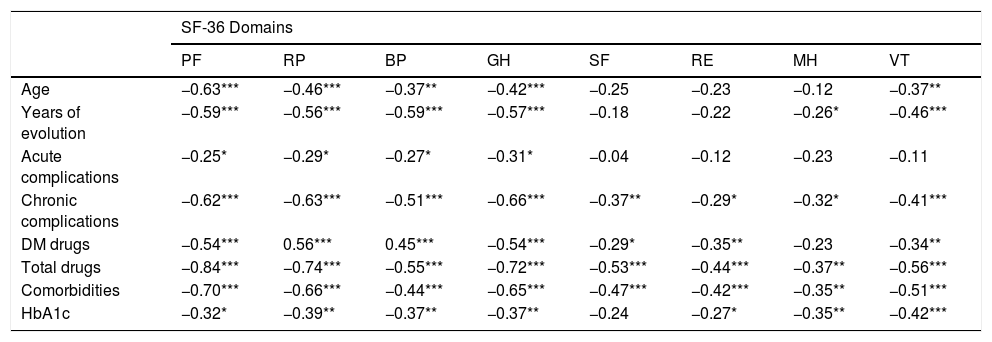
Moreover, we found an inverse correlation between age and PF (p = .001), RP (p = .001), BP (p = .045), GH (p = .001), and VT (p = .003) domain scores; that is, the older the age, the worse the score, and, hence, the worse HRQoL in these domains. The years of disease evolution, frequency of acute complications, number of chronic complications and comorbidities, number of DM drugs, and the total number of drugs prescribed, as well as HbA1c values exhibited a significant inverse correlation with different domains of the SF-36 questionnaire (Table 4). There were no significant correlations between total cholesterol, blood pressure, or body mass index and HRQoL.
Correlation between clinical variables and the physical function (PF), physical role (RP), bodily pain (BP), general health (GH), social function (SF), emotional role (RE), mental health (MH), and vitality (VT) domains in patients with diabetes mellitus.
| SF-36 Domains | ||||||||
|---|---|---|---|---|---|---|---|---|
| PF | RP | BP | GH | SF | RE | MH | VT | |
| Age | −0.63*** | −0.46*** | −0.37** | −0.42*** | −0.25 | −0.23 | −0.12 | −0.37** |
| Years of evolution | −0.59*** | −0.56*** | −0.59*** | −0.57*** | −0.18 | −0.22 | −0.26* | −0.46*** |
| Acute complications | −0.25* | −0.29* | −0.27* | −0.31* | −0.04 | −0.12 | −0.23 | −0.11 |
| Chronic complications | −0.62*** | −0.63*** | −0.51*** | −0.66*** | −0.37** | −0.29* | −0.32* | −0.41*** |
| DM drugs | −0.54*** | 0.56*** | 0.45*** | −0.54*** | −0.29* | −0.35** | −0.23 | −0.34** |
| Total drugs | −0.84*** | −0.74*** | −0.55*** | −0.72*** | −0.53*** | −0.44*** | −0.37** | −0.56*** |
| Comorbidities | −0.70*** | −0.66*** | −0.44*** | −0.65*** | −0.47*** | −0.42*** | −0.35** | −0.51*** |
| HbA1c | −0.32* | −0.39** | −0.37** | −0.37** | −0.24 | −0.27* | −0.35** | −0.42*** |
DM: diabetes mellitus; HbA1c: glycosylated haemoglobin.
Values show Pearson’s correlation coefficient.
Patients with low perceived social support displayed worse HRQoL than those with average support and significantly so in the RP (p = .024), SF (p = .001), and MH (p = .021) domains (Fig. 3A, and Table 2).
, physical role (RP), bodily pain (BP), general health (GH), social function (SF), emotional role (RE), mental health (MH), and vitality (VT). A: SF-36 questionnaire scores according to perceived social support. B: SF-36 questionnaire scores in patients according to socioeconomic level. C: SF-36 questionnaire scores in patients living alone or accompanied. D: SF-36 questionnaire scores according to need for help in DM care. The columns show the mean values obtained. *p < .05; **p < .01; ***p < .001 vs. the corresponding group.")
SF-36 questionnaire scores in patients with diabetes mellitus in the domains physical function (PF), physical role (RP), bodily pain (BP), general health (GH), social function (SF), emotional role (RE), mental health (MH), and vitality (VT). A: SF-36 questionnaire scores according to perceived social support. B: SF-36 questionnaire scores in patients according to socioeconomic level. C: SF-36 questionnaire scores in patients living alone or accompanied. D: SF-36 questionnaire scores according to need for help in DM care. The columns show the mean values obtained. *p < .05; **p < .01; ***p < .001 vs. the corresponding group.
On the other hand, worse HRQoL in all domains was evidenced in patients with low socioeconomic status: PF (p = .035), RP (p = .004), BP (p = .036), GH (p = .001), SF (p = .001), RE (p = .001), MH (p = .006), and VT (p = .031) (Fig. 3B and Table 2). Patients living alone presented worse HRQoL in the GH (p = .016), MH (p = .050), SF (p = .001), and RE (p = .006) domains (Fig. 3C and Table 2); similarly, individuals who needed help with DM care had significantly worse HRQoL in the PF (p = .001), RP (p = .001), GH (p = .001), and SF (p = .042) domains (Fig. 3D and Table 2). Inasmuch as educational level is concerned, overall HRQoL (all domains) was significantly higher in those subjects who had a higher level of education: PF (p = .000), RP (p = .000), BP (p = .001), GH (p = .000), SF (p = .005), RE (p = .003), MH (p = .001), and VT (p = .000); displaying increasing scores as the complexity of the level of studies performed increases (Fig. 4A and Table 2). As for to employment status, actively employed participants exhibited significantly better HRQoL in all domains except RE compared to the retired and unemployed: PF (p = .000), RP (p = .002), BP (p = .033), GH (p = .027), SF (p = .019), MH (p = .05), and VT (p = .002) (Fig. 4B and Table 2), whereas, if we factor marital status in, married people had significantly higher HRQoL than single and widowed individuals in the different SF-36 domains, especially in the psychosocial domains (Fig. 4C and Table 2).
, physical role (RP), bodily pain (BP), general health (GH), social function (SF), emotional role (RE), mental health (MH), and vitality (VT) domains. A: SF-36 questionnaire scores according to educational level. B: SF-36 questionnaire scores according to employment status. C: SF-36 questionnaire scores according to marital status. The markers show the mean values obtained.")
SF-36 questionnaire scores in patients with diabetes mellitus in the physical function (PF), physical role (RP), bodily pain (BP), general health (GH), social function (SF), emotional role (RE), mental health (MH), and vitality (VT) domains. A: SF-36 questionnaire scores according to educational level. B: SF-36 questionnaire scores according to employment status. C: SF-36 questionnaire scores according to marital status. The markers show the mean values obtained.
No significant differences were found in HRQoL according to the type of DM, frequency of nursing check-ups, or the diabetes education received.
DiscussionHRQoL is an important element to take into account when making decisions about the implementation of benefits and allocation of resources for the healthcare system. Few studies have been performed that address HRQoL in the diabetic population and most of them have analysed isolated variables.
The data from the present study reveal that women with DM have worse HRQoL than men in all domains of the SF-36, except for SF. Several studies in the general population have yielded similar results,13,14 which are not explained by the possible differences between sexes in the sociodemographic and clinical profiles. Despite the fact that women have a longer life expectancy, paradoxically, they tend to perceive worse HRQoL.15 In fact, in Spain, the positive self-assessment of health status is higher in men16 and men live out 84.5% of their life expectancy years in good health compared to 79.2% of women.3 This poorer perception of health status in women with DM might have to do with a lower level of satisfaction with treatment, worse adaptation to their activities of daily living, and a greater physical and mental burden of the disease.17–20 In both sexes, the domain with the worst assessment was GH, whereas the domains with the best scores were those referring to psychosocial health status (SF, RE, MH), with the exception for VT. This appears to demonstrate that, despite experiencing more physical limitations, these individuals have the ability to cope with them and manage the psychosocial distress caused by DM care.
The few studies available, show that the HRQoL of patients with DM is significantly lower than that of the general population, particularly with regard to physical aspects.7,17,21 However, on comparing the data from the sample studied with the reference population SF-36 scores, similar HRQoL was found between diabetic and non-diabetic patients, except in the case of females over the age of 75, who presented significantly lower values than those of their reference counterparts (sex and age) in the PF, RP, BP, GH, and VT domains. These data seem to indicate that HRQoL in individuals with DM is generally acceptable, although it decreases markedly in women after 75 years of age, especially in the physical dimension. We can deduce that this is reasonable since, in our sample, women presented worse HRQoL, and, moreover, being older was associated with worse HRQoL in both sexes. This would lead to a sum effect that is evident in the low HRQoL scores of older females. Thus, in practice, it would be important to take into account that patients with these characteristics are more likely to be in situations of poor HRQoL. The study by Hervás et al., which used the SF-36 and a sample similar to ours, revealed that patients with DM had worse HRQoL compared to the reference population on the PF, BP, GH, SF, and RE scales.7 Thus, these results differ from ours, probably because they compared the HRQoL of diabetic individuals with that of the general population without disaggregating by sex and age.
In line with other published studies, we found an inverse relationship between HRQoL and various clinical factors related to DM, such as the years of disease progression,18,20 the number of complications,22 and chronic comorbidities.18,22 Concerning comorbidities, we found that more than half of the diabetics had hypertension, dyslipidaemia, or obesity.23 Interestingly, the psychosocial domains were not significantly affected by age, years of disease progression, or the presence of acute complications, as was the case with other clinical variables.
No studies have been found that relate the complexity of patients’ drug regimen or the presence of polytherapy with HRQoL in DM, albeit the use of insulin has been related to worse physical and mental HRQoL.18,20 This might be the case because insulinization is established in more advanced stages of type 2 DM or when there are complications, in addition to entailing greater difficulty in associated with managing the treatment plan. In the present study, a complicated drug schedule (both general and specific to DM) is related to worse HRQoL, which may be due in part to the evolution of the DM itself, but also to the additional complexity in managing and adhering to treatment, and in the self-care required by the disease. Furthermore, patients with higher HbA1c levels presented worse HRQoL, which is consistent with the findings of previous studies.24,25 This poor glycaemic control may contribute to the appearance of complications that affect HRQoL, and may also reflect difficulties in self-care and management of pharmacological and non-pharmacological treatment, circumstances that are also associated with low HRQoL. It is important to highlight that the psychosocial domains of HRQoL and not only the physical ones, are affected by many of the variables scrutinized. In particular, the presence of chronic complications and comorbidities, a complex pharmacological regimen, and poor glycaemic control determine poor HRQoL in the psychosocial domain, in addition to the physical domain.
With respect to the sociodemographic profile, the results exhibited that, overall, the patients with the best HRQoL were those with a medium socioeconomic level and higher level of education, who did not live alone, were married, and were active in the labour market.18,20 This can be accounted for by the fact that people with this profile tend to have healthier lifestyle habits, greater knowledge about health, better relationships with healthcare providers, and better compliance with treatment.26,27 It is worth noting the dearth of publications in this regard, making it impossible to discuss these results with those of other, earlier studies.
These findings provide a global perspective of the state of health and its perception by the diabetic patient, and reveal that the impact of DM on patients should not be evaluated solely by objective, clinical parameters, but that the influence of functional and psychosocial aspects and the patient’s own perception should be taken into account. The results of the present study may be important for the evaluation of the impact of DM in individuals in primary care, as well as for the implementation of effective interdisciplinary interventions in the integral management of the patient with DM.
The present study is not without limitations. Future research is recommended that should include a larger, prospective, multicentre sample, with random sampling.
In conclusion, women with DM aged 75 years or more have significantly lower HRQoL values than those of their reference population group, mainly in the physical dimension. Women with DM have worse HRQoL than men with DM. Age, years of evolution of DM, the presence of acute and chronic complications, as well as comorbidities, a complex pharmacological regimen (both general and DM-specific), and poor glycaemic control (represented by HbA1c) are related to worse HRQoL in patients with DM. Living alone, having a low socioeconomic status, low perceived social support, and needing help with DM care are associated with poor HRQoL. Being married, being actively employed, and being well-educated correlated with better HRQoL.
FundingThere is no funding.
Conflict of interestsNone.
Please cite this article as: Gálvez Galán I, Cáceres León MC, Guerrero-Martín J, López Jurado CF, Durán-Gómez N. Calidad de vida relacionada con la salud en pacientes con diabetes mellitus en una zona básica de salud. Enferm Clín. 2021;31:313–322.
