


This study was intended to establish the percentile distribution of waist circumference in schoolchildren from Bogota, Colombia, participating in the FUPRECOL Study.
MethodsA cross-sectional study conducted in 3,005 children and 2,916 adolescents aged 9–17.9 years. Height, weight, waist circumference, hip circumference, and self-assessed sexual maturity status were recorded. Percentiles (3rd, 10th, 25th, 50th, 75th, 90th, and 97th) and smoothed sex- and age-specific curves were calculated, and the waist circumference values found were compared to international references from other ethnic populations.
ResultsFifty-seven percent of the overall population (n=5,921) were females (mean age, 12.7±2.3 years). In most age groups, waist circumference was greater in boys as compared to girls. The increase between the 50th and 97th percentiles by age was 15.7cm in boys aged 9–9.9 years and 16.0cm in girls aged 11–11.9 years. Comparison of our study results, by age group and sex, to international references showed that our 50th percentile was lower than reported in Peru and the UK except for studies in India, Venezuela (Merida), US, and Spain was higher.
ConclusionsAge- and sex-specific percentiles of waist circumference obtained from children and adolescents from Bogota, Colombia, are reported. They may be used as a reference both for nutritional assessment and for predicting cardiovascular risks at early ages.
El objetivo de este estudio fue establecer la distribución por percentiles de la circunferencia de cintura en una población escolar de Bogotá (Colombia) que participó en el estudio FUPRECOL.
MétodosEstudio transversal, realizado en 3.005 niños y 2.916 adolescentes de entre 9 y 17,9 años de edad. Se tomaron medidas de peso, talla, circunferencia de cintura, circunferencia de cadera y estado de maduración sexual por autorreporte. Se calcularon los percentiles (P3, P10, P25, P50, P75, P90 y P97) y curvas centiles según sexo y edad. Se realizó una comparación entre los valores de la circunferencia de cintura observados con estándares internacionales y grupos poblacionales.
ResultadosDe la población general (n=5.921), el 57% eran chicas (promedio de edad 12,7±2,3 años). En la mayoría de los grupos etarios, la circunferencia de cintura de los chicos fue superior a la de las chicas. El aumento entre el P50-P97 de la circunferencia de cintura, por edad, fue mínimo de 15,7cm en chicos de 9-9,9 años y de 16,0cm en las chicas de 11-11,9 años. Al comparar los resultados de este estudio, por grupos de edad y sexo con trabajos internacionales, el P50 fue inferior al reportado en Perú e Inglaterra a excepción de los trabajos de la India, Venezuela (Mérida), Estados Unidos y España donde fue mayor.
ConclusionesSe presentan percentiles de la circunferencia de cintura según edad y sexo que podrán ser usados de referencia en la evaluación del estado nutricional y en la predicción del riesgo cardiovascular por exceso de adiposidad desde edades tempranas.
It has been estimated that 10% of children of school age worldwide have excess weight and that 25% of them are obese.1 In a recent review, Rivera et al.2 analyzed data collected from population studies conducted in countries such as Brazil, Mexico, Argentina, Peru, Colombia, and Chile between 2008 and 2013, and concluded that one out of five Latin American children and adolescents have overweight and obesity. According to these authors, by 2015 the prevalence of this risk factor in the population over 20 years of age would reach 39%, as compared to the 23% prevalence in 2010. According to the most recent Nutritional Survey conducted in Colombia (2010)3 and the Report Card published by González et al.,4 13.4% of children have excess weight and 4.1% of adolescents are obese.
It has been estimated that interventions for the control and treatment of central obesity significantly increase healthcare costs and decrease academic performance in school.5 For this reason, the early identification of the risk of pediatric obesity at school is a priority in primary care. Waist circumference (WC) is an anthropometric marker used to estimate abdominal fat6,7 because it has a positive and significant correlation to the amount of intra-abdominal fat and makes it possible to identify people with cardiometabolic risk with greater accuracy than the body mass index (BMI).8
South American people have unique body growth, development, and composition characteristics because of their racial intermix of European, American Indian, and African ancestors. This makes it difficult to establish the changes and differences in environmental and genetic factors.2,9 WC percentiles, rather than absolutes values, have been used to compensate for the variations inherent in child development and ethnic origin.10 Several studies have reported reference values and WC centile charts for children and adolescents in countries such as Colombia (Santiago de Cali),11 Venezuela (Mérida),12 Peru,13 India,14 England,15 United States,16 Spain (Alimentación y valoración del estado nutricional en adolescentes, [Diet and assessment of nutritional status in adolescents], AVENA),17 and Europe (Healthy lifestyle in Europe by nutrition in adolescence, HELENA18; Identification and prevention of diet-induced effects and lifestyle on children's health, IDEFICS).19
The purpose of this study was to determine the percentile distribution of waist circumference in a school population from Bogotá (Colombia) participating in the FUPRECOL study. A secondary objective was to compare WC values recorded in this and other international studies.
MethodsStudy design and populationThis study was a secondary analysis of the FUPRECOL study. This was a cross-sectional study conducted on 6000 schoolchildren and adolescents aged 9–17 years living in the metropolitan area of the district of Bogotá, Colombia (2480 meters above sea level). All the students belonged to a social status or socioeconomic level 1–3 (low) according to the system for identification of potential beneficiaries of social schemes (SISBEN) defined by the Colombian government. Valid data were obtained from 5921 schoolchildren (response rate, 98.6%) from the study population in anthropometric assessments performed at 24 official educational institutions. Schoolchildren with permanent physical, sensory, and intellectual disability, non-transmissible diseases such as type 1 or 2 diabetes mellitus, cardiovascular disease, autoimmune disease or diagnosed cancer, who were pregnant, who had documented alcohol or drug abuse and, more generally, had diseases not directly related to nutrition were excluded from the study.
Sample sizeThe 546,000 registrations of 2013, provided by the educational department of the district, were used as a reference for the population. For this calculation, the Schlesselmann equation20 for the population size of known samples was used, with an α=0.05 (95% reliability). The variance estimated for subjects with excess weight (obesity/overweight) used for this population was 20%, in accordance with the most recent Colombian Nutritional Status Survey (2010).3 The sample size was therefore calculated to estimate the difference between the estimated and actual proportion of 5% for a sample size of 3131, which was adjusted to 4000 subjects due to potential losses in the enrollment process. Convenience sampling by order of arrival to the data collection point was used. To decrease the bias inherent in a probabilistic sample, a sample weight was assigned a posteriori to each participant, calculated from stratification by age groups (±2 years). For this, “N” was considered as the population size and “n” as the sample size, with probabilities of enrollment of πi=n/Ni and sampling weights of ωi=n/N. The sample size of this study was calculated based on a mean waist circumference of 58cm and a standard deviation of 10cm, obtained from a prior study on Colombian children and adolescents,21 with an alpha error of 5%, a beta error of 20%, a 2% precision, and an 80% a priori power. The final sample size was 5921 participants, and effective exclusion was made a posteriori and not known by the schoolchildren. The data were collected during the 2014–2015 period.
ProceduresBefore the start of the study, a detailed explanation was given to each child or adolescent and his/her parents or guardians, and written consent was obtained. Authorization was also given by the heads of the schools participating in the study. The FUPRECOL study was conducted in compliance with the ethical standards recognized by the Declaration of Helsinki and Decision 008439, of 1993, of the Colombian Ministry of Health regulating clinical research in humans. The study was also approved by the Committee for Research in Humans of the university responsible for the study (UR No CEI-ABN026-000262).
Physical examinationBefore the study measurements were performed, researchers and healthcare and sport professionals attended 10 theoretical and practical sessions to standardize the evaluation process of the morphological component described in the ALPHA-Fitness Test Battery.22 Weight was measured using a TANITA® model BF-689 scale (Arlington Heights, IL 60005, USA), with a resolution of 0.100kg. Height was measured with a portable SECA 206 stadiometer (Hamburg, Germany) with a range of 0–220cm and a precision of 1mm. These variables were used to calculate the BMI in kg/m2. WC was measured using an inextensible measuring tape at a point midway between the costal margin and the iliac crest (anterosuperior iliac spine) with the subject standing and breathing out. Hip circumference was measured at the gluteal prominence level, and WHR was calculated as the ratio of waist to hip circumference. The maturation stage of the participants was assessed using the method described by Tanner,23 namely the self-reporting of sexual maturation staging based on standard drawings depicting the characteristics of genital and pubic hair development in boys and breast and pubic hair development in girls. In the Latin population, the report by Matsudo et al.24 showed coefficients of agreement higher than 0.60 (Cohen's kappa) between direct measurement by pediatricians and the self-report for breasts and pubic hair in girls (69.7%–71.3%) and for genitalia combined with pubic hair in boys (60%). The abovementioned measurements were taken using certified devices and according to the standards of the international biological program prepared by the International Council of Scientific Unions, including the essential procedures for the biological study of human populations.25
Statistical analysisA Kolmogorov–Smirnov test was used to verify normal data distribution. Continuous values were expressed as mean and standard deviation. Tests for the homogeneity of variances were performed with a two-way ANOVA test to find differences between the continuous variables. To provide centile values and construct WC charts for each sex, the LMS method proposed by Cole and Green26 implemented in LMSchartmaker Pro software version 2.54 was used.27 The LMS method allows for the standardization of the distribution of independent data with positive values at each age using a Box–Cox transformation. Three smoothed curves specific for each age were obtained: curve L (Box–Cox transformation), curve M (median), and curve S (coefficient of variation). The equivalent degrees of freedom for L(t), M(t), and S(t) measured the complexity of alignment of each curve. The appropriate number of degrees of freedom was established according to the proposals of Pan and Cole,28 based on graphic representations of the Q-test29 and Worm plots30 to assess model quality. Finally, percentiles (3rd, 10th, 25th, 50th, 75th, 90th, and 97th) by sex and age were calculated, and the WC values found in this study were compared to the values reported in international studies.
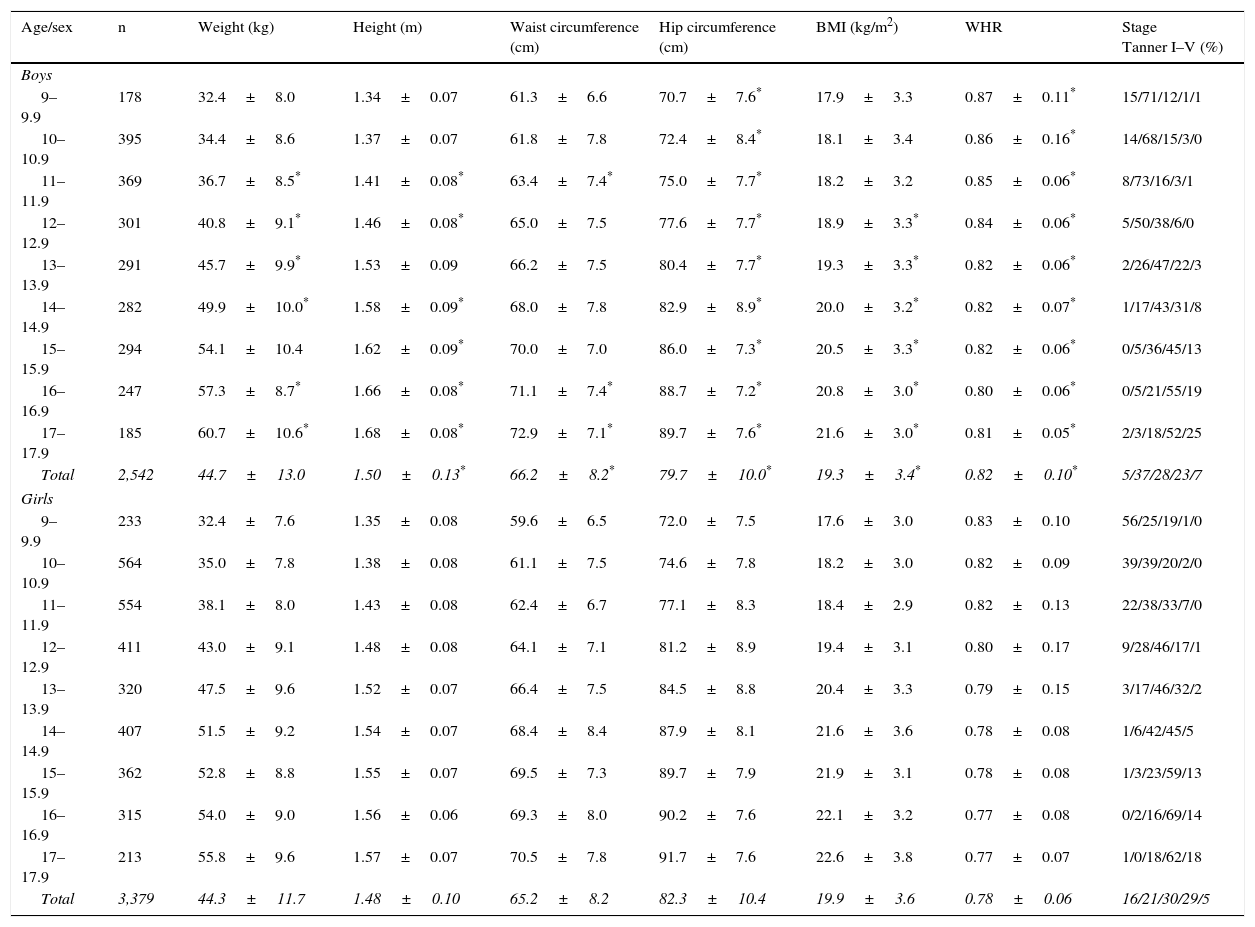
ResultsThe study sample consisted of 5921 schoolchildren from 24 official educational institutions in Bogotá (Colombia), of whom 57.7% were girls. In the overall population, the mean age was 12.7±2.4 years, the mean body weight was 44.6±12.3kg, the mean height was 1.49±0.12, and the mean BMI was 19.6±3.5kg/m2. As regards the maturation stage, the great majority of the boys were in stages II (37.2%) and III (27.8), while stages III (30.2%) and IV (28.8%) were the most common for the girls. In all age groups, ANOVA analysis showed that boys had greater height, WC, and WHR values than girls, while girls had greater hip circumference values, p<0.01 (Table 1).
Anthropometric characteristics of schoolchildren assessed (no.=5921).
| Age/sex | n | Weight (kg) | Height (m) | Waist circumference (cm) | Hip circumference (cm) | BMI (kg/m2) | WHR | Stage Tanner I–V (%) |
|---|---|---|---|---|---|---|---|---|
| Boys | ||||||||
| 9–9.9 | 178 | 32.4±8.0 | 1.34±0.07 | 61.3±6.6 | 70.7±7.6* | 17.9±3.3 | 0.87±0.11* | 15/71/12/1/1 |
| 10–10.9 | 395 | 34.4±8.6 | 1.37±0.07 | 61.8±7.8 | 72.4±8.4* | 18.1±3.4 | 0.86±0.16* | 14/68/15/3/0 |
| 11–11.9 | 369 | 36.7±8.5* | 1.41±0.08* | 63.4±7.4* | 75.0±7.7* | 18.2±3.2 | 0.85±0.06* | 8/73/16/3/1 |
| 12–12.9 | 301 | 40.8±9.1* | 1.46±0.08* | 65.0±7.5 | 77.6±7.7* | 18.9±3.3* | 0.84±0.06* | 5/50/38/6/0 |
| 13–13.9 | 291 | 45.7±9.9* | 1.53±0.09 | 66.2±7.5 | 80.4±7.7* | 19.3±3.3* | 0.82±0.06* | 2/26/47/22/3 |
| 14–14.9 | 282 | 49.9±10.0* | 1.58±0.09* | 68.0±7.8 | 82.9±8.9* | 20.0±3.2* | 0.82±0.07* | 1/17/43/31/8 |
| 15–15.9 | 294 | 54.1±10.4 | 1.62±0.09* | 70.0±7.0 | 86.0±7.3* | 20.5±3.3* | 0.82±0.06* | 0/5/36/45/13 |
| 16–16.9 | 247 | 57.3±8.7* | 1.66±0.08* | 71.1±7.4* | 88.7±7.2* | 20.8±3.0* | 0.80±0.06* | 0/5/21/55/19 |
| 17–17.9 | 185 | 60.7±10.6* | 1.68±0.08* | 72.9±7.1* | 89.7±7.6* | 21.6±3.0* | 0.81±0.05* | 2/3/18/52/25 |
| Total | 2,542 | 44.7±13.0 | 1.50±0.13* | 66.2±8.2* | 79.7±10.0* | 19.3±3.4* | 0.82±0.10* | 5/37/28/23/7 |
| Girls | ||||||||
| 9–9.9 | 233 | 32.4±7.6 | 1.35±0.08 | 59.6±6.5 | 72.0±7.5 | 17.6±3.0 | 0.83±0.10 | 56/25/19/1/0 |
| 10–10.9 | 564 | 35.0±7.8 | 1.38±0.08 | 61.1±7.5 | 74.6±7.8 | 18.2±3.0 | 0.82±0.09 | 39/39/20/2/0 |
| 11–11.9 | 554 | 38.1±8.0 | 1.43±0.08 | 62.4±6.7 | 77.1±8.3 | 18.4±2.9 | 0.82±0.13 | 22/38/33/7/0 |
| 12–12.9 | 411 | 43.0±9.1 | 1.48±0.08 | 64.1±7.1 | 81.2±8.9 | 19.4±3.1 | 0.80±0.17 | 9/28/46/17/1 |
| 13–13.9 | 320 | 47.5±9.6 | 1.52±0.07 | 66.4±7.5 | 84.5±8.8 | 20.4±3.3 | 0.79±0.15 | 3/17/46/32/2 |
| 14–14.9 | 407 | 51.5±9.2 | 1.54±0.07 | 68.4±8.4 | 87.9±8.1 | 21.6±3.6 | 0.78±0.08 | 1/6/42/45/5 |
| 15–15.9 | 362 | 52.8±8.8 | 1.55±0.07 | 69.5±7.3 | 89.7±7.9 | 21.9±3.1 | 0.78±0.08 | 1/3/23/59/13 |
| 16–16.9 | 315 | 54.0±9.0 | 1.56±0.06 | 69.3±8.0 | 90.2±7.6 | 22.1±3.2 | 0.77±0.08 | 0/2/16/69/14 |
| 17–17.9 | 213 | 55.8±9.6 | 1.57±0.07 | 70.5±7.8 | 91.7±7.6 | 22.6±3.8 | 0.77±0.07 | 1/0/18/62/18 |
| Total | 3,379 | 44.3±11.7 | 1.48±0.10 | 65.2±8.2 | 82.3±10.4 | 19.9±3.6 | 0.78±0.06 | 16/21/30/29/5 |
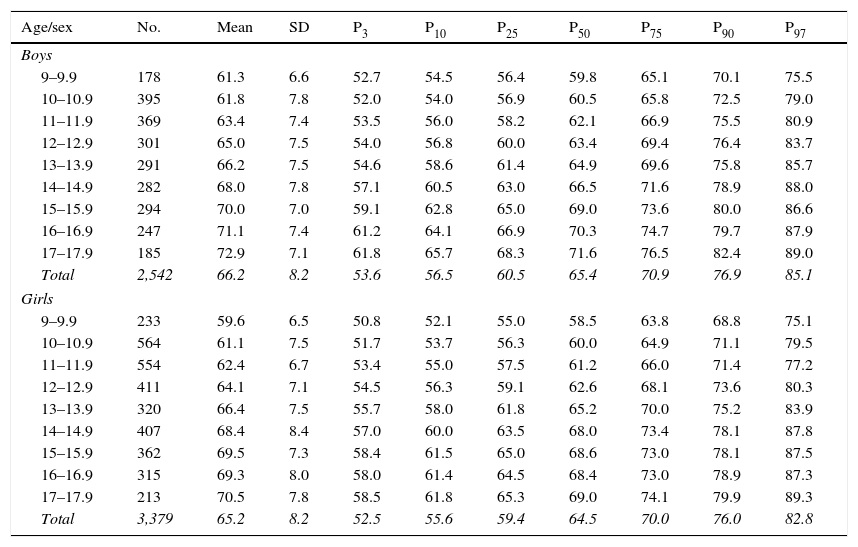
Table 2 shows the distribution of WC percentiles by age and sex. In participants aged 9–12.9 years, WC was higher in boys than in girls, and mean±SD showed an increase in the values recorded from 9 to 17.9 years in both groups. The difference between the P25th and the P75th of waist in both sexes was 3–5cm until 14.9 years; from this age, boys were found to have a greater increase in circumference as compared to girls. The increase in WC from the P50th to the P97th by age was 15.7cm in boys aged 9–9.9 years and 16.0cm in girls aged 11–11.9 years. WC values greater than the P75th are considered to be high and, thus, to be predictors of cardiovascular risk and metabolic syndrome. In this sample, WC P75th values ranged from 61.5 to 76.5cm in boys and from 63.8 to 74.1cm in girls.
Percentile distribution of waist circumference by age and sex.
| Age/sex | No. | Mean | SD | P3 | P10 | P25 | P50 | P75 | P90 | P97 |
|---|---|---|---|---|---|---|---|---|---|---|
| Boys | ||||||||||
| 9–9.9 | 178 | 61.3 | 6.6 | 52.7 | 54.5 | 56.4 | 59.8 | 65.1 | 70.1 | 75.5 |
| 10–10.9 | 395 | 61.8 | 7.8 | 52.0 | 54.0 | 56.9 | 60.5 | 65.8 | 72.5 | 79.0 |
| 11–11.9 | 369 | 63.4 | 7.4 | 53.5 | 56.0 | 58.2 | 62.1 | 66.9 | 75.5 | 80.9 |
| 12–12.9 | 301 | 65.0 | 7.5 | 54.0 | 56.8 | 60.0 | 63.4 | 69.4 | 76.4 | 83.7 |
| 13–13.9 | 291 | 66.2 | 7.5 | 54.6 | 58.6 | 61.4 | 64.9 | 69.6 | 75.8 | 85.7 |
| 14–14.9 | 282 | 68.0 | 7.8 | 57.1 | 60.5 | 63.0 | 66.5 | 71.6 | 78.9 | 88.0 |
| 15–15.9 | 294 | 70.0 | 7.0 | 59.1 | 62.8 | 65.0 | 69.0 | 73.6 | 80.0 | 86.6 |
| 16–16.9 | 247 | 71.1 | 7.4 | 61.2 | 64.1 | 66.9 | 70.3 | 74.7 | 79.7 | 87.9 |
| 17–17.9 | 185 | 72.9 | 7.1 | 61.8 | 65.7 | 68.3 | 71.6 | 76.5 | 82.4 | 89.0 |
| Total | 2,542 | 66.2 | 8.2 | 53.6 | 56.5 | 60.5 | 65.4 | 70.9 | 76.9 | 85.1 |
| Girls | ||||||||||
| 9–9.9 | 233 | 59.6 | 6.5 | 50.8 | 52.1 | 55.0 | 58.5 | 63.8 | 68.8 | 75.1 |
| 10–10.9 | 564 | 61.1 | 7.5 | 51.7 | 53.7 | 56.3 | 60.0 | 64.9 | 71.1 | 79.5 |
| 11–11.9 | 554 | 62.4 | 6.7 | 53.4 | 55.0 | 57.5 | 61.2 | 66.0 | 71.4 | 77.2 |
| 12–12.9 | 411 | 64.1 | 7.1 | 54.5 | 56.3 | 59.1 | 62.6 | 68.1 | 73.6 | 80.3 |
| 13–13.9 | 320 | 66.4 | 7.5 | 55.7 | 58.0 | 61.8 | 65.2 | 70.0 | 75.2 | 83.9 |
| 14–14.9 | 407 | 68.4 | 8.4 | 57.0 | 60.0 | 63.5 | 68.0 | 73.4 | 78.1 | 87.8 |
| 15–15.9 | 362 | 69.5 | 7.3 | 58.4 | 61.5 | 65.0 | 68.6 | 73.0 | 78.1 | 87.5 |
| 16–16.9 | 315 | 69.3 | 8.0 | 58.0 | 61.4 | 64.5 | 68.4 | 73.0 | 78.9 | 87.3 |
| 17–17.9 | 213 | 70.5 | 7.8 | 58.5 | 61.8 | 65.3 | 69.0 | 74.1 | 79.9 | 89.3 |
| Total | 3,379 | 65.2 | 8.2 | 52.5 | 55.6 | 59.4 | 64.5 | 70.0 | 76.0 | 82.8 |
SD: standard deviation; P: percentile.
Fig. 1 shows the first centile curves (from bottom to top: P3rd, P10th, P25th, P50th, P75th, P90th, P97th) of WC in schoolchildren from Bogotá (Colombia). In boys, a marked increase was seen in the P50th from 59.8cm at 9–9.9 years to 71.6cm at 17–17.9 years, as compared to an increase from 58.5 to 69.0cm in girls. At 17–17.9 years of age, the P75th of boys was 2.5cm greater as compared to girls.
 of WC in schoolchildren from Bogotá (Colombia). (A) Boys, (B) girls.")
Finally, Fig. 2 compares the P50th values in this study (by age and sex groups) to data from other international studies in children and adolescents. The P50th was lower than the values reported in Peru and England, but higher than those from studies in India, Venezuela (Mérida), the United States, and Spain.
Discussion of waist circumference between children and adolescents from Bogotá (Colombia) and the quoted studies by age and sex groups. (A) Boys, (B) girls.")
This study reports for the first time for Bogotá (Colombia) tables, percentiles, and centile curves for WC by age and sex that may be used as reference standards in the evaluation of nutritional status and body composition in schoolchildren and adolescents. Waist circumference in prepubertal and pubertal boys and girls and its correlation to current metabolic syndrome and to the risk of metabolic and cardiovascular disease in adults has recently started to be studied.5–8 The results of European17–19 and US studies16 show that WC is a good indicator of central obesity in children and adolescents and has clinical7 and epidemiological value.5–8,21 In children, WC is a better indicator of visceral fat than the BMI.31
Most reference values in a school setting focusing on WC measurements have shown results similar to those of this study.11–19 The findings in this study agree with data reported by Fernández et al.16 in North American children of different ethnic origins. Similar to reports in other studies,11–19,21 WC values were higher in boys as compared to girls and increased with age. Without using statistical procedures, it may be seen that median (P50th) WC in Bogotá children and adolescents of both sexes was lower than in almost all the studies reviewed,13–16 except for those conducted in the United States16 and Europe.17–19 Boys had P50th WC values similar to those found in the population of Santiago de Cali (Colombia),11 Peru,13 India,14 and England,15 but not to those found in schoolchildren in Mérida (Venezuela),12 the United States,16 and Spain.17–19 In girls from Bogotá (Colombia), the P50th was lower than that reported by all studies, except for the ones conducted in girls in India,13 Mérida (Venezuela),12 the United States,16 and Spain.17–19
The waist measurement (P50th) of boys from Bogotá aged 9–17.9 years increased by 11.8cm, and of girls by 10.5cm; increases in each sex were however different according to age group. WC values in girls and boys aged 9–12.9 years were different from those reported in the NHANES III,32 Freedman et al.,7 and Hirschler et al. international studies,33 and similar to the values found in local studies by Benjumea et al.34 and Aguilar de Plata et al.,14 which may possibly be explained by the sexual maturity processes in each population. This emphasizes the need for having our own reference standards according to sex and age.
The increase in WC from the P50th to the P97th by age was 15.7cm, in boys aged 9–9.9 years, and 16.0cm in girls aged 11–11.9 years. Different researchers have proposed various cut-off points for WC as a risk marker for metabolic conditions. While some authors propose different percentiles and means,11–19 others suggest two or three standard deviations from the mean as the cut-off point.35,36 Inokuchi et al.,37 in their study of Japanese children, proposed the use of the P97th in clinical practice, while Katzmarzyk38 in his study of Canadian students aged 11–18 years proposed the P90th and P95th to distinguish those with excess WC by age and sex. Ramírez-Vélez et al.21 noted that children with WC values exceeding the P90th had a greater risk of hypertriglyceridemia (OR: 2.93; 95% CI: 1.81–4.73) and high blood pressure (OR: 3.09; 95% CI: 0.94–10.1) even after adjustments were made for age, sex, and calorie intake. In this study, WC values higher than the P75th were considered elevated, and therefore as predictors of cardiovascular risk and metabolic syndrome, as suggested by Fernández et al.16 in North American children. In this sample, WC P75th values ranged from 61.5 to 76.5cm in boys and from 63.8 to 74.1cm in girls. This cut-off point has also been accepted by the International Diabetes Federation as a marker of central obesity for the diagnosis of metabolic syndrome in children and adolescents from Latin countries.19,39
On the other hand, a harmonic increase in weight and WC in the different age groups is shown by an inverse relationship to WHR–an indicator of obesity that expresses the good interaction of genetic and environmental factors. The population in this study showed this behavior, which was reflected in the percentiles found, and an increase was seen in both sexes in WC and hip circumference values. This could be explained by the influence of growth in puberty, by neuroendocrine and hormonal factors under genetic control.15
The increase in WC at all ages in our study agrees with the currently available scientific evidence17–19 and the dual burden of malnutrition in the Colombian population.4 Differences in percentiles, especially in the group of adolescents of this study, could partly be explained by different physical activity levels or by differences in body fat distribution.4 Recently, Rodríguez-Valero et al.40 have suggested that physical activity and low physical fitness are independently associated with some cardiovascular risk factors in Colombian children and adolescents. In addition, the increased prevalence of high-calorie diets and low physical activity levels seen in Colombian children have contributed to the abdominal and visceral fat deposition in the young population.21,40 Research is therefore needed to assess, in addition to body composition, ecological determinants or factors influencing physical activity, such as access to play grounds or sport facilities, dietary intake, smoking, and socioeconomic level. This would enable us to better understand the multiple factors that may have an impact on body composition and the nutritional status of the schoolchildren evaluated.1,2
The main limitations of this study were those inherent in its cross-sectional nature and sampling procedure. Other variables potentially influencing body composition, such as ethnicity, socioeconomic level, nutritional status, physical activity levels, or fitness, were not included in the study. The main strength of the study was the use of a large population sample of both sexes adjusted for population expansion factors. This offers new perspectives regarding the health status and nutrition of schoolchildren in Bogotá (Colombia) which should be taken into account by anyone involved in the planning, decision-making, and implementation of health policies. In addition, the reference values of the FUPRECOL study are relevant for analyzing the risk factors for chronic diseases before they appear or in their early stages in order that action may be proposed to prevent their occurrence or decrease their long-term effect. According to Benjumea et al.,34 WC may be used as an early atherosclerotic signal for finding in supposedly healthy children and young adults those signals that could be treated and prevented among the wide range of diseases originating from and associated with atherosclerosis.
In conclusion, centile values can help us to make comparisons with other reference populations, and to estimate the proportion of schoolchildren with changes in body composition. Despite its importance, methodological simplicity, and clinical use, the measurement of WC is not yet part of the protocols for assessing nutritional and health status of schoolchildren in Bogotá (Colombia).
FundingThis study is part of the FUPRECOL project (Association of Grip Strength with Early Manifestations of Cardiovascular Risk in Colombian Children and Adolescents) funded by the Administrative Department of the Colombian Institute for the Development of Science, Technology, and Innovation (COLCIENCIAS), Contract No. 122265743978.
Conflicts of interestThe authors state that they have no conflicts of interest.
The authors especially thank students studying for a master's degree in Physical Activity and Health at Universidad del Rosario (Centro de Estudios en Medición de la Physical activity [CEMA]) and junior researchers from the GICAEDS Group of Universidad Santo Tomás for their technical support, training in the tests, and scientific and technological advice for field measurements.
Please cite this article as: Caicedo-Álvarez JC, Correa-Bautista JE, González-Jiménez E, Schmidt-RioValle J, Ramírez-Vélez R. Percentiles de circunferencia de cintura en escolares de Bogotá (Colombia): Estudio FUPRECOL. Endocrinol Nutr. 2016;63:265–273.
