


To analyze the relationship between glucose and glycated hemoglobin (HbA1c) in the adult Galician population, evaluate the use of HbA1c for the screening and diagnosis of diabetes, and calculate the diagnostic threshold required for this purpose.
MethodsWe analyzed data on 2848 subjects (aged 18–85 years) drawn from a study undertaken in 2004 to assess the prevalence of diabetes in Galicia. For study purposes, diabetes was defined using the criteria recommended in 2002. Participants were classified into four glucose-based groups. The relationship between glucose and HbA1c was described using linear regression models, generalized additive models and Spearman's correlation. Diagnostic capacity was assessed, and optimal HbA1c cut-off points were calculated as a diabetes marker using the receiver operating characteristic curve.
ResultsPrevalence of pre-diabetes, unknown diabetes and known diabetes was 20.86, 3.37 and 4.39%, respectively. The correlations between HbA1c and fasting glucose were higher than those obtained for HbA1c and glycemia at 2h of the oral glucose overload (0.344 and 0.270, respectively). Taking glucose levels as the gold standard, a greater discriminatory capacity was obtained for HbA1c (area under de cruve: 0.839, 95% confidence intervals: 0.788–0.890). Based on the study criteria, the optimal minimum and maximum HbA1c values were 5.9% and 6.7%, respectively.
Conclusions/interpretationHbA1c did not prove superior to glycemia for diagnosis of diabetes in the adult Galician population, and cannot therefore be used to replace the oral glucose tolerance test for screening and diagnosis purposes. Indeed, determination of glucose is essential to verify the diagnosis in the majority of cases.
Analizar la relación entre la glucosa y la hemoglobina glucosilada (HbA1c) en la población gallega adulta, evaluar el uso de la HbA1c para cribado y diagnóstico de la diabetes y calcular el umbral diagnóstico necesario para este fin.
MétodosSe analizaron datos de 2.848 sujetos (de 18–85 años de edad) procedentes de un estudio emprendido en 2004 para valorar la prevalencia de diabetes en Galicia. A efectos del estudio, se definió la diabetes de acuerdo con los criterios recomendados en 2002. Se clasificó a los participantes en cuatro grupos en función de los valores de glucosa. Se describió la relación entre glucosa y HbA1c mediante modelos de regresión lineal, modelos aditivos generalizados y la correlación de Spearman. Se valoró la capacidad diagnóstica y se calcularon los puntos de corte óptimos de la HbA1c como marcador de la diabetes empleando la curva de características operativas del receptor.
ResultadosLas tasas de prevalencia de prediabetes, diabetes desconocida y diabetes conocidas eran del 10,86, 3,37 y 4,39%, respectivamente. Las correlaciones entre la HbA1c y la glucemia en ayunas eran mayores que las obtenidas entre la HbA1c y la glucemia en ayunas dos horas después de la sobrecarga oral de glucosa (0,344 y 0,270, respectivamente). Tomando los valores de glucosa como referencia, se obtuvo una mayor capacidad discriminatoria para la HbA1c (área bajo la curva: 0,839, intervalos de confianza del 95%: 0,788–0,890). Basándose en los criterios del estudio, los valores óptimos mínimos de la HbA1c eran del 5,9 y el 6,7%, respectivamente.
Conclusiones/interpretaciónLa HbA1c no fue superior a la glucemia para el diagnóstico de la diabetes en la población gallega adulta, por lo que no puede utilizarse en lugar de la prueba de tolerancia oral a la glucosa con fines de cribado y diagnóstico. De hecho, la determinación de la glucosa es esencial para confirmar el diagnóstico en la mayoría de los casos.
Ascertaining the prevalence of diabetes is important because it is a disease that is becoming increasingly prevalent.1 Fasting glucose (FPG) and glycemia at 2h after an oral glucose overload test (2hOGTT) were classical and now also glycated hemoglobin (HbA1c) are used for diagnosis of diabetes. Although considered the “gold standard” for diagnosis, measurement of blood glucose is subject to several limitations as patient must fast at least 8h, it has a large biological variability, samples are not stable, numerous factors alter glucose concentrations (diurnal variation, sample source, acute illness or stress), and it reflects glucose homeostasis at a single point in time.2
HbA1c has advantages including its familiarity to clinicians, convenience, preanalytic stability, and assay standardization. It displays none of the variability inherent in the determination of glucose, it gives a better reflection of chronic hyperglycemia, and its concentration predicts the development of microvascular complications of diabetes.2,3 HbA1c has a number of limitations: may be altered by factors other than glucose (e.g., change in erythrocyte life span, ethnicity), some conditions interfere with measurement (e.g., selected hemoglobinopathies), it may not be available in some laboratories/areas of the world and its cost is higher than glucose determination.2
HbA1c cut-off point has been set at ≥6.5% for diagnosis and at 5.7–6.4% for the diabetes high risk category.4 The question arises, however, as to whether HbA1c identifies the same population as does glucose. Accordingly, the aim of this study was to analyze the relationship between glucose and HbA1c in the adult Galician population, and evaluate the performance of HbA1c for the screening and diagnosis of diabetes.
MethodsThe basic methodology of the study has been previously described.5,6 This study was carried out in a random sample representative of the Galician adult population (older than 18 years). Study subjects were selected by a two step cluster sampling procedure from the Galician Public Health Service (SERGAS) database, which covers more than 95% of the population. Primary health care centre dependent populations were randomly selected in each province (Galicia has four provinces; the population of each was considered as independent), and individual subjects aged over 18 years were then randomly selected within each population. Health centres were stratified by municipality type (rural or urban; coastal or interior); individuals were stratified by sex and age. Pregnant women were excluded from this study.
We contacted each person by mail in order to arrange the appointment for the study. For each non-responder a substitute was randomly selected. Information was collected through a personal interview at local health centres using a structured questionnaire, followed by a physical examination to measure blood pressure and anthropometric characteristics. Blood and urine samples were collected for subsequent analysis.
The study protocol was approved by the corresponding research ethics committee (Comité Ético de Investigación Clínica de Galicia). All participants signed informed consent forms.
The anthropometric measurements, including weight, height, waist circumference (WC) and hip circumference (HC), were obtained by trained personnel (physicians and nurses) using standardized techniques and equipment.7 Blood pressure was measured twice in recumbent position, with an interval of 3min; the final value was the arithmetic mean of the two figures. Blood samples were drawn after a fasting period of 10–14h.
Blood analyses were all done in the same central laboratory to which all samples were sent within the first 24h after immediate centrifuging and freezing.
To evaluate glucose metabolism, 75g of anhydrous glucose load was given orally in 250ml of water to all subjects except those with known diabetes. Fasting and 2h post-glucose load blood glucose were assessed by the glucose hexokinase method. HbA1c was measured by HPLC. All other laboratory determinations were done using standardized procedures.
We used the diagnostic criteria recommended in 2002 by the Expert Committee on the Diagnosis and Classification of Diabetes mellitus8 to classify diabetes and lesser degrees of impaired glucose regulation, as follows (a) normal glucose, i.e., fasting plasma glucose (FPG) <100mg/dL and 2hOGTT <140mg/dL; (b) impaired fasting glucose (IFG): PG between 100 and 125mg/dL; (c) impaired glucose tolerance (IGT): 2hOGTT between 140 and 199mg/dL; and (d) diabetes: PG ≥126mg/dL or 2hOGTT ≥200mg/dL. For comparisons, we used also the criteria recommended in 2011.4 These included a new category of increased risk of diabetes, when HbA1c is between 5.7% and 6.4%.
Statistical analysisBased on their oral glucose tolerance test (OGTT) results, participants were classified into four different groups: (1) normal glucose (NGM); (2) prediabetes (subjects presenting with IFG, IGT or both); (3) unknown diabetes (UKDM); (4) known diabetes (KDM) (subjects who reported suffering from diabetes or using insulin or drugs for treatment of diabetes).
The correlations between HbA1c and FPG, and between HbA1c and 2hOGTT were calculated using Spearman correlations, which were not based on the assumption of normality, whether in the total study population or in the respective subgroups defined.
After patients with known diabetes were excluded, HbA1c diagnostic capacity for diagnosis of diabetes was evaluated by using the receiver operating characteristic (ROC) curve and examining HbA1c sensitivity (Se) and specificity (Sp) measures at different cut-off values, accompanied by the corresponding area under ROC curve (AUC) and its 95% confidence intervals.9 The AUC assumes values ranging from 0 to 1, such that the nearer its value approaches 1 the higher the discriminatory capacity.
Based on the ROC curve, optimal cut-off points that best discriminated between the diabetic and non-diabetic populations were then calculated on the basis of different criteria, namely: (1) judging the optimal cut-off point to be that at which the Se and Sp measures were similar or practically the same10; (2) choosing the optimal cut-off point as being that at which Se and Sp were simultaneously maximized,11 thereby assuming that the consequences of false positives and false negatives were practically identical; (3) seeking the cut-off point which ensured that the Se and Sp values were the closest possible to 1 (criterion of the point closest to the point (0, 1) on the ROC curve)12; (4) taking the cut-off point that maximized Youden's index,13 which was equivalent to maximizing the sum of the Se and Sp measures; (5) selecting the cut-off point at which Sp was higher than or equal to a designated minimum value and, subject to this pre-condition, at which Se was as high as possible (to prevent a high number of false positives, in view of the high prevalence of diabetes); and (6) deeming the optimal cut-off point to be the value that maximized the percentage of correctly classified individuals or, what amounted to the same thing, that minimized the percentage of incorrect classifications of the diagnosis.14
To describe the effect of the different HbA1c diagnostic thresholds obtained, we calculated the Se and Sp measures and the positive (PPV) and negative predictive values (NPV) at these cut-off values.
All statistical analyses were performed using the R 2.12.0 statistical software package, with a p-value of ≤0.05 considered as statistical significant.
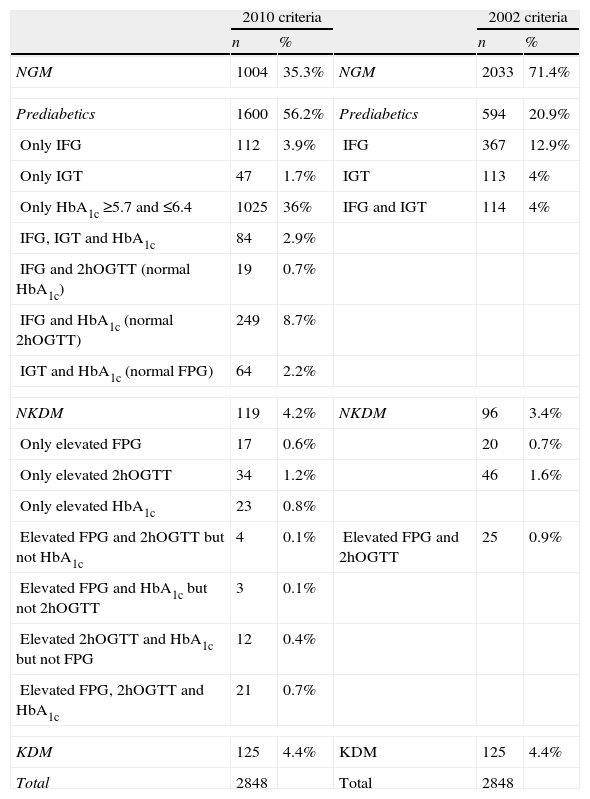
ResultsStudy population characteristicsOf the 2860 patients included in the study, 2850 (99.65%) were aged between 18 and 85 years. As no HbA1c values were available for two of the latter (0.07%), the analysis initially included a total of 2848 participants. In this sample, 125 (4.4%) subjects had known diabetes and 96 (3.4%) had unknown diabetes, if we used only the blood glucose criteria. Using also the HbA1c criterion, the number of subjects with unknown diabetes were 119 (4.2%). There were 23 subjects (19.3% of all subjects with diabetes) with HbA1c ≥ 6.5% and normal basal and 2h OGTT blood glucose. Seventeen subjects (14.3% with diabetes) had only met the criteria of fasting glucose, 34 (28.6%) met only the criterion of glucose at 2h, and 21 (17.6%) subjects met the three diagnostic criteria. Forty-five (37.8%) subjects met at least two criteria. Five subjects had a basal glucose higher than 126mg/dl with an HbA1c higher than 6.5% who did not undergo a 2hOGTT.
If we consider IFG and IGT as prediabetes, there were 2033 subjects with normal glucose metabolism and 594 (20.9%) had prediabetes according to the ADA 2002 criteria. If we considered the “at risk” HbA1c (between 5.7% and 6.4%) as another form of prediabetes, the number of subjects with prediabetes amounted 1600 (56.2%). A total of 1025 subjects had HbA1c between 5.7% and 6.4% with normal basal and 2h OGTT glucose. These data are detailed in Table 1.
Distribution of sample subjects according to the number of diagnostic criteria given.
| 2010 criteria | 2002 criteria | ||||
| n | % | n | % | ||
| NGM | 1004 | 35.3% | NGM | 2033 | 71.4% |
| Prediabetics | 1600 | 56.2% | Prediabetics | 594 | 20.9% |
| Only IFG | 112 | 3.9% | IFG | 367 | 12.9% |
| Only IGT | 47 | 1.7% | IGT | 113 | 4% |
| Only HbA1c ≥5.7 and ≤6.4 | 1025 | 36% | IFG and IGT | 114 | 4% |
| IFG, IGT and HbA1c | 84 | 2.9% | |||
| IFG and 2hOGTT (normal HbA1c) | 19 | 0.7% | |||
| IFG and HbA1c (normal 2hOGTT) | 249 | 8.7% | |||
| IGT and HbA1c (normal FPG) | 64 | 2.2% | |||
| NKDM | 119 | 4.2% | NKDM | 96 | 3.4% |
| Only elevated FPG | 17 | 0.6% | 20 | 0.7% | |
| Only elevated 2hOGTT | 34 | 1.2% | 46 | 1.6% | |
| Only elevated HbA1c | 23 | 0.8% | |||
| Elevated FPG and 2hOGTT but not HbA1c | 4 | 0.1% | Elevated FPG and 2hOGTT | 25 | 0.9% |
| Elevated FPG and HbA1c but not 2hOGTT | 3 | 0.1% | |||
| Elevated 2hOGTT and HbA1c but not FPG | 12 | 0.4% | |||
| Elevated FPG, 2hOGTT and HbA1c | 21 | 0.7% | |||
| KDM | 125 | 4.4% | KDM | 125 | 4.4% |
| Total | 2848 | Total | 2848 | ||
HbA1c: glycated hemoglobin; NGM: normal glucose metabolism; IFG: impaired fasting glucose; IGT: impaired glucose tolerance; FPG: fasting plasma glucose; 2hOGTT: plasma glucose value at 2h in oral glucose tolerance test; KDM: previously known diabetics; NKDM: unknown diabetics.
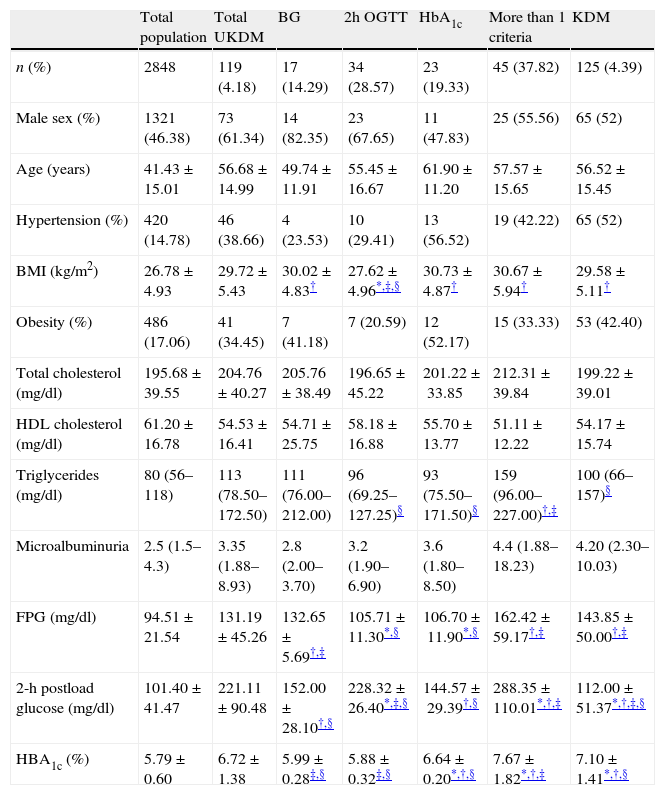
Table 2 shows the baseline characteristics of subjects classified according to the diagnostic criteria met. Body mass index, triglycerides and glucose concentrations (basal glucose, 2hOGTT and HbA1c) were statistically different among subgroups. BMI was lower in patients diagnosed only by OGTT than in the other subgroups (p<0.05 vs. diagnosed only by fasting glucose and p<0.01 vs. those diagnosed only by HbA1c or more than one criteria). There were no differences in the prevalence of obesity between subgroups. Triglyceride levels were significantly lower in patients diagnosed only after an OGTT or by HbA1c compared with those diagnosed by at least two criteria (p≤0.01). Basal glucose levels were higher in those diagnosed only by fasting glucose and in those who had at least two criteria (p<0.001 in all cases). The highest 2hOGTT concentrations were found in the group with at least two criteria (p<0.001). This parameter was also higher in the group diagnosed only by this criterion compared with those diagnosed only by fasting glucose or by HbA1c (p<0.001). The highest HbA1c concentration was that of the group with at least two criteria (p<0.001). There were no differences between subgroups in the prevalence of hypertension, cholesterol, HDL cholesterol or microalbuminuria.
Baseline characteristics of subjects according to the way to diagnose diabetes.
| Total population | Total UKDM | BG | 2h OGTT | HbA1c | More than 1 criteria | KDM | |
| n (%) | 2848 | 119 (4.18) | 17 (14.29) | 34 (28.57) | 23 (19.33) | 45 (37.82) | 125 (4.39) |
| Male sex (%) | 1321 (46.38) | 73 (61.34) | 14 (82.35) | 23 (67.65) | 11 (47.83) | 25 (55.56) | 65 (52) |
| Age (years) | 41.43±15.01 | 56.68±14.99 | 49.74±11.91 | 55.45±16.67 | 61.90±11.20 | 57.57±15.65 | 56.52±15.45 |
| Hypertension (%) | 420 (14.78) | 46 (38.66) | 4 (23.53) | 10 (29.41) | 13 (56.52) | 19 (42.22) | 65 (52) |
| BMI (kg/m2) | 26.78±4.93 | 29.72±5.43 | 30.02±4.83† | 27.62±4.96*,‡,§ | 30.73±4.87† | 30.67±5.94† | 29.58±5.11† |
| Obesity (%) | 486 (17.06) | 41 (34.45) | 7 (41.18) | 7 (20.59) | 12 (52.17) | 15 (33.33) | 53 (42.40) |
| Total cholesterol (mg/dl) | 195.68±39.55 | 204.76±40.27 | 205.76±38.49 | 196.65±45.22 | 201.22±33.85 | 212.31±39.84 | 199.22±39.01 |
| HDL cholesterol (mg/dl) | 61.20±16.78 | 54.53±16.41 | 54.71±25.75 | 58.18±16.88 | 55.70±13.77 | 51.11±12.22 | 54.17±15.74 |
| Triglycerides (mg/dl) | 80 (56–118) | 113 (78.50–172.50) | 111 (76.00–212.00) | 96 (69.25–127.25)§ | 93 (75.50–171.50)§ | 159 (96.00–227.00)†,‡ | 100 (66–157)§ |
| Microalbuminuria | 2.5 (1.5–4.3) | 3.35 (1.88–8.93) | 2.8 (2.00–3.70) | 3.2 (1.90–6.90) | 3.6 (1.80–8.50) | 4.4 (1.88–18.23) | 4.20 (2.30–10.03) |
| FPG (mg/dl) | 94.51±21.54 | 131.19±45.26 | 132.65±5.69†,‡ | 105.71±11.30*,§ | 106.70±11.90*,§ | 162.42±59.17†,‡ | 143.85±50.00†,‡ |
| 2-h postload glucose (mg/dl) | 101.40±41.47 | 221.11±90.48 | 152.00±28.10†,§ | 228.32±26.40*,‡,§ | 144.57±29.39†,§ | 288.35±110.01*,†,‡ | 112.00±51.37*,†,‡,§ |
| HBA1c (%) | 5.79±0.60 | 6.72±1.38 | 5.99±0.28‡,§ | 5.88±0.32‡,§ | 6.64±0.20*,†,§ | 7.67±1.82*,†,‡ | 7.10±1.41*,†,§ |
Values are mean±SD, or percentage or medians (25th–75th percentils). BMI: body mass index; HDL: high density lipoprotein; FPG: fasting plasma glucose; KDM: previously known diabetes; UKDM: unknown diabetes; BG: diabetes diagnosed only by basal glucose criterion; 2h OGTT: diabetes diagnosed only by 2h OGTT criterion; HbA1c: diabetes diagnosed only by HbA1c (glycated hemoglobin) criterion. Percentage of UKDM and KDM is from total sample. Other percentages are expressed from UKDM.
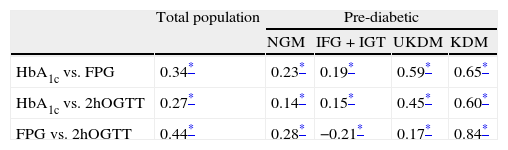
For the calculation of correlations and associations, patients who did not undergo a 2hOGTT (102 individuals, 3.58%) were excluded, leaving a total of 2746 patients for this analysis. Fitting a linear regression model yielded R2 values of 0.46 for the association between FPG and HbA1c, and 0.33 for that between 2hOGTT and HbA1c (both significant at p<0.01). Table 3 shows the Spearman correlations for HbA1c, FPG and 2hOGTT. In the total population, the correlations between HbA1c and FPG were higher than those between HbA1c and 2hOGTT (0.344 and 0.270, respectively). The correlation between FPG and 2hOGTT levels was 0.445, i.e., slightly higher than those between HbA1c and FPG.
Spearman correlations between glycated hemoglobin, fasting plasma glucose and glycemia at 2h of oral glucose tolerance test in the total population and in each subgroup.
| Total population | Pre-diabetic | ||||
| NGM | IFG+IGT | UKDM | KDM | ||
| HbA1c vs. FPG | 0.34* | 0.23* | 0.19* | 0.59* | 0.65* |
| HbA1c vs. 2hOGTT | 0.27* | 0.14* | 0.15* | 0.45* | 0.60* |
| FPG vs. 2hOGTT | 0.44* | 0.28* | −0.21* | 0.17* | 0.84* |
HbA1c: glycated hemoglobin; FPG: fasting plasma glucose; 2hOGTT: glycemia at 2h of oral glucose tolerance test; NGM: normal glycemia; IFG: impaired fasting glucose; IGT: impaired glucose tolerance; UKDM: unknown diabetes; KDM: known diabetes.
Fig. 1 depicts the ROC curve of HbA1c as a tool for screening and diagnosis of diabetes. The AUC was 0.839 (95% CI 0.788–0.890). Table 4 shows the diagnostic properties of different HbA1c cut-off values. As the cut-off level rose, Sp increased and Se decreased. The cut-off point at which Se and Sp were approximately equal (0.771 and 0.717, respectively) was 5.9% (95% CI 5.9–6.0), a value close to one standard deviation above mean HbA1c in healthy subjects. Of the individuals with HbA1c ≥5.9%, only 9% had glucose levels the were diagnostic of diabetes. The optimal HbA1c value which simultaneously maximized Se and Sp (0.729 and 0.824, respectively) and which corresponded to the point on the ROC curve closest to the point (0,1) was 6% (95% CI 5.9–6.0). Only 13% of patients with HbA1c ≥6% had glucose indicative of diabetes; 33% of pre-diabetic individuals had HbA1c ≥6%; and only 54% of subjects with UKDM had HbA1c values ≥6%.

Receiver operating characteristic curve for identification of participants with previously undiagnosed diabetes, using glycated hemoglobin and fasting plasma glucose for diagnosis and fasting plasma glucose and glycemia at 2h of oral glucose tolerance test as disease criteria. AUC: area under the curve; FPG: fasting plasma glucose; HbA1c: glycated hemoglobin; ROC: receiver operating characteristic curve; Se: sensitivity; Sp: specificity.
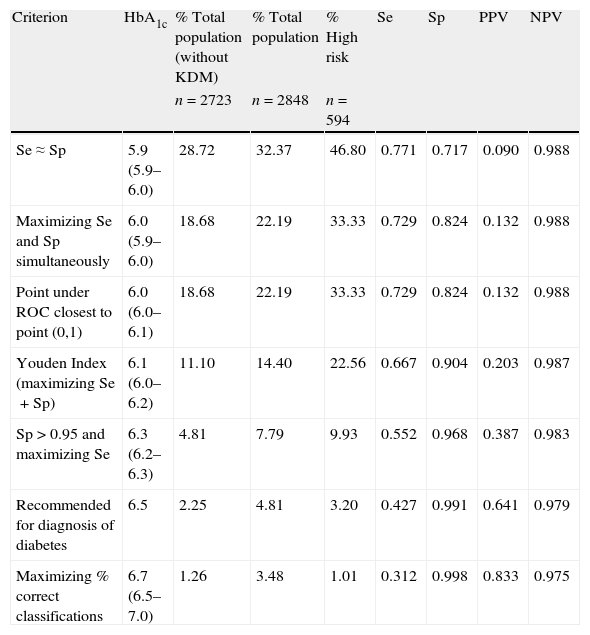
Sensitivity, specificity, positive predictive value, and negative predictive value for diabetes mellitus using different glycated hemoglobin cut-off points. Brackets include 95% bootstrap confidence intervals for the cutoff points.
| Criterion | HbA1c | % Total population (without KDM) | % Total population | % High risk | Se | Sp | PPV | NPV |
| n=2723 | n=2848 | n=594 | ||||||
| Se≈Sp | 5.9 (5.9–6.0) | 28.72 | 32.37 | 46.80 | 0.771 | 0.717 | 0.090 | 0.988 |
| Maximizing Se and Sp simultaneously | 6.0 (5.9–6.0) | 18.68 | 22.19 | 33.33 | 0.729 | 0.824 | 0.132 | 0.988 |
| Point under ROC closest to point (0,1) | 6.0 (6.0–6.1) | 18.68 | 22.19 | 33.33 | 0.729 | 0.824 | 0.132 | 0.988 |
| Youden Index (maximizing Se+Sp) | 6.1 (6.0–6.2) | 11.10 | 14.40 | 22.56 | 0.667 | 0.904 | 0.203 | 0.987 |
| Sp>0.95 and maximizing Se | 6.3 (6.2–6.3) | 4.81 | 7.79 | 9.93 | 0.552 | 0.968 | 0.387 | 0.983 |
| Recommended for diagnosis of diabetes | 6.5 | 2.25 | 4.81 | 3.20 | 0.427 | 0.991 | 0.641 | 0.979 |
| Maximizing % correct classifications | 6.7 (6.5–7.0) | 1.26 | 3.48 | 1.01 | 0.312 | 0.998 | 0.833 | 0.975 |
Se: sensitivity; Sp: specificity; PPV: positive predictive value; NPV: negative predictive value; HbA1c: glycated hemoglobin; ROC: receiver operating characteristic curve; KDM: previously known diabetics.
The cut-off point that maximized the sum of Se (66.7%) and Sp (90.4%) was 6.1% (95% CI 6.0–6.2). Among the individuals with HbA1c ≥6.1%, 20% had glucose concentrations indicative of diabetes. This cut-off point would detect 69.4% of all subjects with UKDM. A total of 29% of participants at high risk of suffering diabetes (those with IFG or IGT) had HbA1c ≥6.1%.
The HbA1c value at which Sp was greater than 95% and Se was at its highest possible level, was 6.3% (95% CI 6.2–6.3). This yielded a Se of 55.2% and a Sp of 96.8%. In this case, 39% of patients had glucose concentrations that were diagnostic of diabetes.
The cut-off point that minimized the percentage of incorrect classifications was 6.7% (95% CI 6.5–7.0; Se 0.312; Sp 0.998; 83% of subjects with glucose concentrations that were diagnostic of diabetes). This cut-off value coincides exactly with that corresponding to 4 standard deviations above mean HbA1c in normal subjects. Of all subjects having HbA1c ≥6.5% and ≥7%, 64% and 92% had glucose concentrations diagnostic of diabetes, respectively. Of the total study population, however, only 2% had HbA1c concentrations >6.5%, and 0.8% had HbA1c concentrations >7%. In the present study, the cut-off value of 6.5% coincided with approximately three deviations above the mean HbA1c of normal individuals (without diabetes and with a low risk of diabetes).
To compare the diagnostic properties of HbA1c against those of FPG, the ROC curve was also calculated for FPG (see Fig. 1), using the criteria proposed in 2002. The AUC for FPG was 0.938 (95% CI 0.908–0.968), which was higher than that of HbA1c.
DiscussionIn this adult Galician population, we found a prevalence of diabetes of 7.8% using the ADA 2002 criteria (57% knew their condition but 43% had unknown diabetes) and a prevalence of 8.6% (51.2% KDM and 48.8% NKDM) according to the ADA 2010 criteria. This prevalence is clearly lower than that of 13.8% described recently for the whole of Spain.15 There are slight methodological differences between studies and we do not believe that they are responsible for this difference. In the present study, there were almost no resignations for the performance of the OGTT while these occurred in a significant proportion of the study of Soriguer et al. In fact, probably the study in all Spain would have had more cases of diabetes if they had performed OGTT to the entire study population and in this case the difference with our sample would have been even greater. The only reason we find for explaining differences in both prevalences is the time elapsed between the studies. Distribution of known and unknown diabetes is the same in the Galician and Spain studies which could be due to the use of the same screening methods for detecting diabetes.
We had 20.9% of subjects classified as having prediabetes with the ADA 2002 criteria (12.9% only with IFG, 4% only with IGT and 4% with both IFG and IGT). Theses figures are different from those of the Di@bet.es Study (14.9% prediabetes: 3.4% IFG, 9.2% IGT, 2.2% combined IFG-IGT). It is surprising that having almost twice the prevalence of diabetes in the most recent study however the prevalence of prediabetes is lower and also has a different distribution of the types of abnormalities of glucose metabolism.
On the basis of a HbA1c 5.7–6.4% criterion, 1025 individuals had prediabetes. These were a total of 1600 with this condition if we also included IFG and IGT. It is difficult to accept that more than half of the population has a metabolic disorder; thus, we believe that the HbA1c in our population should not be used as a criterion for classifying a person as having prediabetes.
The correlations between HbA1c and glucose concentrations are low in comparison with those obtained in patients with known diabetes, and a weak linear relationship is observed between the them. These low correlations may indicate that HbA1c and glucose reflect different metabolic conditions, essentially in the range of glucose tolerance values indicative of non-diabetic subjects. Furthermore, the degree of glycosylation is known to vary among individuals,16 an aspect that cannot be analyzed by this study, as glycemia was not monitored throughout the day. This might also indicate that these low HbA1c-glucose correlations obtained could be due to variability of FPG and 2hOGTT in individuals.17 A wide range of average glucose levels for individuals with the same HbA1c levels has been described, and this range is wider at the lowest HbA1c levels amd decreases with increasing HbA1c concentrations.18 The correlation values observed in the current study were comparable to those reported by similar previous studies.19 The correlations between HbA1c and glucose were higher in patients with known versus unknown diabetes. One explanation for this may lie in the degree of glycemic control, particularly among patients who are already receiving appropriate treatment with insulin or oral antidiabetics. One study20 reported that, for any given HbA1c level, the glycemic levels of patients in different treatment groups were not the same. The correlations observed by us among patients with known diabetes were similar to those reported by Nathan et al.,18 who carried out glycemic monitoring in subjects with known diabetes, and Van’t Riet et al.,19 who also obtained higher correlations among patients with known than among those with unknown diabetes.
Correlations depend on differences in the ranges of the variables studied, and tend to be lower in subgroups with narrower ranges. In our study, however, the correlations between glucose and HbA1c were higher in subjects with diabetes than in the total population, but the ranges of the HbA1c and glucose values were nevertheless wider in the total population. It must therefore be concluded that differences in the ranges of the variables do not constitute the only explanation for differences found in the correlations between the total population and the subgroups with diabetes.
In this study sample, FPG displayed a greater AUC than did HbA1c, indicating that the diagnostic capacity of FPG is greater than that of HbA1c. This could be related to the fact that glucose is used as the reference method to establish the criteria for diagnosing the disease. This result also agrees with those of a Dutch study19 and other studies which were also population-based and concluded that HbA1c had no additional diagnostic value compared with FPG used in isolation, except in groups with a high risk of suffering diabetes.21 In these groups HbA1c may help to optimize the use of OGTT.22
The HbA1c value of 6% which simultaneously maximized Se and Sp in the current sample coincides exactly with the recently proposed cut-off point for screening individuals with a high risk of suffering diabetes. This would identify 40% of patients with intermediate glucose levels. The cut-off point that maximized Se and Sp was 6.1%.
An HbA1c value ≥7% yielded an Sp of close on 100% (99.9%), and 91% of subjects had glucose indicative of diabetes. A slightly higher cut-off point would have to be set in order to be able to dispense with any additional test for diagnosis of diabetes. The principal limitation of these diagnostic criteria is their low Se in return for a high Sp, something that is in line with the results of other studies.19,23 Accordingly, an OGTT would have to be performed to confirm the diagnosis in most cases.
Based on HbA1c-glucose correlation values for the total population, the Se and Sp attained, and greater AUC for glucose, the use of HbA1c instead of glucose values in the adult Galician population would not be advisable. Indeed, the advantages of using HbA1c instead of the OGTT for the screening and diagnosis of diabetes mellitus are limited, and in most patients measurement of glucose will still be necessary to verify the diagnosis. Even so, despite its limitations, HbA1c may be superior to OGTT in terms of cost-effectiveness and practical utility in the clinical setting. HbA1c is less time-consuming than OGTT, can be measured at any time of day regardless of fasting, and can be analyzed with a small amount of the sample.24 Furthermore, HbA1c is a more complete measure of total glycemic exposure, inasmuch as it is indicative of glucose, not only in a fasting and but also in a postprandial state. The high correlation between HbA1c and the presence of microvascular diabetic complications,25–28 and its association with cardiovascular diseases, even in the nondiabetic glucose-tolerance range of values29 might indicate its usefulness as a diagnostic method among patients with a longer-term risk than that predicted by glucose.
The establishment of optimal cut-off points for HbA1c in clinical practice calls for more in-depth research. There may even be different characteristics/covariates that influence the HbA1c discriminatory capacity as a diagnostic marker of diabetes mellitus, and different optimal cut-off points would therefore have to be defined in accordance with the values of such covariates.
Our study could be completed after 5–10 years with a new cross-section on the same population and detect the patients that not having diabetes, but with levels of HbA1c between 5 and 6.5%, develop diabetes after these years. As shown in the study published by Cheng et al.,30 HbA1c levels ≥5 increase the risk of diabetes after 4 years monitoring. Also another study31 proved that HbA1c is a strong predictor of diabetes when it is within the limits 5 and 6.5%,and HbA1c has also been shown as a good predictor of future diabetes in Spain.32
In conclusion, the use of glycated hemoglobin as a criterion for diagnosing diabetes mellitus does not identify exactly the same subjects than the glucose criteria and we must have this in mind when we make this diagnosis. We believe that the maximum utility could be its use for initial screening but always confirming the existence of diabetes using plasma glucose concentration. More studies are needed to establish in the long term the most useful criteria for identifying individuals with increased risk of morbidity and mortality.
FundingM. López-Ratón and C. Cadarso-Suárez gratefully acknowledge the financial support of the Spanish Ministry of Science & Innovation (grants MTM2008-0163, MTM2010-09213-E and MTM2011-28285-C02-00).
Conflicts of interestThe authors have no conflicts of interest to declare.
